 ISSN: 2822-0838 Online

Evaluation on Carbon Storage in Aboveground Biomass of Yang na at Plant Genetic Protection Area, Ubon Ratchathani Province
Penprapa Phetcharaburanin*, Nittaya Chakkamrun, and Pimpisa KulninworpaengPublished Date : 2020-05-12
DOI : https://doi.org/10.12982/CMUJNS.2020.0026
Journal Issues : Number 3, July-September 2020
ABSTRACT We aimed to study the ecological service in Plant Genetic Protection Area Ubon Ratchathani Zoo, Ubon Ratchathani Province, Thailand, by focusing upon the carbon storage in aboveground biomass and influences of canopy of the Yang na (Dipterocarpus alatus Roxb. ex G.Don.) Moreover, the current study aimed to investigate influences of canopy of Yang na on other factors. The plant survey was undertaken using quadrat sampling method with an area of 2,400 m2 for 6 sampling plots of 20x20 m., trees (DBH > 4.5 cm and height > 1.30 m). Our results showed that the Plant Genetic Protection Area Ubon Ratchathani Zoo which is classified as dipterocarp forest and dry evergreen forest had 30 of tree species and 21 families. The most abundant tree species included Dipterocarpus alatus Roxb.ex G.Don, Canarium subulatum Guillaumin, Ellipanthus tomentosus Kurz var. tomentosus and Parinari anamensis Hance. Besides, 17 species and 13 families of undergrowth plants were found in the area. Polyalthia evecta (Pierre) Finet & Gagnep., and Polyalthia debilis Finet & Gagnep were the predominance plants. According to the analysis on plant community, our results show that the canopy of Yang na had the highest importance value index (129.23) suggesting that canopy of Yang na is plentiful and very important for ecology in the study area. The total aboveground biomass of Yang na was 39.40 tons/1,600 m2 (rai), and carbon storage in aboveground biomass was 19.53 tons/rai. Moreover, carbon storage in aboveground biomass’s was found highest in trunk (14.65 tons/rai), followed by branch (2.96 tons/rai), and leaf (1.92 tons/rai). When analyzing the relationship between aboveground biomass and circumference and height, and the relationship between Yang na’s carbon storage and circumference and height using Pearson Correlation Coefficient, we found that there was a high - level relationship with a statistical significance at a level of 0.01. In addition, our findings revealed that a total of wood volume was 26.0946 m3 or 0.5219 m3 of each tree. Furthermore, the average of canopy coverage in Yang na was 87.2%. When investigating the relationship of a percent of canopy coverage, circumference, height, and wood volume, we found that there was less and averagely opposite relationship. In contrast, there was high relationship in the same direction when the relationship of a percent of canopy coverage in Yang na was analyzed. There was, moreover, averagely opposite relationship when examining the relationship of a percent of canopy coverage in Yang na and the amount of other trees. Collectively, when there was a higher percentage of canopy coverage of Yang na, the circumference, height, and wood volume of Yang na slightly decreased. Moreover, a large number of Yang na was accompanied with a smaller number of other trees in the plots, and there was also a small quantity of plant species diversity. Therefore, it could be suggested that the Ubon Ratchathani Zoo should promptly implement the plan for the promotion and conservation of Yang na as well as knowledge transfer activities to communities.
Keywords: Carbon storage, Aboveground biomass, Dipterocarpus alatus Roxb. ex G.Don, Influences of canopy, Tree volume, Importance value index
INTRODUCTION
Global warming or climate change has intensified and damaged many countries according to a report by the Intergovernmental Panel on Climate Change (IPCC). In 2007, it was clear that the current climate change was caused by the increase of greenhouse gases in the world atmosphere and over 90 percent of these greenhouse gases are released from human activities, such as fossil fuel burning, deforestation, agriculture and industrial processes. In particular, carbon dioxide (CO2) has the highest emission factor at 77% of all greenhouse gases (World Resources Institute, 2006). The increase in carbon dioxide in the atmosphere is about 20 percent due to the loss of carbon stored in the wood (Office of Environmental Policy and Planning, 2000) It is well known that forests can adsorb carbon dioxide as a component of wood and tree elements in the form of biomass from the previos study of forest management in Asia of Brown (Brown, 1996). There are 133 million hectares of natural forest and 48 million hectares of natural forest waiting to be managed and replaced. This area is expected to have a potential to adsorb CO2 up to 24 PgC (1 PgC = 1,015 g) by 2050. In Thailand, natural forests cover only 28 percent of the country's area. Carbon monoxide can accumulate up to 86% of all carbon in the form of biomass and about 10% are collected in the form of forest biomass covering 8.7% of the country (Openshaw, 1997). It can be seen that the forest plantation and natural forests can be a source of CO2 storage to reduce greenhouse gas emissions and global warming. However, the potential for storage of CO2 and the amount of carbon accumulated in various forests are different depending on the nature and structure of the plant species (Ogawa et al., 1965; Tsutsumi et al., 1983; Boonpragob, 1996; Tangtham and Tantasirin, 1997; Negi et al., 2003).
Yang na is a large-sized plant and is native to Southeast Asia. Its height can be up to 50 meters and has a circular cross-section up to 7 meters. In Thailand, it is found in all dry evergreen forests of the country, especially in the Northeast. Yang na is a traditional wood and a dominance in the Ubon Ratchathani Zoo. More than 1,000 trees were found and some were aged over 100 years. Yang na is a versatile wood as it can be beneficial to almost every part. The ecological benefits of Yang na also include temperature control, shade, wind protection, and preventing erosion of the benthic soil. Furthermore, it is found to be beneficial for the growth of mycorrhizal fungi in dry evergreen forest, called rainforest mushrooms that are consumable (Woodland Campus Park, 2014). The zoo organization under the Patronage of His Majesty the King has taken the Ubon Ratchathani Zoo to the Royal Initiative for Her Royal Highness Princess Maha Chakri Sirindhorn Plant Genetic Conservation Project. Although there are many Yang na in the area, its database is unavialable. In addition, the study area is under care of Ubon Ratchathani Zoo, Resouces protection area of The Royal Initiative of Her Royal Highness Princess Maha Chakri Sirindhorn.
This research focuesses on the study of carbon adsorption of Yang na to estimate amount of carbon accumulated in Yang na in Ubon Ratchathani Zoo, Ubon Ratchathani Province and canopy effect of Yang na on other plants by studying the relationship between canopy cover and wood volume of Yang na, height and circumference. The results of this study can be applied for forest management of soil and water conservation, especially in forest management to produce wood directly. Moreover, this research provides the important database to raise awareness for the value of forest resources and the global climate changes to the local community as a guideline for forest ecosystem management in Ubon Ratchathani Zoo.
Objective of the Study
We aimed to study the aboveground biomass and to estimate the amount of carbon sequestration in the aboveground biomass of Yang na. In addition, the current study was to investigate the relationship of Yang na canopy to various factors in the area of Ubon Ratchathani Zoo.
Study Area
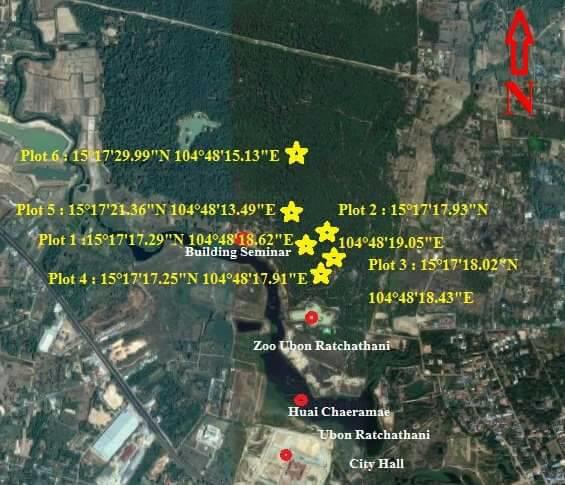
Figure 1. The study area: Ubon Ratchathani Zoo, Ubon Ratchathani Province, the image on the map and coordinates plots.
MATERIAL AND METHODS
Parameters
The plots were recorded using GPS system. Data were collected and shown in the plots including the measurement of circumference of the trees at the breast height, height measurement, and the undergrowth plants were recorded. Photos of Yang na’s canopy were obtained through randomly selecting representatives of all six plots for 50 trees. Physical measurements within the plot included light intensity, relative humidity, wind speed, pH, humidity, and soil temperature.
Data collections
Data collection in the area of Ubon Ratchathani Zoo was carried out using quadrat sampling method with the size of 20x20 square meter in six plots of 2,400 square meter as shown in Figure 2.
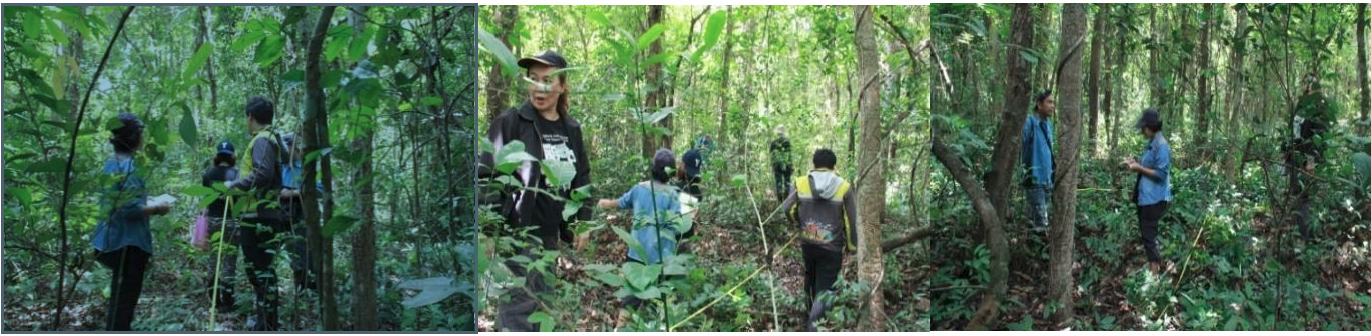
Figure 2. Plots plan for data collection.
1) Record the coordinates of 6 plots by using GPS.
2) Record all type of trees in all plots. Identify local names, common names, and the taxonomy of plants and so on.
3) Measure the circumference of the tree at the breast height (1.30 mater). To calculate the diameter at breast height (DBH) showed in Figure 3 (a), and measure the height of the tree with a height meter (HAGA) showed in Figure 3 (b).
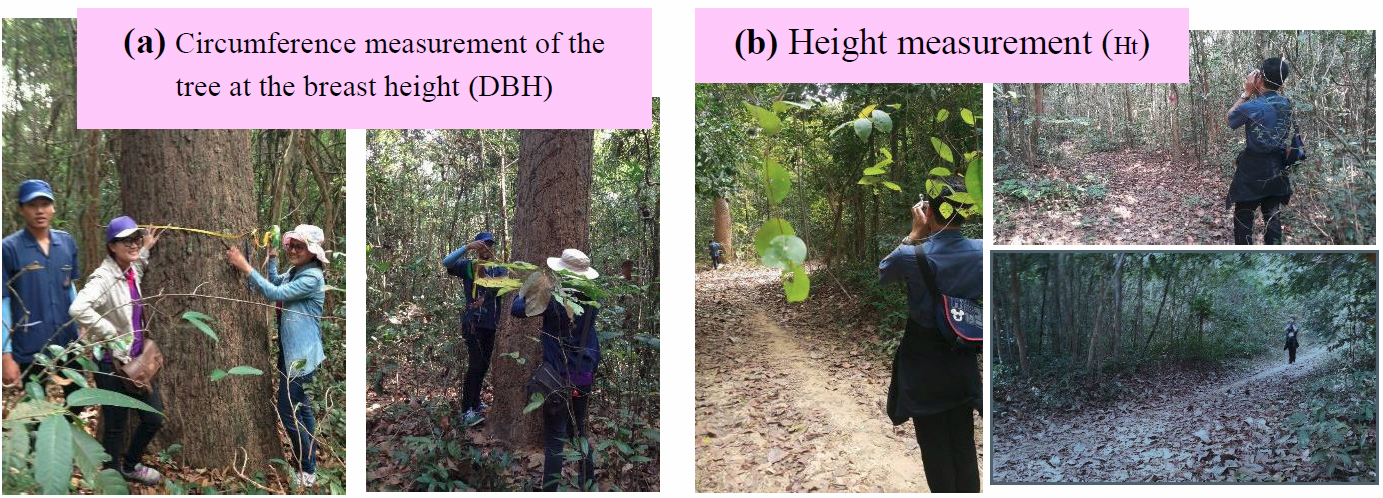
Figure 3. (a) Measure the circumference of the tree at the breast height (DBH). (b) Measure the height of the Yang na tree.
4) Record the type of undergrowth plants. Identify local names, common names, and scientific names.
5) Use a digital camera (Canon EOS 80D with Kit EFS 18-135 lens) Set photo size at 1,024 x 724 pixels. Photo Yang na trees by randomly selected representatives of all 6 plots for 50 trees by put the camera on the tripod in the upright position on the lens. Place the tripod with the camera body exactly. Set the camera to 1.30 meters from the ground. Determine the north by the position on the lens. Try to avoid the sun from entering the image. To calculate the percentage of canopy cover from photos. The percentage in the area covered by leaves and branches use to study the relationship of forest cover. Measure the circumference, diameter of each tree, the length or height at 1.30 meters to the end of the trunk.
6) Physical measuring instruments: light intensity, relative humidity, wind speed, pH, soil moisture and soil temperature as shown in Figure 4.
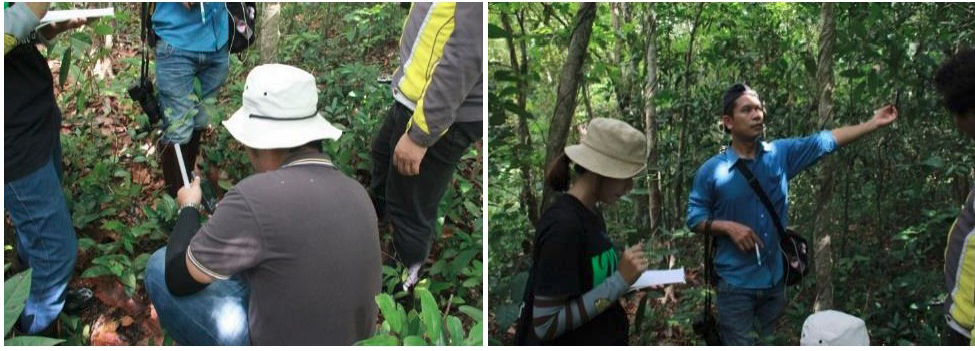
Figure 4. Important parameters measurement in the plots.
Data analysis
Analysis of the plants community value and the important physical data in the sample plots. Distribution analysis by calculates the frequency of the plant species found in the plots; equation (1) and (2):
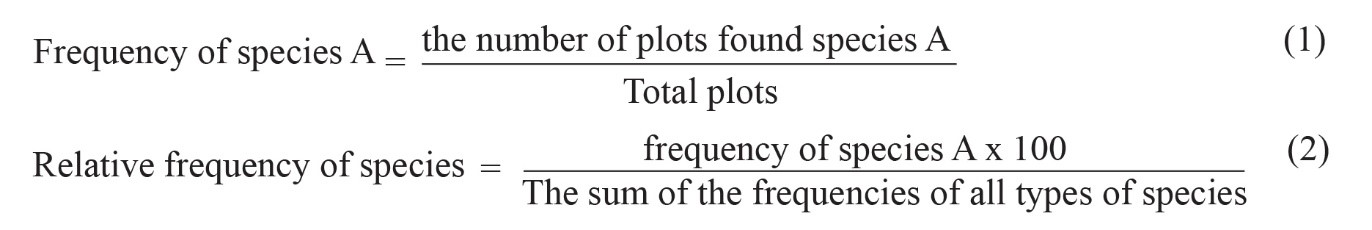
Determination of the density of tree species found in the sample plot; equation (3) and (4):
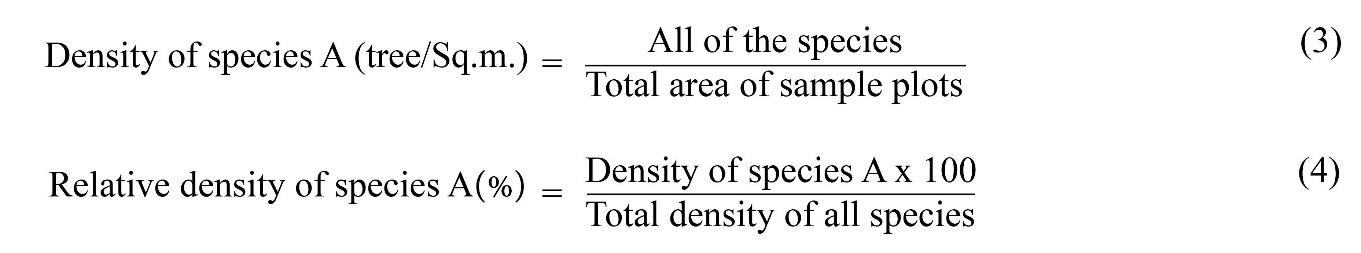
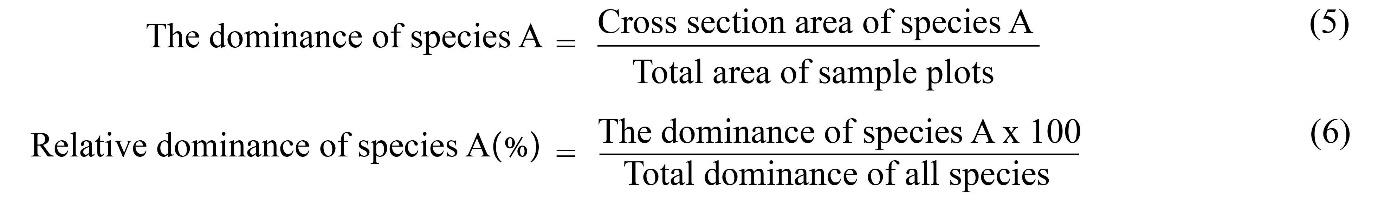
Dominance analysis using the calculation of the dominance of plant species found in the plots; equation (5) and (6):
Importance Value Index, IVI: A quantitative value that shows an overview of the ecological importance of the plant itself. Which calculates from the sum of relative frequency, relative density and relative dominance. IVI of each plant = 0 – 300 (Ruangpanit, 2003). Calculate IVI with equation (7):
IVI = relative frequency + relative density + relative dominance (7)
Analysis of Yang na species
Data of Yang na found in each plot was analyzed including the total number of Yang na and the mean of DBH and the height using the following equation (8):
Diameter at breast height (DBH) = The circumference of the tree at the breast height (GBH)/π (8)
Analysis of soil biomass of Yang na
In the assessment of carbon sequestration in forests, dry weight of biomass was taken in account and multiplied by 0.47 for estimation of carbon (C) (IPCC, 2006). The biomass of dry evergreen forest was calculated using previously reported equation (Tsutsumi et al., 1983). Due to the nature of the forest in the embankment area of Ubon Ratchathani Zoo, it is a dry evergreen forest with dipterocarp forests and for the young trees with a diameter at breast height (DBH) less than 4.5 cm.as determined in the previous study by Thiti Visarat and Chonthida Chernkhuntod (Visaratana and Chernkhuntod, 2004) (Table 1).
Table 1. Allometric equation used to calculate the biomass of trees and young trees in dry evergreen forest.
|
Forest type |
Equation |
Reference |
|
|
Dry evergreen forest: size of large tree DBH > 4.5 cm
|
Ws = 0.0509 DBH2Ht 0.919 Wb = 0.00893 DBH2Ht 0.977 Wl = 0.0140 DBH2Ht 0.669 Wr = 0.0313 DBH2Ht 0.805 |
Tsutsumi et al. (1983) |
|
|
Dipterocarp forest: size of large tree DBH > 4.5 cm |
Ws = 0.0396 D2H 0.9326 W = 0.003487D2H 1.0270 Wl = (28.0/Wtc+0.025)–1 |
Ogawa et al. (1965) |
|
|
Dry evergreen and Dipterocarp forest: size of young tree DBH < 4.5 cm
|
Ws = 0.0702 DBH2Ht 0.8737 Wb = 0.0093 DBH2Ht 0.9403 Wl = 0.0244 DBH2Ht 1.0517 |
Visaratana and Chernkhuntod (2004) |
|
|
Where: Ws = Biomass of the trunk (kg) Wb = Biomass of the branch (kg) Wl = Biomass of leaves (kg) Wr = Biomass of root (kg) DBH = Diameter at breast height (cm) Ht = Height of tree (m) |
|
||
Analysis of carbon storage in biomass above ground of Yang na.
Regarding the data of the aboveground biomass of Yang na, it can be used to extimate the amount of carbon sequestration in the biomass above the ground through the calculation of carbon content in each part of Yang na and which was in turn multiplied with biomass above the ground.The recommended carbon contents in the biomass of the trunk, branches and leaf were 49.9%, 48.7%, and 48.3%, respectively (Tsutsumi et al., 1983).
Analysis of canopy effects and the relationship of Yang na canopy to other factors.
Calculate percentage of canopy cover in Yang na from photos by sampling of 50 trees, calculate only the percentage that was covered with leaves and branches under that tree, which was modified from Dot grid method (Assmann, 1970) and canopy cover measurement of the institute for the Promotion of Teaching Science and Technology (IPST, 2016), researcher divide photos into 100 channels and cross every channel and count the number of cross points that correspond to the canopy space. (The parts that do not have leaves and branches covered) are calculated as follows equation (9)
Percentage of canopy cover = 100 – Number of crossings that match the space
100 (9)
The example for calculation
Number of crossings that match thee space. (Red color) = 20
Percentage of canopy cover = 100 – 20
100
Percentage of canopy cover = 80
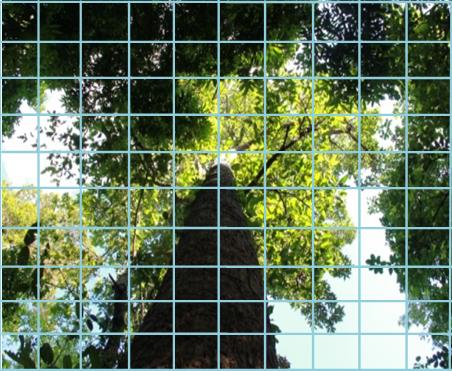
Figure 5. The method to calculate the percentage of canopy cover from photos.
Calculate the volume of wood by modifying the Huber’s formula (Husch et al., 1982): equation (10)
V = H (Area) (10)
Where V = Volume of wood (cubic meter)
H = The height of tree (meters)
Area = Cross-sectional area of the wood center (Square meter).
Calculate cross-sectional area of the wood center in each wood at 1.30 m. by using equation (11)
Area = πd2/4 (11)
Where d = Diameter of the center pieces
The statistical data were used to find the relationship between canopy cover and other factors such as number of trees in plots, plant species, volume of wood, circumference and height
RESULTS
Analysis of the plants community value and the important physical data in the sample plots
The results show that there was a total of 385 trees divided into 30 species and 21 families. There were 233 Yang na accompanied with Ma kok kluean, Ma pok and Ta nok kod, 19 trees for each type. Furthermore, there were 17 species of 13 families of undergrowth plants of which Nom noi (Polyalthia evecta (Pierre) Finet & Gagnep.) and Kluai Tao (Polyalthia debilis Finet & Gagnep.) are the most predominance species.
The frequency of Species
Our results demonstrate that Yang na and Ma kok kluean showed the highest relative frequency of 8.22% that were widespread over the study areas, followed by Ta nok kod, Pha yom, Ma pok, and Mueat hom with the relative frequency of 6.85%.
The density and abundance of Species
We found that Yang na showed the highest density with the relative density of 59.60%, followed by Ma kok kluean, Ma pok and Ta nok kod, accounting for 4.86%.
The dominance of Species
Yang na demonstrate the highest dominance of 61.41%, followed by Ma kok kluean (8.31%) and Ma pok (6.61%).
Importance value index (IVI )
Importance value index (IVI) indidcates the ecological influence of each species in the forest. In the current study, Yang na had the greatest IVI (29.23%), followed by Ma kok kluean (21.39%) and Ma pok (18.32%).
Based on the results of plant social values analysis at Ubon Ratchathani Zoo, Yang na was a dominant tree and was important for the ecology of the forest. Since Ubon Ratchathani Zoo is part of the Dong Phra Huan National Park with many Yang na plantations and this was the area of Yang na conservation (RSPG - Ubon Ratchathani Zoo, 2015). In addition, the results of important physical data measurements in sample plots, demonstrate that the average light intensity 1,742.85 Lux, average relative humidity 76.19 %, average wind speed 0.42 m/s, average pH 6.49, average soil moisture 4.31%, and average temperature on soil surface 32.50°C (Table 2).
Table 2. The everage of physical data in each sample plots.
|
Plot |
Light Intensity (Lux) |
Relative humidity (%) |
Wind speed (m/s) |
pH of Soil |
Soil moisture (%) |
Surface temperature (°C) |
|
1 |
125.50 |
81.37 |
0.63 |
6.78 |
3.80 |
33.00 |
|
2 |
1,516.33 |
78.69 |
0.63 |
6.78 |
3.80 |
33.00 |
|
3 |
141.30 |
70.65 |
0.43 |
6.17 |
6.00 |
32.83 |
|
4 |
7675.50 |
81.00 |
0.43 |
5.68 |
3.30 |
32.00 |
|
5 |
329.80 |
76.22 |
0.00 |
6.73 |
4.87 |
32.17 |
|
6 |
668.67 |
69.22 |
0.37 |
6.77 |
4.10 |
32.00 |
|
Mean |
1742.85 |
76.19 |
0.42 |
6.49 |
4.31 |
32.50 |
Yang na species in the area of Ubon Ratchathani Zoo
There were 233 Yang na trees in Ubon Ratchathani Zoo. Calculation of the diameter at breast height (DBH) showed range between 4.14 and 106.63 cm. The mean DBH per each tree was 13.02 cm. The height of Yang na ranged from 2.0 to 30.6 m. The mean height was 6.73 m. (Table 3).
Table 3. Overview of the diameter at breast height (DBH) and the height (Ht) of Dipterocarpus alatus Roxb. ex G.Don.
|
Plot |
DBH (cms.) |
Ht (m.) |
||
|
Max – Min |
Mean |
Max – Min |
Mean |
|
|
1 |
4.62 –101.86 |
14.63 |
3.00 – 30.60 |
8.50 |
|
2 |
6.37 – 29.28 |
12.35 |
4.00 – 10.50 |
5.65 |
|
3 |
6.05 – 49.66 |
12.77 |
4.50 – 20.00 |
6.44 |
|
4 |
7.00 –106.63 |
14.36 |
2.00 – 22.00 |
4.85 |
|
5 |
6.37 – 21.33 |
10.74 |
4.00 – 13.70 |
8.41 |
|
6 |
4.14 – 35.65 |
10.77 |
4.00 – 20.00 |
8.23 |
The aboveground biomass and carbon storage in the biomass above of Dipterocarpus alatus Roxb. ex G. Don in Ubon Ratchathani Zoo
The results of the aboveground biomass analysis of Yang na plantations in 6 plots was 59.11 ton/2,400 square meter or 39.40 ton/rai. The trunk showed the highest level at 29.35 ton/rai, followed by branches and leaves, accounting for 6.08 ton/rai and 3.97 ton/rai respectively. The total aboveground biomass was estimated as the total number of trees. Our findings suggest the highest level at 0.19 ton/tree or 73.08%, followed by branches and leaves of 0.04 ton/tree or 15.38% and 0.03 ton/tree or 11.54%, respectively (Table 4 and Figure 6).
In addition, we found that the amount of carbon sequestration in the aboveground biomass was 29.29 ton/2,400 square meter or 19.53 ton/rai. It varied according to the biomass of the different parts (trunk: 14.65 ton/rai, branches 2.96 ton/rai and leaves 1.92 ton/rai). The analysis of amount of carbon storage in the aboveground biomass per each tree revelaled that Yang na had 0.12 ton/tree by storage at the trunk, branches and leaves, accounting for 0.09, 0.02 and 0.01 ton/tree, respectively. The percentage of average carbon stortage per tree was 75.00, 16.67 and 8.33. In addition, when estimating the amount of carbon sequestration in the biomass above the soil of Yang na on the total area of Ubon Ratchathani Zoo, about 120 rai, indicated the amount of carbon sequestration in the aboveground biomass of approximately 2,343.60 tons (Table 4 and Figure 6).
The relationship between aboveground biomass of Yang na and the circumference was analyzed using Peason’s correlation coefficient which was 0.931. We suggest that the aboveground biomass and the circumference of Yang na was significantly related at the 0.01 level. The correlation of the aboveground biomass of Yang na with the same height of Yang na was 0.629. This suggests that the aboveground biomass and the height of Yang na was significantly correlated at the 0.01 level. The correlation of the amount of carbon to the circumference and the height were 0.931 and 0.629 meaning that the amount of carbon storage and the circumference of Yang na were significantly higher at the level of 0.01 and the amount of carbon sequestration and the height of Yang na were significantly correlated at the 0.01 level (Table 5).
Table 4. Aboveground Biomass of Dipterocarpus alatus Roxb. ex G.Don.
|
Plot |
Number of trees |
Aboveground biomass (Aboveground carbon storage) Uunit : tons |
|||
|
Trunk |
Branch |
Leaf |
Total |
||
|
1 |
48 |
21.73 (10.84) |
4.56 (2.22) |
2.78 (1.34) |
29.07 (14.40) |
|
2 |
47 |
2.49 (1.24) |
0.49 (0.24) |
0.42 (0.20) |
3.40 (1.68) |
|
3 |
50 |
4.21 (2.10) |
0.85 (0.41) |
0.64 (0.31) |
5.70 (2.82) |
|
4 |
46 |
12.66 (6.32) |
2.63 (1.28) |
1.69 (0.82) |
16.98 (8.42) |
|
5 |
20 |
1.16 (0.58) |
0.23 (0.11) |
0.18 (0.09) |
1.57 (0.78) |
|
6 |
22 |
1.77 (0.89) |
0.36 (0.18) |
0.25 (0.12) |
2.39 (1.19) |
|
Total |
233 |
44.02 (21.97) |
9.12 (4.44) |
5.96 (2.88) |
59.11 (29.29) |
|
Average/rai |
29.35 (14.65) |
6.08 (2.96) |
3.97 (1.92) |
39.40 (19.53) |
|
|
Total average Unit : tons/ tree |
0.19 (0.09) |
0.04 (0.02) |
0.03 (0.01) |
0.26 (0.12) |
|
|
Total carbon storage in the biomass above the ground (Area 120 rai) : tons |
19.53 x 120 = 2,343.60 |
||||
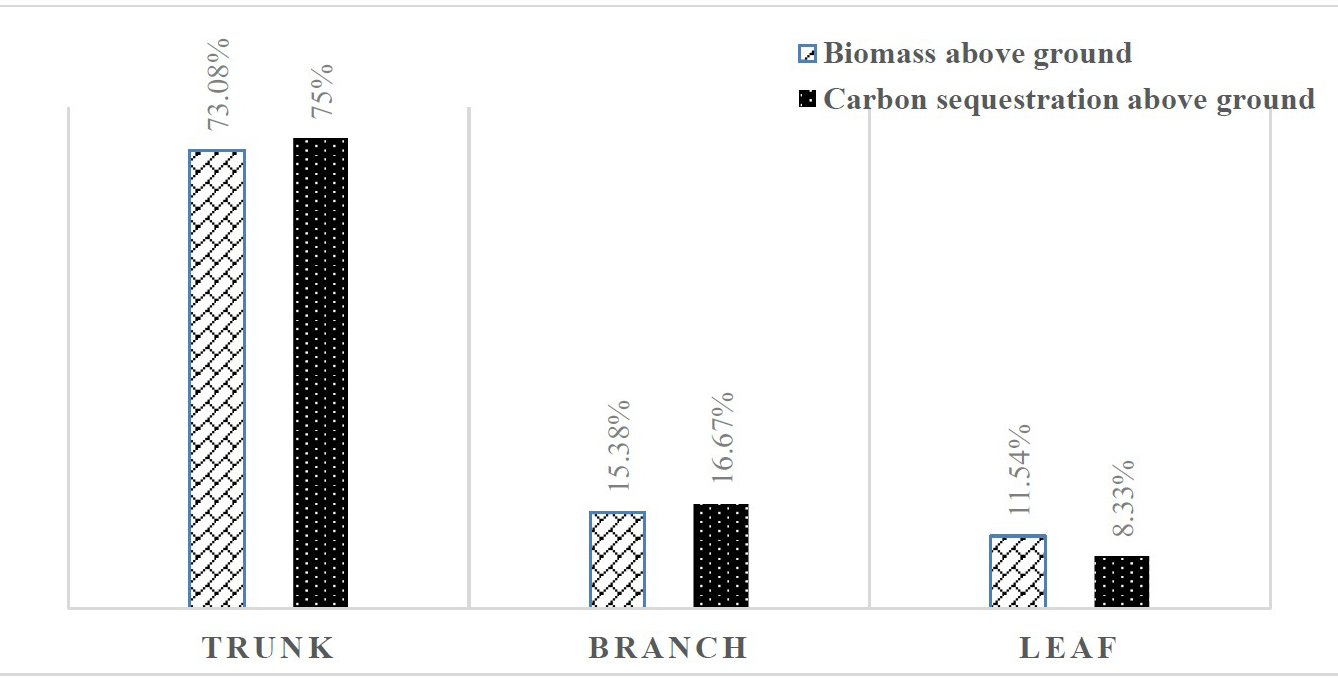
Figure 6. The percentage of biomass above ground average and carbon sequestration above ground average in each Yang na tree.
Table 5. The correlation coefficient between the biomass and the carbon storage quantity with the circumference and height of Yang na.
|
|
Aboveground biomass |
Aboveground carbon Storage |
|
|
Circumference |
Pearson Correlation |
.931** |
.931** |
|
Sig. (2-tailed) |
.000 |
.000 |
|
|
N |
233 |
233 |
|
|
Height |
Pearson Correlation |
.629** |
.629** |
|
Sig. (2-tailed) |
.000 |
.000 |
|
|
N |
233 |
233 |
|
Note: ** Correlation is significant at the 0.01 level (2-tailed).
Canopy effect of Yang na on different factors of Yang na in Ubon Ratchathani Zoo
Analysis of canopy influence on other factors, including number of trees in the plot, number of species, wood volume, circumference and height was conducted to investigate the relationship of canopy coverage using 50 trees in 6 plots and only the percentage that was covered with leaves and branches under that tree was calculated. Our results show that the average of the circumference was 0.47 m and the average of height was 8.35 m. The average volume of wood was 0.5219 cubic meter/ton. Total volume of wood accounted for 50 tons, equivalent to 26.0946 m3. The percentage of canopy cover of Yang na was 87.20%. The analysis of canopy effect of Yang Na on different factors using Pearson’s correlation aims to investigate the correlation of canopy effect with different factors in order to the dominance species. The influence of the canopy of Yang na to circumference, height and volume of the wood were also analyzed, accounting for -0.277, -0.343, and -0.213, respectively. These results indicate that the relationship was reversed in the low to moderate level. The analysis of the percentage of canopy cover and the number of Yang na found in the sample plots showed the correlation coefficient of 0.797. This indicates that the relationship was high in the same direction. The relationship of percentages of canopy cover of Yang na was analyzed with the number of trees and the number of tree species in the plots revealing the correlation coefficients of -0.667 and
-0.603, respectively. This indicates moderate opposite direction correlation (Tables 6 to 7).
Table 6. Comparison of percentage of canopy cover with other factors in each plot.
|
Plot |
Number of Yang na in the plot (tree) |
Number of other trees in the plot (tree) |
Number of tree species found in the plot. |
The average percentage of canopy cover |
|
|||||
|
|
1 |
48 |
23 |
12 |
89.38 |
|||||
|
|
2 |
47 |
24 |
9 |
90.50 |
|||||
|
|
3 |
50 |
22 |
9 |
87.44 |
|||||
|
|
4 |
46 |
12 |
9 |
87.70 |
|||||
|
|
5 |
20 |
40 |
15 |
80.86 |
|||||
|
|
6 |
22 |
38 |
17 |
86.38 |
|||||
Table 7. Correlation analysis between canopy percentages of Yang na with height, volume of wood, number of Yang na, number of other trees and number of tree species.
|
|
|
% Influences of Canopy |
|
|
Circumference (m) |
Pearson Correlation |
-.227* |
|
|
Sig. (2-tailed) |
.051 |
||
|
N |
50 |
||
|
Height (m) |
Pearson Correlation |
-.343* |
|
|
Sig. (2-tailed) |
.015 |
||
|
N |
50 |
||
|
Volume of wood (m3) |
Pearson Correlation |
-.213* |
|
|
Sig. (2-tailed) |
.137 |
||
|
N |
50 |
||
|
Number of Yang na trees |
Pearson Correlation |
.797** |
|
|
Sig. (2-tailed) |
.058 |
||
|
N |
6 |
||
|
Number of other trees |
Pearson Correlation |
-.667** |
|
|
Sig. (2-tailed) |
.148 |
||
|
N |
6 |
||
|
Number of type of trees |
Pearson Correlation |
-.603** |
|
|
Sig. (2-tailed) |
.205 |
||
|
N |
6 |
||
Note: * Correlation is significant at the 0.01 level (2-tailed). **Correlation is significant at the 0.05 level (2-tailed).
DISCUSSION AND CONCLUSION
Yang na was a dominant tree in the dry evergreen forest of Ubon Ratchathani Zoo. There were 233 in 2,400 square meters of area. It was found that the diameter at breast height ranged between 4.14 and 106.63 cm. The total average was 13.02 cms, while the height of Yang na tree ranged in between 2.0 – 30.6 maters which the mean of height equal to 6.73 maters. In regards with literature review, there was yet previous repport related to Yang na species in dry evergreen forest or other forest so it may not be possible to compare the density of Yang na in the forest type. There was only a study of Leelawattanakul (2000) that investigated the distribution of large trees in diameter at breast height. They indicated that Yang na showed a large number in the minimum breast height at 4.5 - 14.5 cm. and then gradually decreased to the number of similar trees in the diameter of breast height from 34.5 to 84.5 cm. The distribution of large trees in the height layer, our findings show that Yang na wood was distributed in almost all height layers. The height ranged between 6 and 8 meters. This was consistent with the findings in the previous study showing that Yang na was the large tree with diameter higher than 4.5 cm. Yang na has large number in a diameter of breast height at the level 4.14 – 17.8 cm. and then gradually decreased to the number of similar trees in the diameter levels at the breast from 20.37 – 79.38 cm.
We have studied plant community structure and our results showed that Yang na showed the highest relative frequency relative density relative dominance and importance value index, followed by Ma kok kluean and Ma pok that is consistent with the study of plant community structure conductec in Ubon Ratchathani (Jumpasing et al., 2018) of which it showed that Dipterocarpaceae in dry evergreen forest and declduous dipterocarp forest demonstrated the highest Family Importance Index. In addition, the study of plant species diversity that is economically beneficial to the use of forests in the education action center for rural development, Buriram Rajabhat University by Suntararak (2017) demonstrated that Dipterocarpaceae has the most diverse species and plant with the highest relative frequency relative density relative dominance and importance value index was Yang na of which the findings are consistent with the previos studies. However, when the forest is invaded, the plant community structure may be altered accordingly.
The study of biological mass above ground of 233 Yang na trees in the area of 2,400 square meters showed the total biomass of the Yang na that was 59.11 trees or 39.40 ton/rai. When compared to other mixed deciduous forest, the amount of biomass was greater. Khampanat Dee-Udomjan (Deeudomchan et al., 2011) previously studied the biomass of natural dipterocarp forests, dipterocarp forest and mixed deciduous forest demonstrating biomass of 11.56, 15.63 and 15.94 ton/rai, respectively. Khan Jamnongpakdee (Chamnongpakdee and Udomsiriphong, 2015) investigated the dipterocarp forest in Mae Ping National Park and found the biomass of 16.63 ton/rai. The amount of carbon storage above the ground of 233 Yang na trees was 29.29 tons or 19.53 ton/rai. When compared to other mixed deciduous forest, the carbon content was significantly higher. In addition, they found that carbon sequestration on the natural dipterocarp forest, pine-dipterocarp forest, oak-deciduous dipterocarp forest in Mae Chaem Basin and dipterocarp forest in Mae Ping National Park was 5.78, 7.81, 7.97 and 7.82 tons/rai, respectively. (Chamnongpakdee and Udomsiriphong, 2015) In addition, Within the data, it can be seen that the amount of biomass and the amount of carbon storage in Yang na trees of dry dipterocarp forest in Ubon Ratchathani Province showed more than other areas as mentioned above. Because of a non-invasive forest, no changed to agricultural area then this makes the area highly fertile. The relationship of soil biomass of Yang na with circumference showed strongly relation. The relationship between soil biomass and root height was found to be high relation. The relationship of carbon storage quantity with circumference and height found that the relationship was very high and high respectively. It shows that the circumference and the height were very high, so the biomass above the ground and the amount of carbon storage will be high.
The study on the influence of Yang na, volume of wood and other factors found the total volume of 50 trees equal to 26.0946 cubic meter. The percentage of canopy cover of Yang na equal to 87.20%. The percentage of canopy cover can affect the canopy gap that influence to the difference environmental factors as light, temperature and moisture content. These factors affect the natural reproduction of the lace (DNP, 2010). The study of relationship of percentage of the cover with circumference, height and volume of wood was reversed in the low to moderate level. This can be concluding that when the percentage of canopy cover of Yang na plantations was high, the circumference, height and volume of wood were less. The percentage of canopy cover and the number of Yang na in sample plots showed the relationship was high in the same direction.The relationship of percentage of canopy cover of Yang na with the number of other trees and the number of tree species in sample plots showed reversed at the moderate level relationship. It was showed that the percentage of canopy cover of Yang na increased, the number of Yang na in the plots will increase but the number of other trees were less and the variety of trees were decreasing. To compared to the study of Chalida Sriladda (Sriladda, 2006) who study on the influence of canopy structure on natural growth and reproduction in Pak Phanang mangrove forest. She found that the structure of the canopy structure affects density, mortality rate of mangroves and increasing the height of each tree but it does not affect the number of species and the increase of young tree diameters and seedlings. For other relevant studies; they measure the canopy cover of the whole plot. So couldn’t compare the results that showed some different factors.
ACKNOWLEDGEMENTS
This research was supported by the Khon Kaen University funding and Plant Genetic Conservation Project under The Royal Initiative of H.R.H. Princess Maha Chakri Sirindhorn (RSPG) the Bureau of The Royal Household. We would like to also thank to the field staff of the project to coordinate the area officers. We thank administrators and Ubon Ratchathani Zoo staff for providing care during the study and thank RSPG Office, Khon Kaen University, College of Medicine and Public Health, Ubon Ratchathani University for facility support.
REFERENCES
Assmann, E. 1970. The principles of forest yield study. Oxford: Pergamon Press. p. 120.
Boonpragob, K. 1996. Land use change and forestry. Draft Final Report: Thailand’s National Greenhouse Gas Inventory 1990. Office of Environmental Policy and Planning.
Brown, S. 1996. Mitigation potential of carbon dioxide emission by management of forests in Asia. AMBIO. 25(4): 273 - 278.
Chamnongpakdee, G., and Udomsiriphong, N. 2015. Value of carbon stock in aboveground biomass of diciduous dipterocarp forest, Maeping National Park at Chiang Mai, Lamphun and Tak province. The 5th Thai Forest Ecological Research Network, T-FERN. 2015, December 16-17; Faculty of Forestry, Kasetsart University, Bangkok, Thailand.
Deeudomchan, K., Puangchit, L., Silapathong, C., Prakobya, A., and Yootthapoom, P. 2011. Evaluation of carbon storage in forest using Geo-Informatics Technology a cast study of the lower Mae Cheam Sub-watershed area. The 2nd National Carbon Neutral Conference on Climate Change and Green Economy: Pathway to Response. 2011, August 18-19; IMPACT Convention Center, Muang Thong Thani, Nonthaburi, Thailand.
Department of National Parks, Wildlife and Plant Conservation (DNP). 2010. An ecological studies of dipterocarp forest in the genetic conservation area of the dipterocarp forest for restoration. [accessed 10th May 2017] http://portal.dnp.go.th/DNP/FileSystem/download?uuid=05de5bc7-ae66-4802-8682-a966aced23fa.pdf
Husch, B., Miller, C.I., and Beers, T.W. 1982. Forest mensuration. 3rd ed. John New York: Wiley & Sons.
IPCC. 2006. IPCC guidelines for national greenhouse gas inventories. Volume 4 chapter 4. The Institute for Global Environmental Strategies (IGES, Hayama, Japan. 83 p.
Jumpasing, J., Putthai, T., and Pattanakiat S. 2018. Plants community structure and diversity of flora in forest monastery, Ubon Ratchathani Province. Thai Forest Ecological Research. 2(1): 26-36.
Leelawattanagul, P. 2000. Species diversity of the dry Evergreen forest at huai talooh watershed management unit, Muang, Petchaboon. Thai Forestry Research. 2(1): 48-55.
Negi, J.D.S., Manhas, R.K., and Chauhan, P.S. 2003. Carbon allocation in different components of some tree species of India: a new approach for carbon estimation. Current Science. 85(11): 1528-1531.
Office of Environmental Policy and Planning; OEPP. 2000. Thailand’s national greenhouse gas inventory 1994. Bangkok: Ministry of Science, Technology and Environment.
Ogawa, H., Yoda K., and Kira T. 1965. Comparative ecological study on three main types of forest vegetation in Thailand in structure and floristic composition: nature and life in South – East Asia. Fauna and Flora Research Society. Kyoto, Japan. Vol. 4.
Openshaw, K. 1997. Global warming and the role of trees: Thailand a case study. In: Khemnark, C., Thaiutsa, B., Puangchit, L. and Thammincha, editors. Tropical Forestry in the 21st Century Volume 2: Global Changed in the Tropical Contexts. FORTROP’96 International Conference, Bangkok.
Plant genetic conservation project under the royal initiative of her Royal Highness Princess Maha Chakri Sirindhorn (RSPG) , Ubon Ratchathani Zoo. 2015. Ubon Ratchathani Zoo Plant Guide. Winner Offset Press, Ubon Ratchathani. p. 240
Ruangpanit, N. 2003. The Ecology of Natural Resources. Volume 3. Kasetsat University, Bangkok. p. 342
Sriladda, C. 2006. Influences of canopy structure on natural regeneration in mangrove plantations at Pak Phanang, Nakhon Si Thammarat province. Proceedings of 44th Kasetsart University Annual Conference: Engineering, Architecture, Natural Resources and Environmental Management. 2006, January 30 - February 2; Bangkok: Kasetsart University.
Suntararak, S. 2017. Species diversity of tree and economic – value with its utilization on natural forest area at the education action center for rural development Buriram Rajabhat University, Nongkwang Campus, Phonsamran sub-district, Khumuang district, Buriram province. In: Proceeding of the 8th RSPG Researchers Club Conference “Thai Resources: Enormous Potential to be Seen”, 29th November – 1st December 2016, Chulalongkorn University. Saraburi.
Tangtham, N., and Tantasirin, C. 1997. An sessment of policies to reduce carbon emissions in the Thai forestry sector with emphasis on forest protection and reforestation for conservation. In: Khemnark, C., Thaiutsa, B., Puangchit, L. and Thammincha, S., editors. Tropical Forestry in the 21st Century Volume 2: Global Changes in the Tropical Contexts. FORTROP’96 International Conference, Bangkok, Thailand.
The Institute for the Promotion of Teaching Science and Technology (IPST). 2016. Canopy cover and ground. [accessed 12th June 2016] http://globethailand.ipst.ac.th/?page_id=4024
Tsutsumi, T., Yoda, K., Sahunalu, P., Dhanmanonda, P., and Prachaiyo, B. 1983. Forest: felling, burning and regeneration in shifting cultivation. In: Kyuma, K. and Pairintra, C.editors. An experiment at Nam Phrom, Thailand and its implications for upland farming in the monsoon Tropics. Kyoto: Kyoto University. p.13-62.
Visaratana, T., and Chernkhuntod, C. 2004. Floristic composition and aboveground trees biomass in dry evergreen forest. National Conference on forestry and climate change: forests and climate change. 2004, August 16-17; Maruay Garden Hotel, Bangkok, Thailand. Department of National Parks, Wildlife and Plant Conservation. 31 p.
Woodland Campus Park, Kasetsat University Chalermprakiat Sakon Nakhon Province Campus. 2014. Yangna. [accessed 22nd August 2016] http://office.csc.ku.ac.th/woodland/ index.php/2013-11-18-06-36-8/134-2014-02-17-07-32-25
World Resources Institute. 2006. World Resources 1988 – 1989. New York: Basic Book.
Penprapa Phetcharaburanin1*, Nittaya Chakhamrun2 and Pimpisa Kulninworpaeng3
1Environmental Science Department, Faculty of Science, Khon Kaen University, Khon Kaen 40002, Thailand
2College of Medicine and Public Health, Ubon Ratchathani University, Ubon Ratchathani 34190, Thailand
3Coordination Center of the Royal Initiative Projects, Khon Kaen University, Khon Kaen 40002, Thailand
*Corresponding author. E-mail: penprapa@kku.ac.th
Total Article Views
Article history:
Received: November 1, 2018
Revised: June 21, 2019
Accepted: August 23, 2019