 ISSN: 2822-0838 Online

High Glycemic Index Diet Decreases Insulin Secretion without Altering Akt and Pdx1 Expression on Pancreatic Beta Cells in Mice
Lilik Herawati, Gadis Meinar Sari, and Roedi Irawan*Published Date : 2020-05-12
DOI : https://doi.org/10.12982/CMUJNS.2020.0024
Journal Issues : Number 3, July-September 2020
ABSTRACT This study aims to determine the effect of high glycemicindex (GI) diet on blood glucose, serum insulin, number of islet cells, Akt, and Pdx1 expression in beta cells. Eight weeks-old healthy male Balb/c mice were divided into two groups. The control group was given standard diet. The high glycemic index (highGI) group was given standard diet added with oral gavage of glucose solution everyday for 4 weeks. The dose of glucose solution was 0.013 g/gBW or 3-5% additional calories each day. Random blood glucose (BG) was taken before (pre) and after (post) treatment from tail vein. Serum insulin (SI) was taken after treatment from blood cardiac. Islet was removed after treatment. The number of islet cells was counted in HE staining. Akt and Pdx1 were analyzed in IHC staining. The results revealed that the changes of body weight before and after treatment were significantly different between groups (P=0.025). BG post in the highGI increased significantly compared to that in the control (P= 0.032). However, SI in the highGI decreased significantly compared to that in the control (P=0.003). The number of islet cells in the highGI decreased insignificantly (P=0.346). Meanwhile, Akt and Pdx1 in the highGI increased slightly (P=0.729; P=0.701). It can be concluded that a high GI diet can increase blood glucose level but reduce serum insulin level. However, there is no evidence of underlying mechanism of this chronic condition via Akt and Pdx1. Thus, further research is needed, especially for observing apoptosis and other modulators on beta cells.
Keywords: Glycemic index, Glucose, Insulin, Akt, Pdx1, Beta cells
INTRODUCTION
The prevalence of diabetes mellitus (DM) is increasing. It is estimated that in 2040, the number of patients with DM will be more than 642 million (Zheng et al., 2018). Hyperglicemia or high abnormal level of blood glucose is one of the signs of DM. International Diabetes Federation (2014) released the risk factors of DM, which include family history, overweight and obesity, disproportionate diet, sedentary lifestyle, and aging. Several studies have been conducted to observe the lifestyle (e.g. sedentary lifestyle and diet) of DM patients and glucose metabolism related disorders, such as insulin resistance (Pathak, 2012; Chong et al., 2017; Pathak and Putri et al., 2018).
Glucose is a type of monosaccharide that has the highest glycemic index (GI) value. The GI is 100 (The President and Fellows of Harvard College, 2017). Food with high GI is absorbed faster, which leads to an increase of blood glucose. It has been known that high carbohydrate, especially with high GI diet, can trigger type 2 diabetes or glucose metabolism related disorders (Adeyi et al., 2012; Hasegawa-Tanaka and Machida, 2016).
Glucose is one of several factors which can stimulate several transcription factors in beta cells, like Akt (protein kinase B or serine/threonine-specific protein kinase) and Pdx-1 (pancreatic duodenal homeobox-1). Akt is an important component for pro-survival and anti-apoptotic agent, which can inhibit caspase-9 (Khwaja, 1999). Research by Puddu et al. (2013) showed that Akt can increase the mass of islets. It has also been identified that Akt impedes GSK-3 (glycogen synthase kinase-3). GSK-3 has a role in Pdx1 degradation (Humphrey et al., 2010). Pdx1 is one of the transcription factors identified in the pancreas since embryonal phase, and it is still expressed in adult phase. Pdx1 has been identified to have a pivotal role in beta cell growth and adult beta-cell function (Spaeth et al., 2017). Therefore, Akt can stimulate Pdx1 through its inhibition effect on GSK-3 (Johnson et al., 2006; Murtaugh, 2007; Humphrey et al., 2010;). However, the implication mechanism of Akt and Pdx1 in the chronic high GI diet exposure is not clearly understood. Hence, the objective of this study is to determine the patterns of glucose and serum insulin levels, as well as the role of Akt and Pdx1 in beta cells because of chronic exposure to high GI diet.
MATERIAL AND METHODS
Approval for this research has been obtained from Animal Care and Use Committee, Faculty of Veterinary, Universitas Airlangga (No. 561-KE).
Animals
Eight week-old healthy male Balb/c mice were used in this study. The animal subjects were obtained from Faculty of Veterinary, Universitas Airlangga. The mice were divided into two groups: control group and high glycemic index diet group (highGI). Each group consisted of seven mice. The control group was given standard diet. Meanwhile, the highGI group was given standard diet added with daily oral gavage of glucose solution 0.013 g/g of body weight or 3-5% additional calories each day. Basu et al. (2013) said that 150 kcal/person/day of sugar or about 7.5% each day was associated with increased diabetes prevalence. However, based on previous research, the addition of calories more than 7.4% each day in mice gave only 16.7-36.4% on survival rate (Herawati et al., 2016). Therefore, we decided to give a lower dose of additional calories. The duration of the treatment was 4 weeks.
At the end of the treatment, the mice were sacrificed by intraperitoneal anesthesia. The anesthesia cocktail was made up of 1 ml ketamine (100 mg/ml), 0.5 ml xylazine (20 mg/ml), 0.3 ml acepromazine (10 mg/ml), and 8.2 ml of sterile water. The intraperitoneal anesthesia dose was 0.05-0.1 ml/10g body weight.
Intracardiac blood was taken to analyze the serum insulin level and the pancreas was removed. Then, histologic preparations were set by hematoxylin-eosin (HE) staining on pancreatic organs to calculate the number of islet cells and immunohistochemical (IHC) staining for Akt and Pdx1.
Blood glucose
Random blood glucose (BG) samples in mg/dL were blood drops from the tail taken before and after the treatment. It was measured by an Accucheck Performa glucometer.
Insulin serum
The blood from intracardiac was centrifuged and the serum was taken for further examination for serum insulin levels in IU/L by Elisa (BT laboratory).
Islet cells
The number of islet cells was analyzed using Image-J software with HE staining. The average number of islet cells was from 5 fields of view.
Akt and Pdx1 expression
IHC slides were used to interpret the expression of Akt and Pdx1. The Akt and Pdx1 expression measurements were performed by counting the average number of beta cells in 5 fields of view, which gave a positive reaction to Akt antibody monoclonal (Anti-AKT1/2/3 antibody, EPR16798, ab179463, Abcam) and Pdx1 monoclonal antibody (B-11, sc. 390792, Santa Cruz Biotechnology) with 1000x enlargement using a light microscope (Nikon eclipse E100) equipped with DS Fi2 300 megapixel digital camera.
The Akt and Pdx1 expression in each sample were assessed semiquantitatively according to the modified Remmele method (Nowak et al., 2007), in which the Remmele’s Immuno Reactive Score (IRS) Index was obtained from multiplication of positive immune-reactive cell percentage scores with a color intensity score at immune reactive cells (Table 1).
Table 1. Semiquantitatively scale of Remmele’s Immuno Reactive Score.
|
A (positive immunoreactive cells) |
B (color intensity score of immunoreactive cells) |
|
Score 0 : 0% |
Score 0 : no color reaction |
|
Score 1 : <10% |
Score 1 : color intensity low |
|
Score 2 : 11% - 50% |
Score 2 : color intensity moderate |
|
Score 3 : 51% - 80% |
Score 3 : color intensity high |
|
Score 4 : >80% |
|
Note: Multiply positive immunoreactive cell percentage scores (A) with color intensity score at immunereactive cells (B). IRS=AxB.
Statistic analysis
Normality test was performed to evaluate data distribution. The independent-T test was used when it was normally distributed. The wilcoxon-mann whitney test was applied when it was not normally distributed.
RESULTS
The data of variables measured in this study can be seen in Table 2. The body weight before treatment (BW_pre) and blood glucose levels before treatment (BG_pre) showed insignificant differences. It told us that at the beginning of the treatment, the animals were in a relatively homogeneous state.
Table 2. Mean of the variables.
|
|
Groups |
|
|
|
Control |
highGI |
|
BW_pre (gram) |
21.03 ± 0.89 |
18.67 ± 3.64 |
|
BW_post (gram) |
21.79 ± 3.62 |
23.30 ± 3.75 |
|
BWpre_post (gram) |
0.76 ± 3.98 |
4.60 ± 2.00* |
|
BG_pre (mg/dL) |
112.57 ± 16.30 |
100.00 ± 20.03 |
|
BG_post (mg/dL) |
98.57 ± 21.87 |
119.00 ± 14.88* |
|
Δ BGpre_post (mg/dL) |
-14.00 ± 26.06 |
19.00 ± 31.01* |
|
SI (IU/L) |
4.13 ± 0.90 |
2.76 ± 0.18* |
|
Islet cells (å) |
51.16 ± 13.75 |
44.37 ± 12.10 |
|
Akt (score) |
5.71 ± 2.56 |
6.17 ± 2.25 |
|
Pdx1 (score) |
4.56 ± 2.68 |
5.20 ± 2.10 |
Note: Data are expressed as mean ± SD. (n=7 in each group). Statistical analyses were done using the independent T test (n= 7 in each group). *significantly different (P<0.05) from the control groups.
Effects of high GI on body weight
Body weight before and after treatment were not significantly different (Table 2; Figure 1a). Nevertheless, the highGI group gained more weight compared to the control group (P=0.025) (Table 2; Figure 1b).
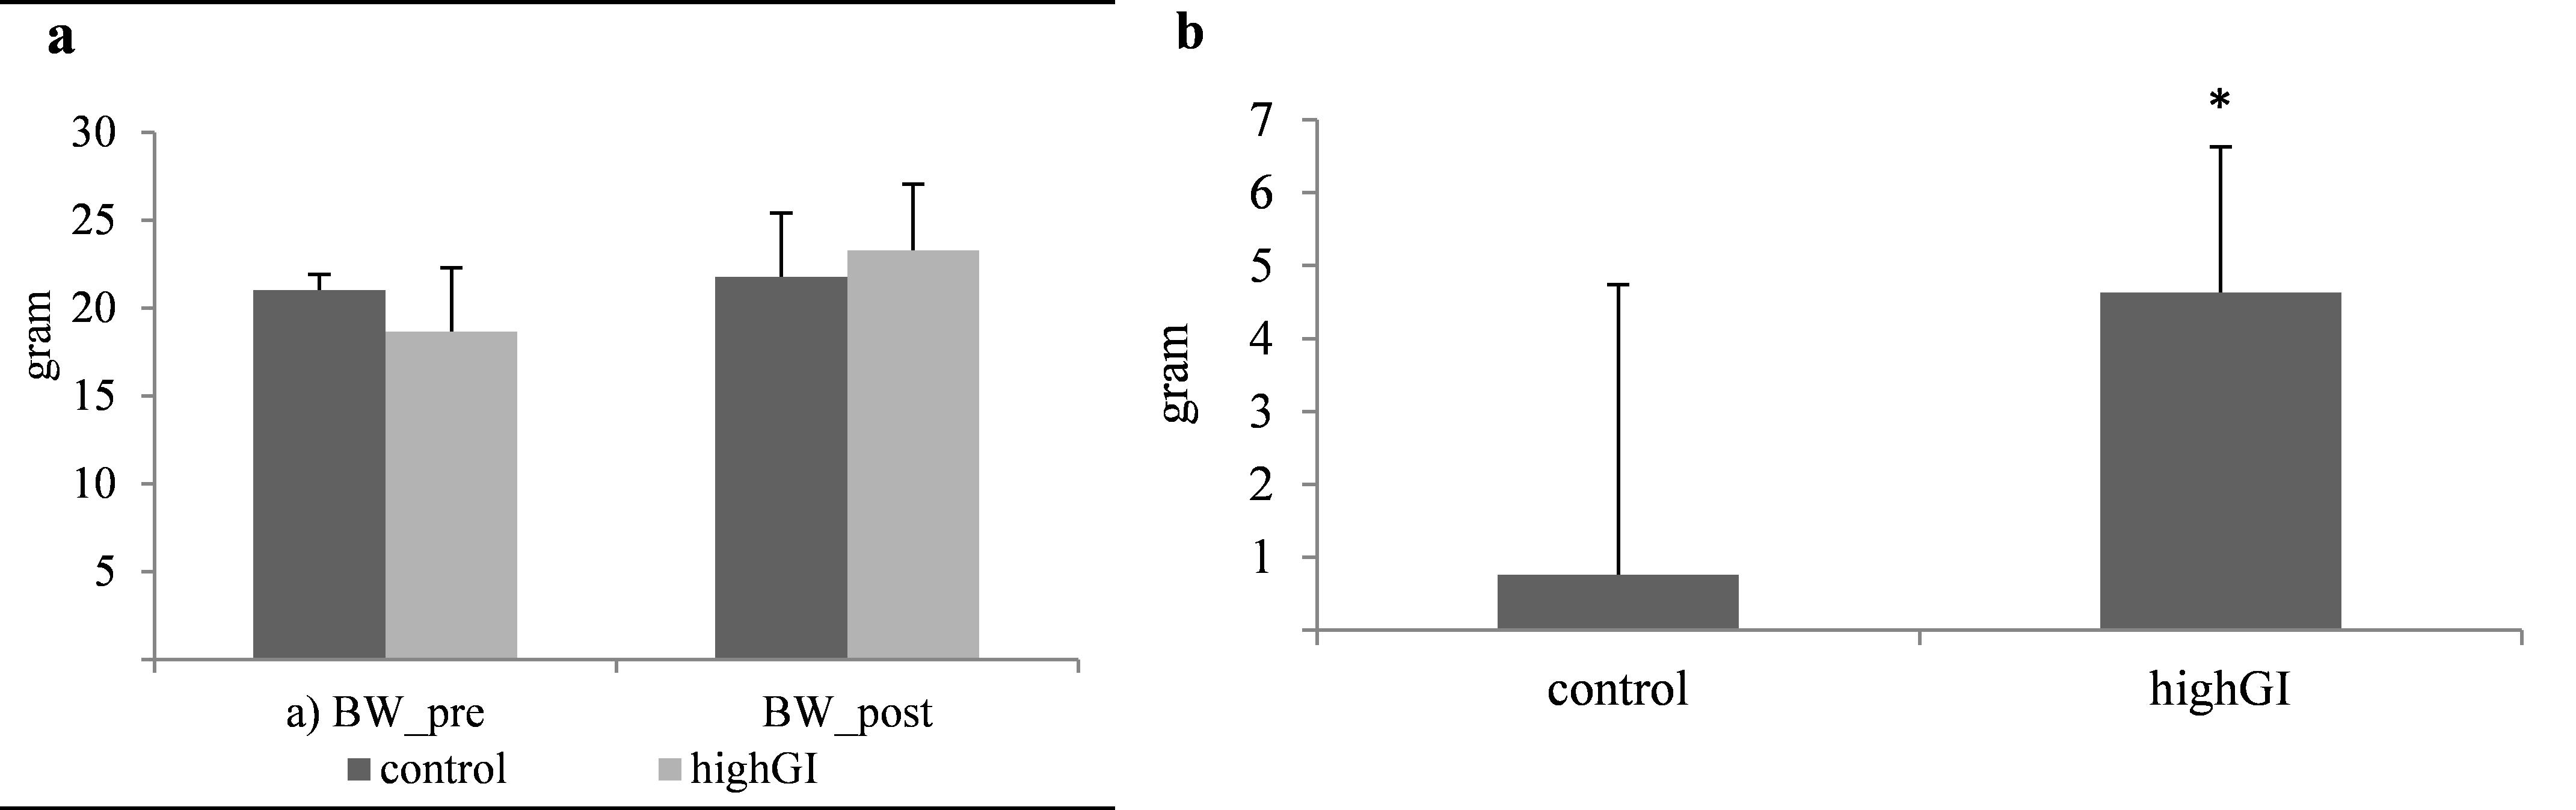
Figure 1. (a) Body weight (gram) before and after treatment.; (b) Body weight changes (gram) during treatment. Statistical analyses were done using the independent T test (n= 7 in each group). *significantly different (P< 0.05) from the control groups.
Effects of high GI on blood glucose and serum insulin
After 4 weeks of treatment, the random blood glucose (BG post) of the high GI group increased significantly (P=0.032) (Table 2; Figure 2a). The difference of blood glucose level of the highGI group was also significantly higher (P=0.026) (Table 2; Figure 3). Meanwhile, the serum insulin levels in the highGI group experienced a significant decrease compared to the control group (P=0.003) (Table 2; Figure 2b). It is interesting that it was not in line with the insulin levels secreted by higher blood glucose levels in the highGI group.
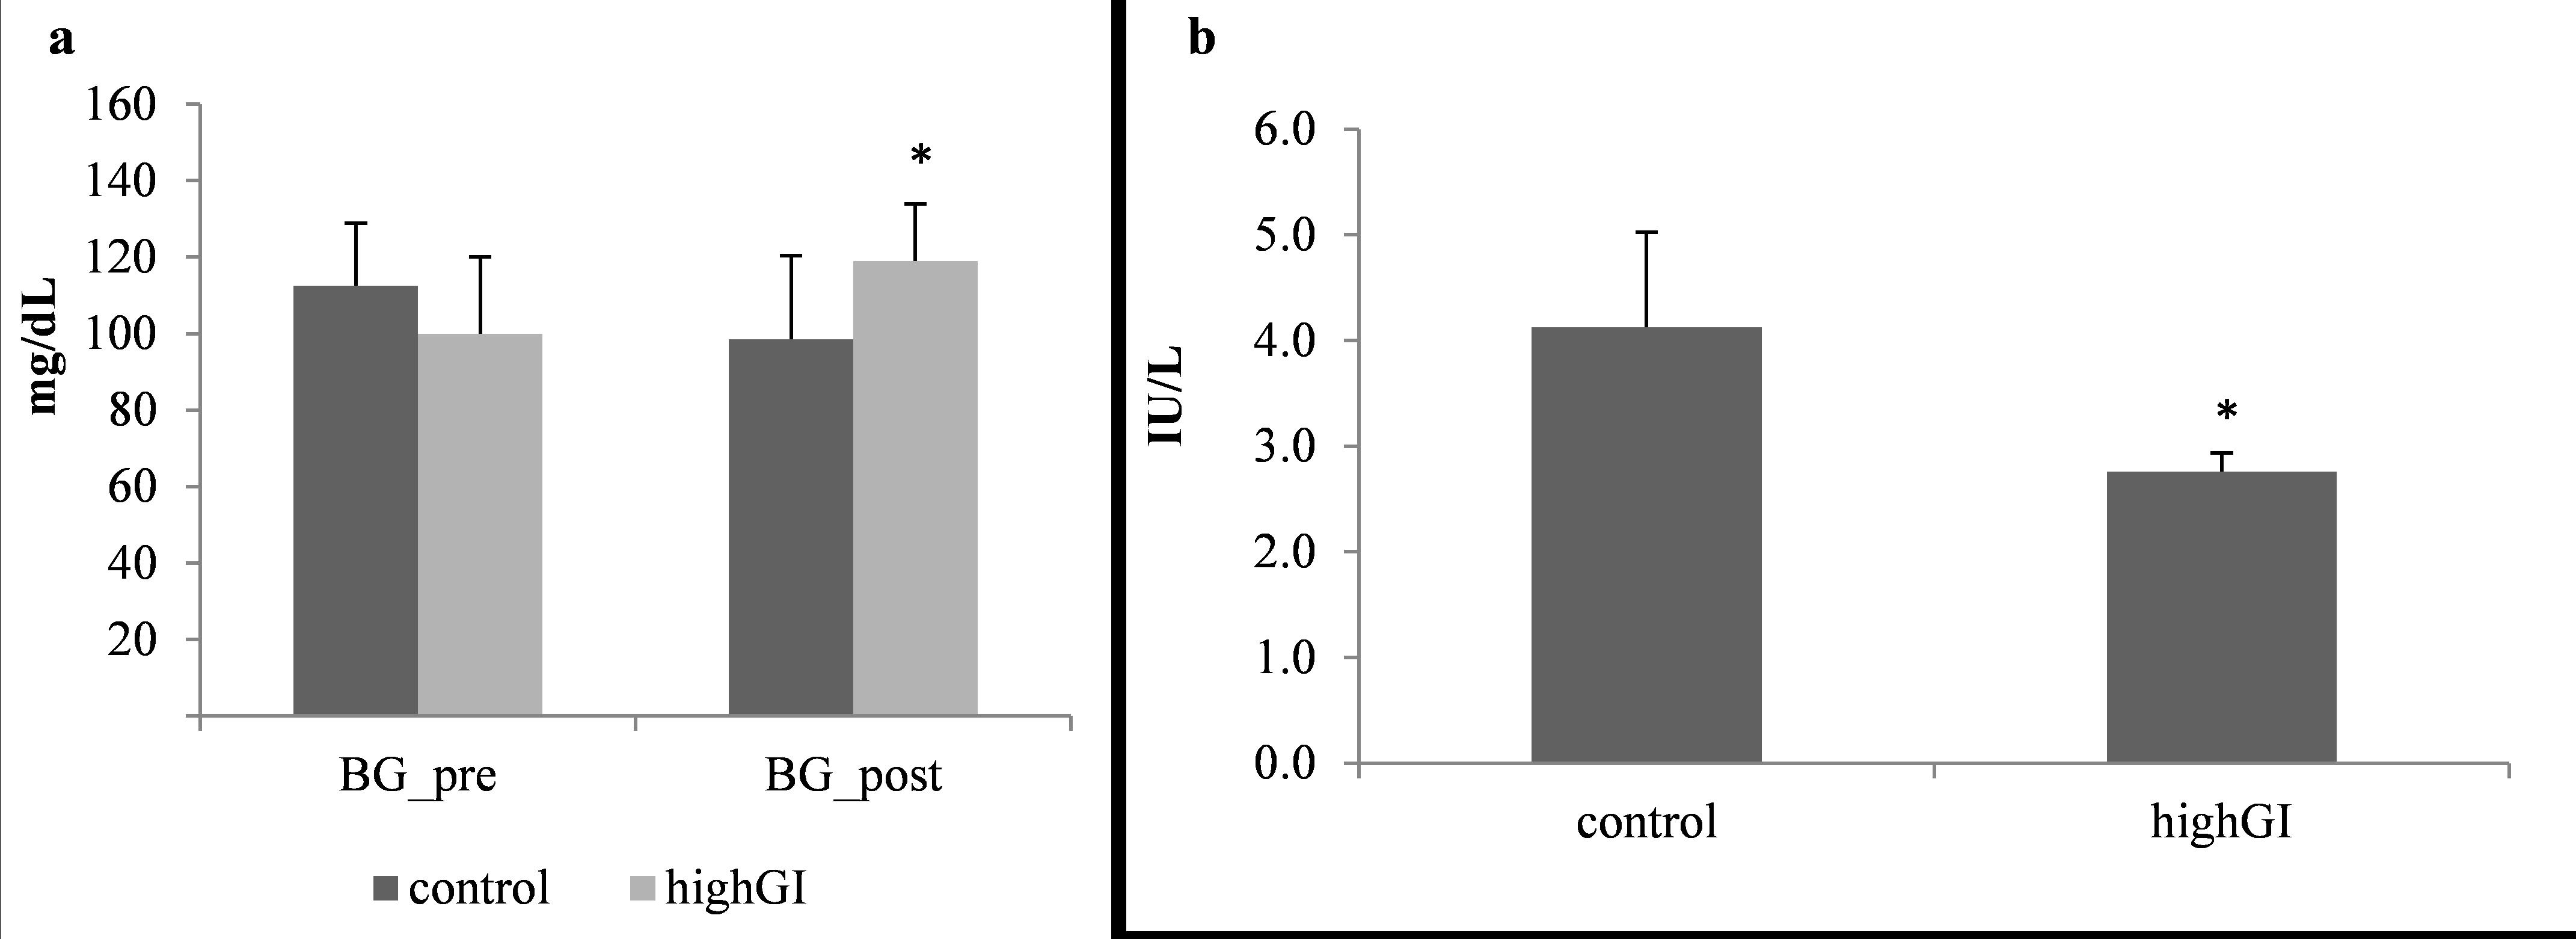
Figure 2. (a) Random blood glucose level (mg/dL) before and after treatment.; (b) Serum insulin level (IU/L) after treatment. Statistical analyses were done using the independent T test (n= 7 in each group). *significantly different (P< 0.05) from the control groups.
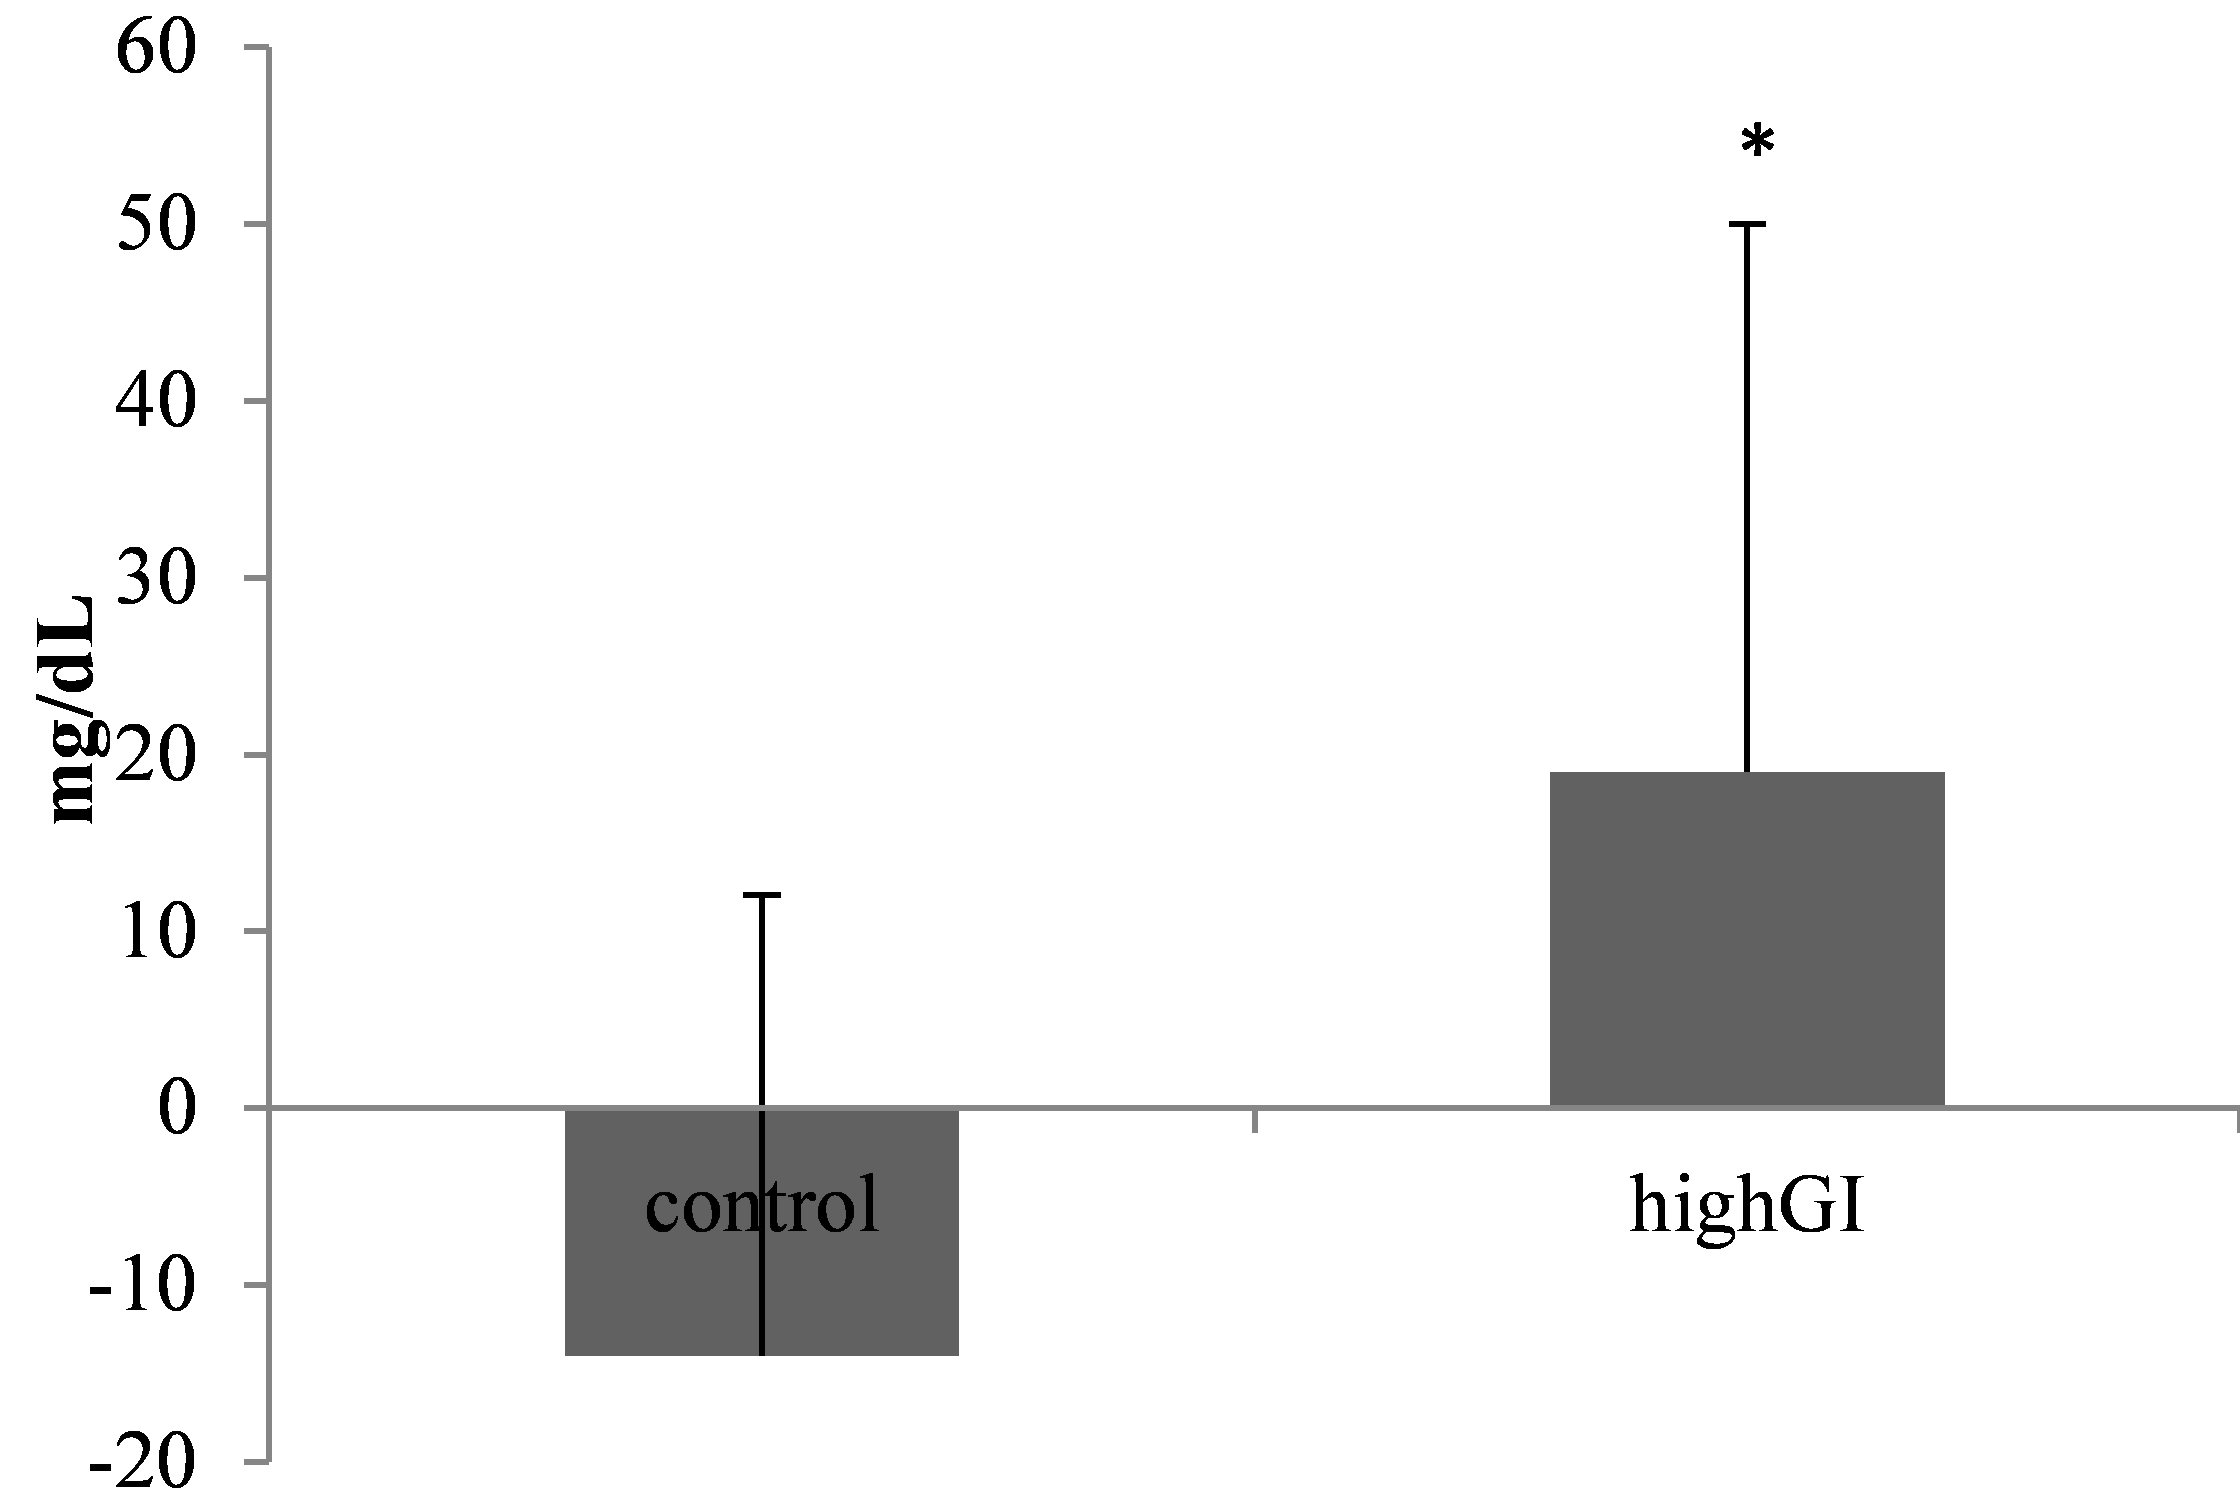
Figure 3. Blood glucose level changes (mg/dL). Statistical analysis was done using the independent T test (n= 7 in each group). *significantly different (P< 0.05) from the control groups.
Effects of high GI on the islet cells
It is proven that most cells in the islet are beta cells. They are 70-80% of all islet cells. The treatment of a highGI diet had not shown a significant difference (P= 0.346) (Table 2; Figure 4). However, there was a tendency for the highGI group to have a lower number of islet cells.
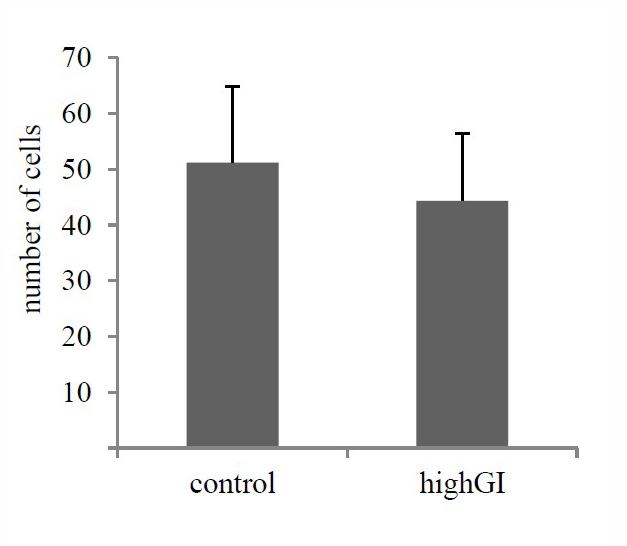
Figure 4. Number of islet cells after treatment (P=0.346). Statistical analysis was done using the independent T test (n= 7 in each group). No significantly different (P≥ 0.05) between groups.
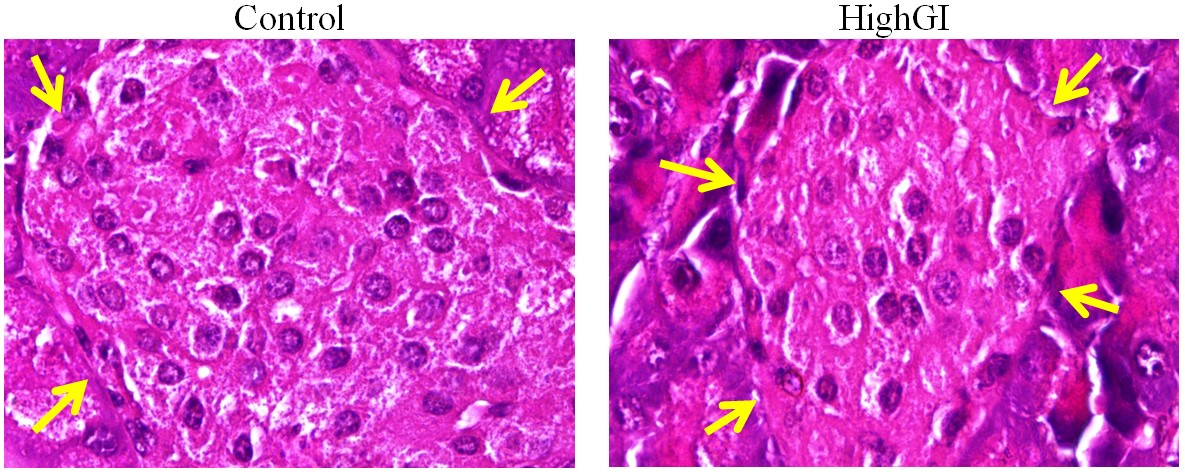
Figure 5. Islet cells in pancreatic islets (arrows: the margins of islet) with hematoxylin eosin staining, microscope Nikon eclipse Ci, enlarged 1000x, Optilab Viewer 2.2, Image raster 3.0
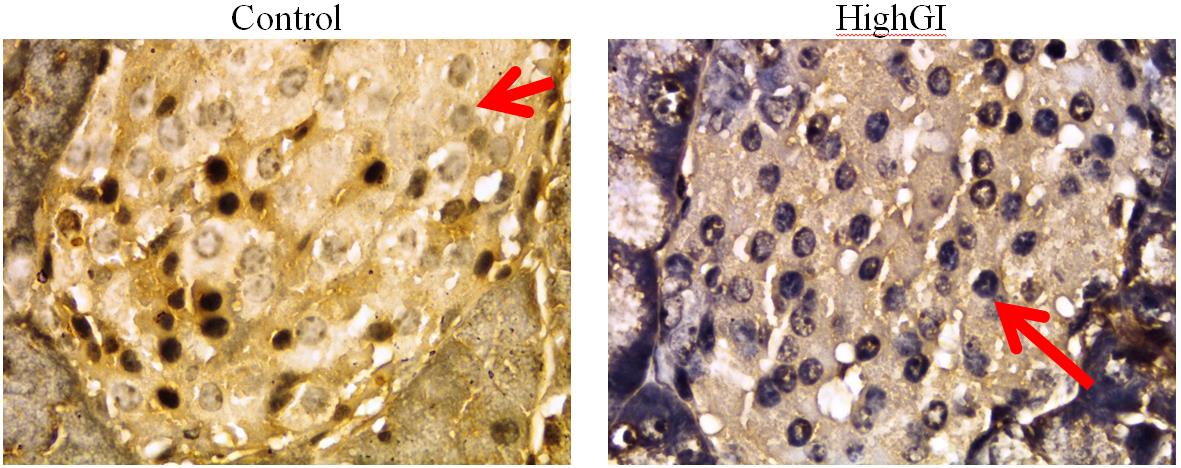
Effects of high GI on Akt and Pdx1 expression
The score of expression of Akt and Pdx1 in beta cells showed no significant difference between group (P= 0.729; P= 0.701) (Table 2; Figure 6). However, the average patterns seemed to have an increasing trend of score of expression of Akt and Pdx1.
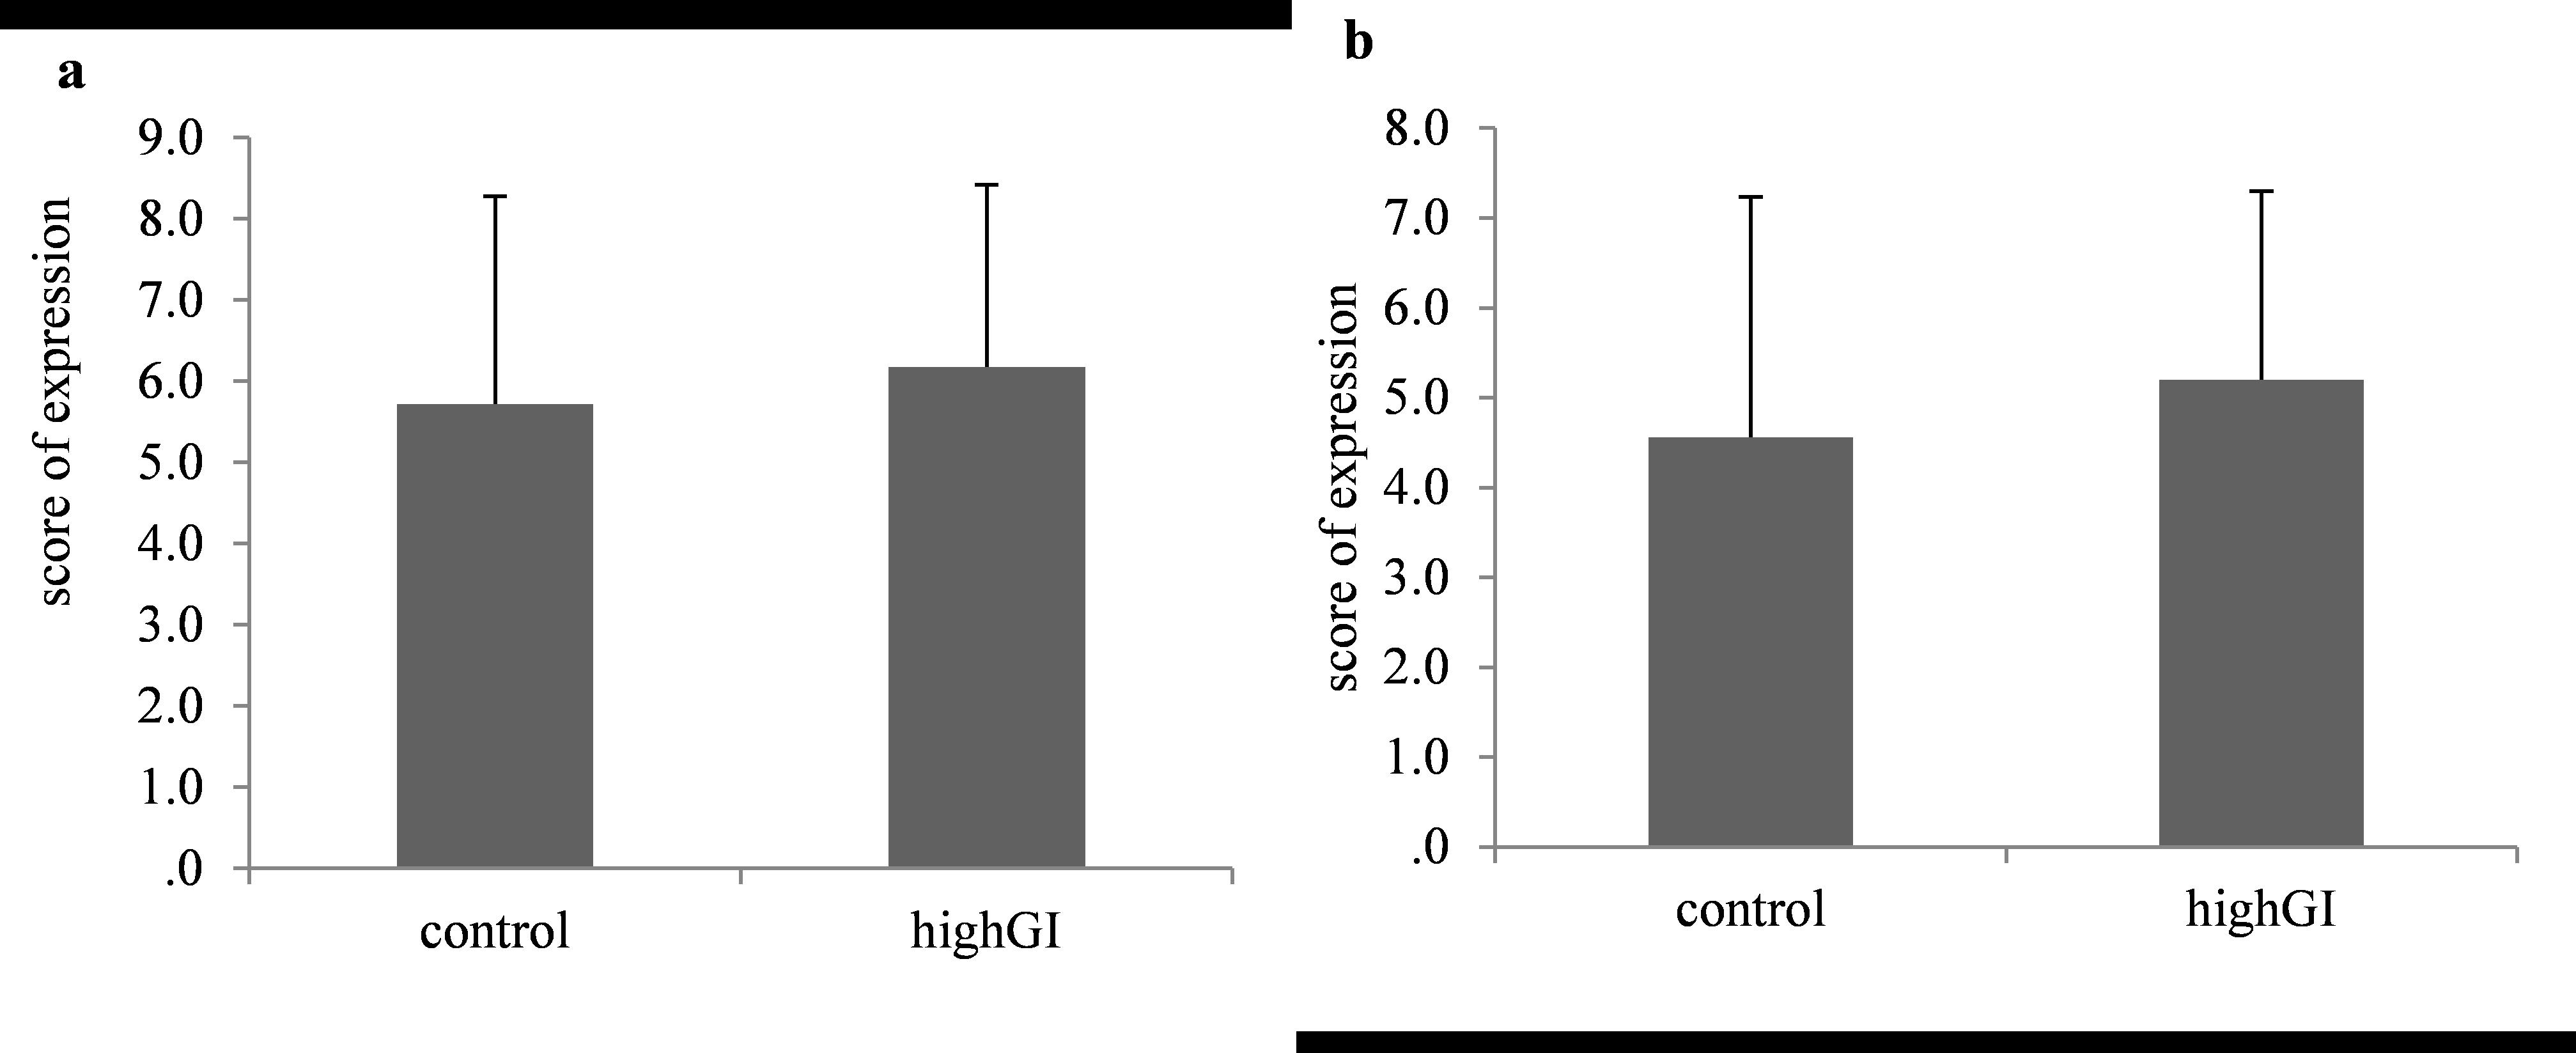
Figure 6. (a) Akt expression after treatment (P=0.729); (b) Pdx1 expression after treatment (P=0.701). Statistical analyses were done using the independent T test (n= 7 in each group). No significantly different (P≥ 0.05) between groups.
(a)
(b)
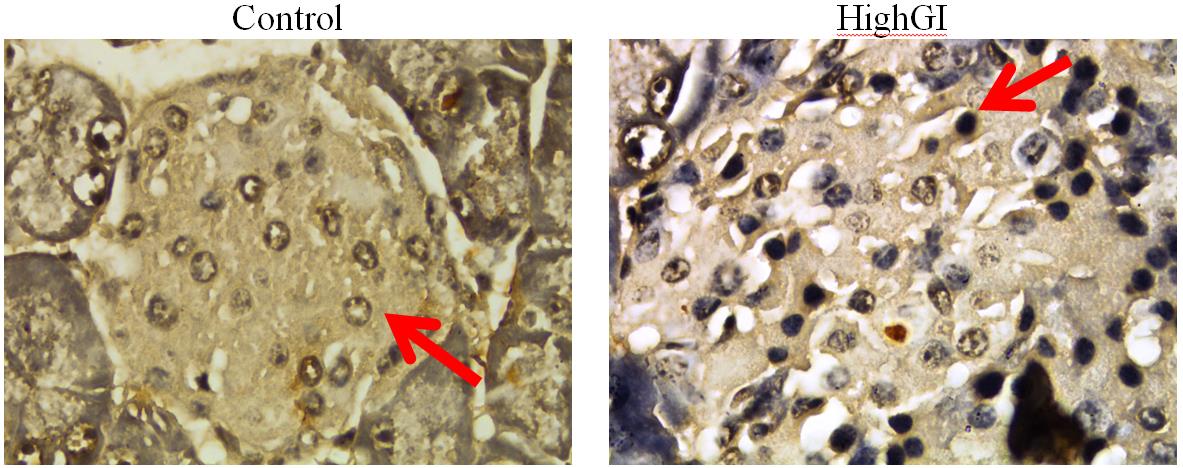
Figure 7. a) Akt expression in pancreatic islets; b) Pdx1 expression in pancreatic islets, with IHC staining, microscope Nikon eclipse Ci, enlarged 1000x, Optilab Viewer 2.2, Image raster 3.0
DISCUSSION
The highGI group had lower insulin level. It had a linearity effect with the level of blood glucose. The increase of blood glucose level could be the result of lower serum insulin level. The lower insulin levels cause the blood glucose to enter the cells lower, affecting higher blood glucose level in the highGI group.
The highest average Akt expression score of beta cells was found in the highGI group. However, there was no statistically significant difference. It indicates that this treatment had not been able to promote an effect to Akt. Yet, the statictic showed not significant difference; the mean of the Akt expression score was in line with the increase in Pdx1 expression scores. In previous studies, related to Akt, there were different results. They depended on the organs examined. Glucose diet for 24 weeks presented no sigficantly different increase of phospho-Akt/Akt ratio in the liver and no sigficantly different decrease of skeletal muscle (Forbes et al., 2013).
The mean of Pdx1 beta cells in the highGI group had a higher expression score than that of the control group. However, statistically, there was no significant difference between groups. This indicates that treatment could not have an effect on beta cell Pdx1 expression. Previous research showed that Akt can hinder GSK-3. It has been known that GSK-3 can stimulate the degradation of Pdx1. Accordingly, if there is a condition that can stimulate the increase of Akt, it can support the inhibition of Pdx1 degradation since GSK-3 can be inhibited by Akt (Humphrey et al., 2010). Prior studies showed that since E.13.5 to birth of embryo on mice, there are other transcription factors that can activate insulin transcription besides Pdx1. They are mammalian transcription factor (MafA and MafB), Nkx6.1 and Glut-2 (Seymour and Sander, 2011).
CONCLUSION
Our study has revealed that the chronic high GI diet can increase blood glucose level but reduce serum insulin level. However, there is no evidence of underlying mechanism of this chronic condition via Akt and Pdx1. Thus, further research is needed for other modulators on beta cells.
ACKNOWLEDGEMENTS
This research was supported by Kementerian Riset, Teknologi, dan Pendidikan Tinggi (Ministry of Research, Technology, and Higher Education) of Republic of Indonesia. The researchers would like to thank the Department of Physiology, Faculty of Medicine, Universitas Airlangga for the administration support, all team members at the embryology laboratory and the pathology laboratory, Faculty of Veterinary, Universitas Airlangga for their technical assistance during the research, and Laboratory of Universitas Airlangga Hospital Surabaya, for providing instruments for the research.
REFERENCES
Adeyi, A.O., Idowu, B.A., Mafiana, C.F., Oluwalana, S.A., and Oluwasola, L. 2012. Rat model of food-induced non-obese-type 2 diabetes mellitus: comparative pathophysiology and histopathology. International Journal of Physiology, Pathophysiology, and Pharmacoly. 4: 51–58.
Basu, S., Yoffe, P., Hills, N., and Lustig, R.H. 2013. The relationship of sugar to population-level diabetes prevalence: an econometric analysis of repeated cross-sectional data. PLoS One. 8. https://doi.org/10.1371/journal.pone.0057873
Campos, C. 2012. Chronic hyperglycemia and glucose toxicity: Pathology and clinical sequelae. Postgraduate Medical Journal. 124: 1–8. https://doi.org/10.3810/pgm.2012.11.2615
Chong, S., Ding, D., Byun, R., Comino, E., Bauman, A., and Jalaludin, B. 2017. Lifestyle changes after a diagnosis of type 2 diabetes. Diabetes Spectrum. 30: 43–50. https://doi.org/10.2337/ds15-0044
Forbes, J.M., Cowan, S.P., Andrikopoulos, S., Morley, A.L., Ward, L.C., Walker, K.Z., Cooper, M.E. and Coughlan, M.T. 2013. Glucose homeostasis is differentially affected by dietary maillard reaction products and macronutrients. Journal of Nutritional Biochemistry. 24: 1251–1257.
Hasegawa-Tanaka, T.O., and Machida, S.H. 2016. Changes in blood glucose and lipid metabolic parameters after high - carbohydrate diet ingestion in athletes with insulin resistance. Juntendo Medical Journal. 1–7. https://doi.org/10.14789/jmj.62.323
Herawati, L., Lukitasari, L., Rimbun, R., Purwanto, B., and Sari, G.M., 2019. The combination of exercise and ascorbic acid decrease blood glucose level and tend to ameliorate pancreatic islets area on high carbohydrate diet rats. International Journal of Applied Pharmaceutics. 11: 20–24. https://doi.org/10.22159/ijap.2019.v11s3.M1019
Herawati, L., Wigati, K.W., Rejeki, P.S., Widjiati, W., and Irawan, R., 2018. Increased apoptosis, but not pancreatic duodenal homeobox-1 expression in pancreatic islets is associated with intermittent glucose loads in mice. Diabetes Mellit. 21: 497–505. https://doi.org/10.14341/DM9437
Herawati, L., Wigati, K.W., Wibowo, W., and Harjanto. 2016. Survival rate of animal subject to interval and continuous addition of high calorie diet. In: Proceeding “The International Symposium on Global Physiology 2016”: The Role of Physiology to Increase the Quality of Life through One Health Concept: Health Care for Human, Animal, Plant, and Environment. Yogyakarta.
Hu, S., Li, S., Song, W., Ji, L., Cai, L., Wang, Y., and Jiang, W. 2016. Fucoidan from Cucumaria frondosa inhibits pancreatic islets apoptosis through mitochondrial signaling pathway in insulin resistant mice. Food Science and Technology Research. 22: 507–517.https://doi.org/10.3136/fstr.22.507
Humphrey, R.K., Yu, S., Flores, L.E., and Jhala, U.S. 2010. Glucose regulates steady-state levels of PDX1 via the reciprocal actions of GSK3 and AKT kinases. Journal Biologycal Chemistry. 285: 3406–3416. https://doi.org/10.1074/jbc.M109.006734
International Diabetes Federation. 2014. Key findings 2014 [WWW Document]. 2014. URL http://www.idf.org/about-diabetes/risk-factors (accessed 12. 18.15).
Jiang, W., Li, S., Hu, S., Wang, J., Song, W., Ji, L., and Wang, Y. 2015. Fucosylated chondroitin sulfate from sea cucumber inhibited islets of langerhans apoptosis via inactivation of the mitochondrial pathway in insulin resistant mice. Food Science and Biotechnology. 24: 1105–1113. https://doi.org/10.1007/s10068-015-014-1-9
Johnson, J.D., Bernal-mizrachi, E., Alejandro, E.U., Han, Z., Kalynyak, T.B., Li, H., Beith, J.L., Gross, J., Warnock, G.L., Townsend, R.R., et al. 2006. Insulin protects islets from apoptosis via Pdx1 and specific changes in the human islet proteome. Proceedings of the National Academy of Sciences of the United States of America.103: 19575–19589. https://doi.org/10.1073/pnas.0604208103
Khwaja, A. 1999. Apoptosis: Akt is more than just a bad kinase. Nature. 401: 33–34. https://doi.org/10.1038/43354
Murtaugh, L.C. 2007. Pancreas and beta-cell development: from the actual to the possible. Development. 134: 427–438. https://doi.org/10.1242/dev.02770
Nowak, M., Madej, J.A., and Dziegiel, P. 2007. Intensity of Cox2 expression in cells of soft tissue fibrosacrcomas in dogs as related to grade of tumour malignancy. Bulletin-Veterinary Institute in Pulawy. 51: 275–279.
Pathak, A., and Pathak, R. 2012. Study of life style habits on risk of type 2 diabetes. International Journal of Applied and Basic Medical Research. 2: 92–96. https://doi.org/10.4130/2229-516X.106349
Puddu, A., Sanguineti, R., Mach, F., Dallegri, F., Viviani, G.L., and Montecucco, F. 2013. Update on the protective molecular pathways improving pancreatic beta-cell dysfunction. Mediators Inflamm. 2013: Article ID750540. https://doi.org/10.1155/2013/750540
Putri, E.A.C., Argarini, R., Purwanto, B., and Herawati, L. 2018. Intermittent physical training decreases peak of blood glucose level after meals in rats. In: Proceedings Of Surabaya International Physiology Seminar. pp. 76–79.
Seymour, P.A., and Sander, M. 2011. Historical perspective: beginnings of the beta cell: current perspectives in beta cell development. Diabetes. 60: 364–376. https://doi.org/10.2337/db10-1068
Sheng, Q., Xiao, X., Prasadan, K., Chen, C., Ming, Y., Fusco, J., Gangopadhyay, N.N., Ricks, D., and Gittes, G.K. 2017. Autophagy protects pancreatic beta cell mass and function in the setting of a high-fat and high-glucose diet. Scientific Reports. 7: 16348. https://doi.org/10.1038/s41598-017-16485-0
Spaeth, J.M., Gupte, M., Perelis, M., Yang, Y., Cyphert, H., Guo, S., Liu, J., Guo, M., Bass, J., Magnuson, M.A., et al. 2017. Defining a novel role for the PDX1 transcription factor in islet β cell maturation and proliferation during weaning. Diabetes. 66(11): 2380-2839. https://doi.org/10.2337/db16-1516
The President and Fellows of Harvard College. 2017. The Nutrition Source Carrohydrates and Blood Sugar. 1–8.
Wang, J., Hu, S., Wang, J., Li, S., and Jiang, W. 2016. Fucoidan from Acaudina molpadioides protects pancreatic islet against cell apoptosis via inhibition of inflammation in type 2 diabetic mice. Food Sciences and Biotechnology. 25: 293–300. https://doi.org/10.1007/s10068-016-0042-6
Xu, R., Wan, Y., Tang, Q., Wu, J., and Cai, W. 2010. Carbohydrate-to-fat ratio affects food intake and body weight in Wistar rats. Experimental Biology and Medicine. 235: 833–838. https://doi.org/10.1258/ebm.2010.009276
Zheng, Y., Ley, S. a H., and Nature, F.B.H. 2018. Global aetiology and epidemiology of type 2 diabetes mellitus and its complications. Nature Reviews Endocrinology. 14: 88–98. https://doi.org/10.1038/nrendo.2017.151
Lilik Herawati1, Gadis Meinar Sari1, and Roedi Irawan2*
1Department of Physiology, Faculty of Medicine, Universitas Airlangga, Surabay 60131, Indonesia
2Department of Pediatric, Faculty of Medicine, Universitas Airlangga, Surabaya 60131, Indonesia
*Corresponding author. E-mail: roedi.dr.rsds@gmail.com
Total Article Views
Article history:
Received: June 17, 2019
Revised: August 7, 2019
Accepted: August 19, 2019