 ISSN: 2822-0838 Online

Optimization of Nitrogen Fertilizer Application in Lowland Rice Production System of Agricultural Resource System Research Station Using Tailored Farm-plot Database
Tapthai Norsuwan*, Kularb Utasuk, Thakoon Panyasai, and Chanchai SangchyoswatPublished Date : 2020-05-12
DOI : https://doi.org/10.12982/CMUJNS.2020.0022
Journal Issues : Number 3, July-September 2020
ABSTRACT The objectives of this study were to monitor the effects of nitrogen and phosphorus from input sources on rice production system by using 3-year-plot database and to optimize application rates of nitrogen fertilizer of 4 rice varieties. Tailored farm-plot database was applied to manipulate crop production data in farming system of Agricultural Resource System Research Station, Chiang Mai University, Thailand during July, 2014 and December, 2016. Nitrogen and phosphorus amount from input sources were quantified by referent nutrient contents in crop residues and fertilizer materials. Stepwise multiple regression was used for selective monitoring input crop nutrients on above ground weight and grain yield. The multiple regression models could explain 77 and 37% of variations on above ground weight and grain yield, respectively. The average harvest indexes and average yield of above 75th percentile of rice yield records of Khao Dowk Mali 105 (KDML), Mali Dang (MD), Sangyod (SY), and Hom Nin (HN) varieties were used to quantify the expected above ground weight. The results from baseline scenario indicated that application of 14.6, 4.0, 0 and 8.9 kg N.ha-1 with incorporated green manure were sufficient to supply the expected yield as 5,120.0, 5,597.5, 5,030.0 and 6,735.0 kg.ha-1 of KDML, MD, SY and HN, respectively. In case of without incorporated green manure, application of 35.6, 24.3, 16.1 and 22.2 kg N.ha-1 were required in comparison with site-usual application rate as 69.8 ± 24.6 kg N.ha-1. The results of this study may guide for site-specific crop nutrient management, which relied on site-database.
Keywords: Farm-plot database, Farming system, Site-specific nutrient management, Lowland rice
INTRODUCTION
Under Thailand 4.0’s campaign, collaborative farming has been launched to take advantage form the larger-scale production by gathering of the small farmlands together. Expectedly, operation of the gathering farms could improve cost effective and productivity throughout the cooperative management for production factors and area-base monitoring (Ministry of Agriculture and Cooperatives, 2016; Thailand Broad of Investment, 2017). In this case, modern farm management is needed for upscale monitoring and support decision and policy making by data-driven approach. For instance, plant disease and insect pest outbreak (Birt et al., 2012), and variation of crop growth and yield (Ginaldi et al., 2016; Jiménez et al., 2016) or even the sustainability of farmlands (Esmeijer et al., 2015; Latruffe et al., 2016) were evaluated under data collection of production factors and biophysical factors including socioeconomic and environmental issues from the various scales of the cooperators’ network. In traditional data management, those process-mediated data of farm operation were usually structured and stored in the relational database system (Wolfert et al., 2017).
Manipulation of nutrient cycling was crucial reflections of the productivity, stability, and sustainability in the farming system (Conway, 1985; Gliessman, 1988). Insufficient understanding of the optimal nutrient supply and excessive fertilization were the major constraints to improve nutrient-use efficiency in the rice production system (Lafitte, 1998). The concept of site-specific nutrient management was developed to support the decision making to improve crop nutrient-use efficiencies on the variability of soil nutrient supply and crop growth response to nutrients of the individual farms (Dobermann and Witt, 2004). Several techniques were adapted for the site-specific nutrient management, including nutrient omission (Dobermann et al., 2002; Nagarajan et al., 2004), leaf color chart (Liu et al., 2013; Ali et al., 2015), critical crop nitrogen accumulation and nitrogen nutrient index (Ata-Ul-Karim et al., 2017). Soil inherent fertility potential zones (Davatgar et al., 2012).
Alternatively, analysist of variability and determinants in rice growth and development are the alternative approach to optimize fertilizer application rates. Climatic and edaphic condition, and agricultural practices were used in the identification of determinant factors of rice yield (Niang et al., 2017). In the previous studies, identified factors affecting variation of rice yield were analyzed from the particular sets of data collection by several regression techniques. For instance, multiple regression analyses was used to quantify the effects of fertilizer rates, soil test, and temperature on rice grain yield (Carmen, 1968). Regression analysis techniques were used to analyze impact of soil quality index of soil physical properties (Bappa et al., 2016) and climatic condition (Rahman et al., 2005; Barnwal and Kotani, 2013) on yield variation. In addition, mix regression analysis was used to descript the relationship between yield and limiting factors of seedling date, soil pH and cation exchange capacity for site-specific approach (Haefele and Konboon, 2009).
In this study, we aimed to apply data-driven approach to monitor and improve cost effective for on-site fertilizer application rate under 3-year-plot dataset in Agricultural Resource System Research Station. The tailored farm-plot database was designed to record cropping sequences, variability of crop growth and yield, and the usage of resources in crop productions of the plots in a farm system. Stepwise multiple regression technique (Rencher, 2003) was used to filter for the input variables of different sources of nitrogen and phosphorus which affect to rice growth significantly and quantify the effects of the selective inputs on rice growth. We further tried to optimize site-specific application rates of nitrogen fertilizer of 4 rice varieties by using crop harvest indexes and above ground weight.
MATERIAL AND METHODS
Farming system background
In 5.2 ha of Agricultural Resource System Research Station, Chiang Mai University, Chiang Mai, Thailand (18º46'N, 98°55'E, 350 m a.s.l.) was the irrigated lowland-rice-based production system. The soil is a loamy-skeletal, mixed, isohyperthermic Typic (Kandic) Paleustult, Mae Rim series. During 2014 to 2016, yearly average temperature was 26.9°C. The daily average minimum and maximum temperature were between 22.2 and 34.0°C and yearly average precipitation was 1,034 mm. Rice crops were cultivated in dry (January-April) and wet (July-December) seasons annually. Khao Dowk Mali 105 (KDML), Mali Dang (MD), Sangyod (SY), photosensitive rice, and Hom Nin (HN), non-photosensitive rice were selective main varieties in the conventional lowland rice production without pesticide application. Green manures; such as, Sesbania rostrata and Crotalaria juncea were incorporated to several plots before flooding. Rice seedlings were transplanted by rice transplanter as the setting space 0.25 x 0.25 m2. Chemical fertilizers were usually applied to planted plots as the rates of 69.8 ± 24.6 kg N and 23.7 ± 15.9 kg P.ha-1. At the late of maturity stage, paddy was harvested by combine harvester.
Farm-plot database and data collections
Tailored farm-plot database operated in MS Access was applied to manipulate data collection of 103 rice crops and other crops during July, 2014 and December, 2016. The cultivation activities of the research station were recorded to tailored forms operated in MS Access. Tailored farm-plot form (Figure 1) consisted of plot ID, planted crop, cultivar, planting date, cultivated area, harvest date, harvest component, residue materials, yield and residue of 2 replication of one square meter, residue materials, and incorporated residue percentage, fertilizer application date, application area, fertilizer material, and application rate. The input data was transferred into related database tables on date basis (Figure 2). Cultivation ID was regulated by date of the started cultivation activity combination with plot ID in order to categorize the identical activities and plots.
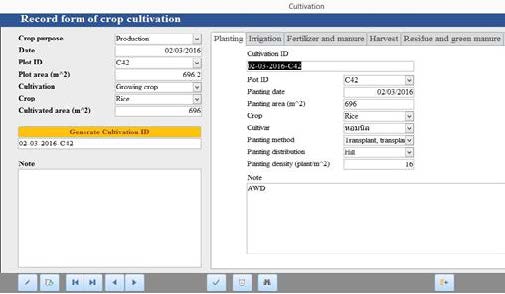
Figure 1. Tailored farm-plot form operated in MS Access.
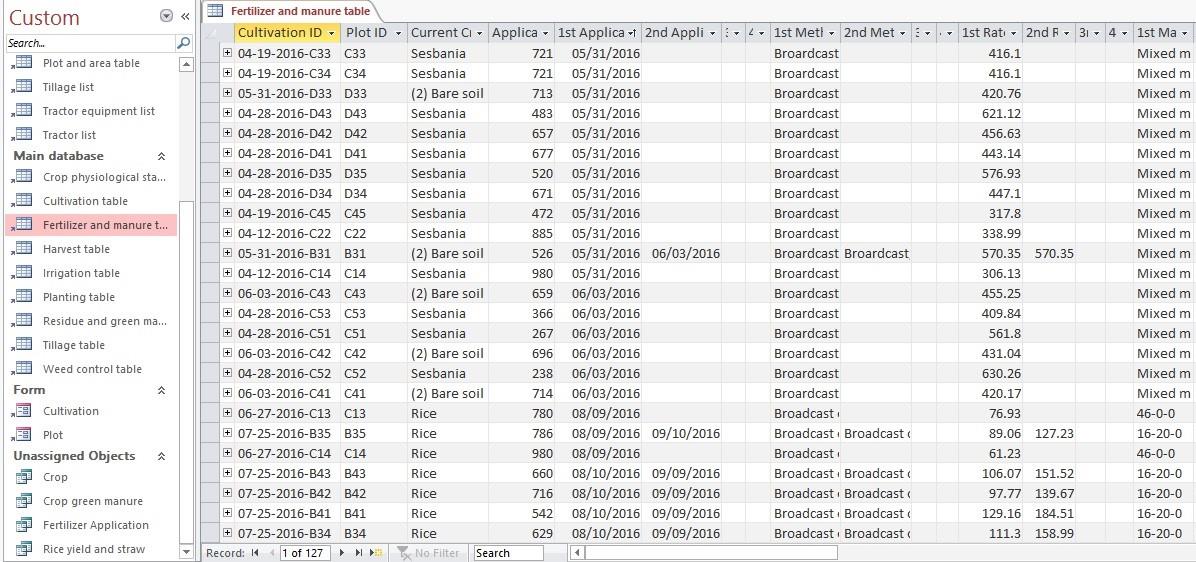
Figure 2. Table of plot database operated in MS Access.
The used data collection in this study were 103 rice crops, which were consisted of 26, 38, and 39 crops in 2014, 2015, and 2016, respectively (Table 1). The rice crops in 2014 did not have record for variable values of green manure and previous crop residues incorporation, manure application rates. The data collection of the crops in 2015-2016 were composed as the followings; 1.) Transplanted rice variety, 2.) Transplant and harvest dates, 3.) Transplanted area, 4.) Rice yield and above ground weight, 5.) Application rate and date of chemical fertilizer after transplanting rice, 6.) Application rate and date of chemical fertilizer as pre-season fertilizing within the same year, 7.) Incorporation weight and date of green manure before land preparation, 8.) Application rate and date of chicken and cattle manure since the last rice crop was harvested, 9.) Incorporation rate and date of crop residues, for instance, rice straw, corn and sun flower stover, since the last rice crop was harvested, and 10.) Calculated nitrogen balance during July, 2014 and June, 2015. Application of fertilizer and incorporation of crop residues and green manure (Table 2) were allocated into nitrogen and phosphorus inputs in the planted plots by nutrient percentage of dry weight referred to literature reviews. The nitrogen balances of the plots were examined based on FAO Fertilizer and Plant Nutrition Bulletin No.14 and added into the data collection of rice crop in 2016. Set-zero-nitrogen balance were added in data collection of the cases in 2015.
Table 1. Straw, yield and harvest index of rice cultivation during July, 2014 and December, 2016.
|
Rice variety |
|
Crop component (kg DM.ha-1) |
|
Harvest index |
||||||
|
|
Straw |
Yield |
Above ground weight |
|
||||||
|
|
Mean |
SD |
Mean |
SD |
Mean |
SD |
|
Mean |
SD |
|
|
KDML (n= 57) |
|
11,210.8 |
3,610.9 |
4,774.9 |
890.6 |
16,489.0 |
3,590.0 |
|
0.334 |
0.098 |
|
MD (n = 17) |
|
5,294.1 |
1,085.4 |
4,400.6 |
1,022.0 |
9,694.7 |
1,844.3 |
|
0.453 |
0.052 |
|
SY (n= 12) |
|
11,857.5 |
3,061.7 |
4,721.3 |
1,216.5 |
16,578.7 |
4,111.3 |
|
0.286 |
0.031 |
|
HN (n= 17) |
|
6,958.2 |
1,926.1 |
5,284.7 |
1,171.1 |
12,242.9 |
2,696.4 |
|
0.435 |
0.068 |
Table 2. Percentage of nitrogen and phosphorus in crop residues and fertilizer materials from literature reviews.
|
Crop residues and fertilizer |
|
Percentage of nutrient by dry weight |
||
|
|
Nitrogen |
|
Phosphorus |
|
|
Rice straw |
|
0.86 |
|
0.09 |
|
Soybean straw |
|
1.81 |
|
0.13 |
|
Corn stover |
|
0.40 |
|
0.12 |
|
Sunflower stover |
|
1.30 |
|
0.09 |
|
Sunn hemp |
|
2.70 |
|
0.22 |
|
Sesbania |
|
3.10 |
|
0.31 |
|
Chicken manure |
|
2.20 |
|
1.80 |
|
16-20-0 |
|
16 |
|
20 |
|
46-0-0 |
|
46 |
|
0 |
|
16-16-16 |
|
16 |
|
16 |
|
Mixed chemical fertilizer for pre-season fertilizing |
|
10.93 |
|
13.51 |
Quantification of the effects of nitrogen and phosphorus input sources on above ground weight and yield of rice
Stepwise multiple regression analysis was used to quantify the effect of rice varieties, heading age, and quantified nitrogen and phosphorus from various input sources on yield (Y) and above ground weight (AGW) separately (Table 3). Potassium from all sources was excluded to avoid high collinearity between the variables in the multiple regression. Either nitrogen or phosphorus from the same source were adopted from one of them because of using constant percentage of nutrient from the same source in the literature reviews. The nutrient source variables were selected under the following considerations as 1.) Input sources from outside of the plot, for instance, nitrogen and phosphorus from application of chemical fertilizer were included. 2.) Nitrogen from incorporated crop green manure was included because of fixing atmosphere nitrogen by green manure. 3.) Pre-season phosphorus from mixed chemical fertilizer before incorporation of green manure was added instead of nitrogen from the same source. 4.) The phosphorus from incorporated green manure and crop residues were excluded because phosphorus in green manure was up taken from the plot soil directly.
In order to discriminate the effect of 4 rice varieties, dummy variables were considered as representatives of photosensitive rice varieties, including KDML, MD, and SY, and non-photosensitive rice varieties, HN. Heading age of rice (HA) were indicated by DSSAT version 4.6 to quantify the effect of vegetative duration on yield and above growth weight. The second degree polynomial of nitrogen and phosphorus from chemical fertilizer (N and P) and the interaction term between N and P, and provided nitrogen and phosphorus from other sources were added to fit the regression and to indicate interaction effects. The data collection were arranged and analyzed in IBM SPSS Statistics version 23. Dummy variable of rice varieties, HA, and N were put into the multiple regression by enter method to fix those variable in the multiple regression permanently without removal process. In order to remove unnecessary variables, stepwise method was applied for the nutrient input variables by setting entry and removal criteria at 0.25 and 0.30 of F probability, respectively.
Table 3. Definition, range and mean of nitrogen and phosphorus variable inputs in the stepwise multiple regression for yield and above ground weight of rice.
|
Variable |
|
Explanation |
|
Range |
Mean ± Std. |
|
|||||||||||||
|
|
Y |
|
Rice yield at 14-18% moisture (kg.ha-1) |
|
2,620 – 7,440 |
4,744 ± 971 |
|
||||||||||||
|
|
StrW |
|
Straw dry weight (kg.ha-1) |
|
3,430 – 19,900 |
9,830 ± 4,313 |
|
||||||||||||
|
|
AGW |
|
Above growth weight (kg.ha-1) |
|
6,860 – 25,650 |
14,574 ± 4,584 |
|
||||||||||||
|
|
KDML |
|
Dummy variable for “Khao Dowk Mali 105” (n=35) |
|
- |
- |
|||||||||||||
|
|
MD |
|
Dummy variable for “Mali Dang” (n=17) |
|
- |
- |
|||||||||||||
|
|
SY |
|
Dummy variable for “Sangyod” (n=14) |
|
- |
- |
|||||||||||||
|
|
HN |
|
Dummy variable for “Hom Nin” (n=11) |
|
- |
- |
|||||||||||||
|
|
HA |
|
Day number from transplanting to heading stage (day) which was simulated by DSSAT version 4.6 |
|
57 - 112 |
87.3 ± 16.9 |
|||||||||||||
|
|
N |
|
Nitrogen (kg.ha-1) from chemical fertilizer applied after transplant |
|
0 - 108.7 |
69.8 ± 24.6 |
|
||||||||||||
|
|
P |
|
Phosphorus (kg.ha-1) from chemical fertilizer applied after transplant |
|
0 - 53.0 |
23.7 ± 15.9 |
|
||||||||||||
|
|
Pp |
|
Phosphorus (kg.ha-1) from chemical fertilizer as pre-season fertilizing within the same year |
|
0 - 154.1 |
37.5 ± 46.8 |
|
||||||||||||
|
|
Ng |
|
Nitrogen (kg.ha-1) from incorporated green manure before land preparation, including Sesbania rostrata and Crotalaria juncea |
|
0 - 284.0 |
40.7 ± 65.9 |
|
||||||||||||
|
|
Nm |
|
Accumulative nitrogen (kg.ha-1) from applied chicken, cattle manure after the end of the last year until the planting date of the next rice crop |
|
0 - 142.9 |
42.8 ± 51.5 |
|
||||||||||||
|
|
Nr |
|
Accumulative nitrogen (kg.ha-1) from incorporated crop residues after the end of the last year until the planting date of the next rice crop |
|
0 - 286.0 |
75.7 ± 70.9 |
|
||||||||||||
|
|
Nbal |
|
Calculated nitrogen balance (kg.ha-1) during July, 2014 and June, 2015 according to FAO framework |
|
-47.2 - 194.3 |
17.4 ± 47.7 |
|
||||||||||||
|
|
NxP |
|
|
|
- |
- |
|
||||||||||||
|
|
NxPp NxNg |
|
|
|
- |
- |
|
||||||||||||
|
|
NxNm |
|
|
|
- |
- |
|
||||||||||||
|
|
NxNr |
|
Interaction term as indicated
Nitrogen from chemical fertilizer squared Phosphorus from chemical fertilizer squared Calculated nitrogen balance squared |
|
- |
- |
|
||||||||||||
|
|
NxNbal |
|
|
|
|||||||||||||||
|
|
PxPp |
- |
- |
|
|||||||||||||||
|
|
PxNg |
- |
- |
|
|||||||||||||||
|
|
PxNm |
- |
- |
|
|||||||||||||||
|
|
PxNr |
- |
- |
|
|||||||||||||||
|
|
PxNbal |
|
|
|
|||||||||||||||
|
|
PpxNg |
- |
- |
|
|||||||||||||||
|
|
PpxNm |
- |
- |
|
|||||||||||||||
|
|
PpxNr |
- |
- |
|
|||||||||||||||
|
|
N^2 |
- |
- |
|
|||||||||||||||
|
|
P^2 |
- |
- |
|
|||||||||||||||
|
|
Nbal^2 |
- |
- |
|
|||||||||||||||
|
|
|
|
|
||||||||||||||||
Scenario generation and optimization of application rates for nitrogen fertilizer
The multiple regression model of above ground weight was used to generate the scenarios by varying nitrogen application rates and adopting the mean values (Table 3) of the other selective variables from the stepwise procedure. Varying nitrogen application rates with nitrogen from incorporated green manure (Ng) and without Ng scenarios under 4 rice varieties were adopted to illustrate the relationship between nitrogen application rates and the above ground weight.
In this study, yield weight of above 75th percentile of the records were specified to be the representative of high yield that the rice cultivations of the farming system could be reached in the previous years. Therefore, the average values of the above 75th percentile records of rice yield and its average harvest indexes were used to compute the expected above ground weight by rice yield/harvest index = expected above ground weight. It was speculated that the rice cultivation with the expected above ground weight of the particular rice variety could produce the high yield weight as the average values of the above 75th percentile records. In order to compute the optimizing rate of nitrogen fertilizer, the values of the expected above ground weight were substituted to the generated scenarios of the relationship between application rates of nitrogen fertilizer and the above ground weight.
RESULTS
The effects of nitrogen and phosphorus input sources on above ground weight and yield
Multiple regression analysis under entering and stepwise procedures displayed that entered available were fixed in the regression. Under the stepwise procedure, the variable was selected on step by step to improve the covering variation capability (R2) in above ground weight and yield of rice (Table 4).
A variable was introduced to the regression when the variable generated the best R2 and coefficient value of the variable that had P<0.25 in the current set of variable. When F probability of one of the previous selected variables was minimized to P<0.30 by a current introduced variable, then the previous one was removed from the regression. 7 and 8 of 24 nutrient input variables were introduced to the regression for above ground weight and yield of rice, respectively.
Multiple regression for above ground weight (AGW) from 77 cases contained 4 entered variables including KDML, MD, SY, HA, and N, and 7 stepwise-selected variables including N, Nbal, PpxNg, NxNg, PxNg, PpxNm, N^2, and Ng. The adjusted R2 indicated that 77 % of the variation in above ground weight of rice were explained by the present set of variables in the regression. The analysis of variance proved that coefficient of entered variables of rice variety were not significant at P>0.05 except for SY variety which was significant at P<0.01. Coefficient values of the variables provided quantitative contribution on above ground weight and yield of rice. The coefficient values implied that SY variety had the highest AGW more than KDML around 5,514.3 kg DM.ha-1. MD variety had the lowest AGW compared to other varieties by the same nutrient input variables. Heading age (HA) of rice were positively strong related to AGW by P<0.01. The partial effect showed that 1 more day of HA affect to AGW increasing 179 kg DM.ha-1.
Table 4. Coefficients of variables in the multiple regression for above ground weight (AGW) and yield (Y) of rice.
|
AGW |
|
Y |
||||||||
|
Variable |
|
Coefficient |
|
P |
|
Variable |
|
Coefficient |
|
P |
|
Constant |
|
-13,985.77 |
|
0.03 |
|
Constant |
|
-394.91 |
|
0.63 |
|
HN |
|
2,747.33 |
|
0.09 |
|
HN |
|
757.76 |
|
0.25 |
|
MD |
|
-151.26 |
|
0.92 |
|
MD |
|
1,175.88 |
|
0.08 |
|
SY |
|
5,514.38 |
|
0.00 |
|
SY |
|
1,368.11 |
|
0.01 |
|
HA |
|
179.33 |
|
0.00 |
|
HA |
|
48.30 |
|
0.02 |
|
N |
|
285.44 |
|
0.01 |
|
N |
|
34.23 |
|
0.00 |
|
Nbal |
|
28.34 |
|
0.00 |
|
P^2 |
|
-2.69 |
|
0.00 |
|
PpxNg |
|
0.76 |
|
0.00 |
|
PxNr |
|
1.37 |
|
0.00 |
|
NxNg |
|
-1.40 |
|
0.02 |
|
NxNr |
|
-0.48 |
|
0.00 |
|
PxNg |
|
1.36 |
|
0.01 |
|
PpxNr |
|
0.11 |
|
0.01 |
|
PpxNm |
|
0.20 |
|
0.02 |
|
P |
|
-42.11 |
|
0.29 |
|
N^2 |
|
-1.71 |
|
0.00 |
|
NxP |
|
1.42 |
|
0.00 |
|
Ng |
|
62.93 |
|
0.03 |
|
NxNm |
|
-0.071 |
|
0.04 |
|
|
|
|
|
|
|
PxPp |
|
-0.822 |
|
0.00 |
|
R2 |
|
0.807 |
|
R2 |
|
0.480 |
||||
|
Adjusted R2 (n = 77) |
|
0.771 |
|
Adjusted R2 (n = 77) |
|
0.373 |
||||
Coefficients of stepwise-selected variables were statistically significant at P<0.01 and P<0.05. The interaction terms of PpxNg, PxNg, and PpxNm were selected by stepwise procedure without main effects of Pp, P and Nm on AGW. The coefficient indicated that AGW increased by the direct increase of Nbal and Ng as well as interaction terms of PpxNg, PxNg and PpxNm. In contrast, interaction of NxNg were inversely variation on AGW. Coefficient of quadratic effect of applied nitrogen fertilizer from linear term and quadratic term associated strongly in the regression at P<0.05 and P<0.01, respectively. Application of nitrogen from chemical fertilizer source had the most effect on AWG. The partial effect of linear term N indicated that application of 1 N kg.ha-1 contributed for increasing AGW 285.4 kg DM.ha-1. Nbal indicated that if Nbal from 2014-2015 remain in soil 1 kg.ha-1, AGW in 2016 would be increased 28.34 kg DM.ha-1. Multiple regression for rice yield contained 9 stepwise-selected variables including N, P^2, P, and interaction of PxNr, NxNr, PpxNr, P, NxP, NxNm, and PxPp.
The set of stepwise-selected variables in the multiple regression failed to explain the relationship between nutrient source variables and rice yield by covered only 37 % of variation in rice yield, which this implied that the multiple regression for rice yield should not be used to explain the effects of nutrient input sources on rice yield.
Scenarios of the effect of nitrogen input sources on above ground weight and optimization of application rates for nitrogen fertilizer
The generated scenarios illustrated that above ground weight (AGW) of 4 rice varieties (Figure 3) ranged from 19,181 to 24,847 kg DM.ha-1 under application of 66.8 kg N.ha-1 with incorporated green manure (Table 5). Without incorporated green manure, AGW ranged from 18,429 to 24,095 kg DM.ha-1 by application of 83.5 kg N.ha-1. AWG of Sangyod variety (SY) was the highest following by Hom Nin (HN) and Khao Dowk Mali (KDML) and Mali Dang (MD), respectively. From the relationship between nitrogen application rates and AGW showed that incorporation of green manure diminished nitrogen application 16.7 kg N.ha-1 and increased the maximum AWG of the rice varieties around 3.1 to 4.1% compared to the AWG without corporation of green manure.
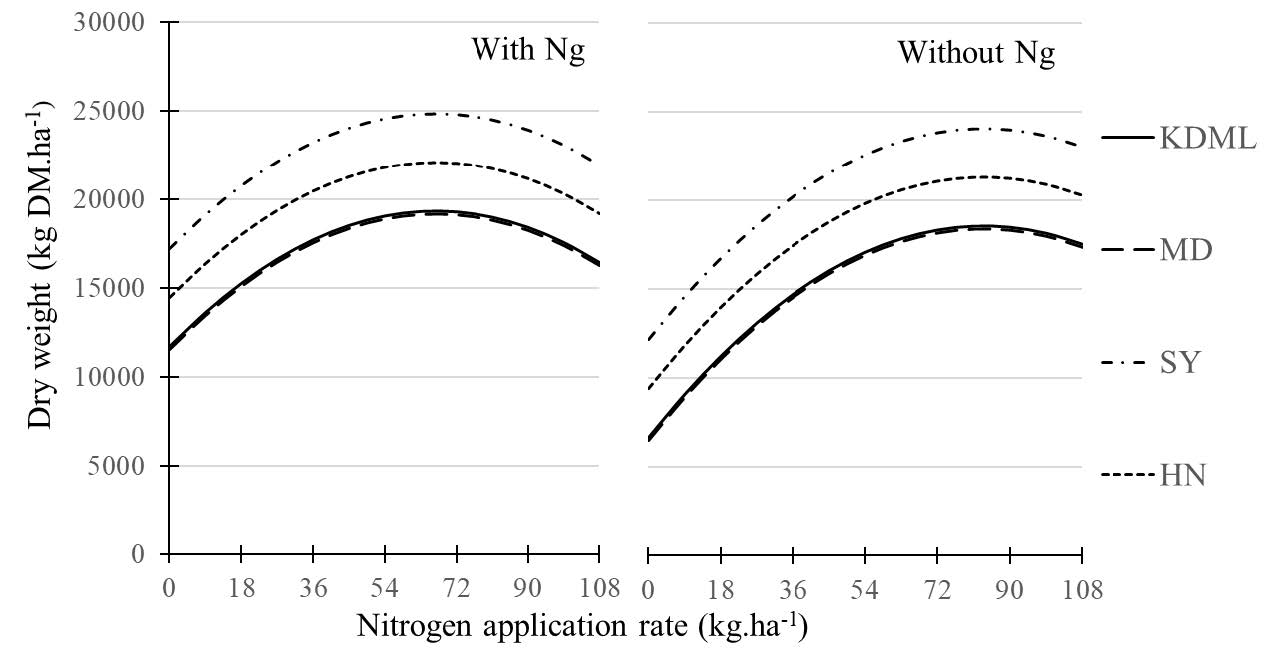
Figure 3. Scenarios of above ground weight of 4 rice varieties from the multiple regression models under varying nitrogen rates with and without nitrogen from green manure.
Table 5. The relationship between nitrogen application rates and maximum above ground weights (AGW) from the multiple regression models.
|
Scenario |
|
Relationship of N application rate (x) and AGW (y) |
|
Maximum AGW (y) (kg DM.ha-1) |
N rate (x) for maximum AGW (kg N.ha-1) |
|
KDML with Ng |
|
y = - 1.7x2 + 228.4x + 11,702 |
|
19,332 |
66.8
|
|
MD with Ng |
|
y = - 1.7x2 + 228.4x + 11,551 |
|
19,181 |
|
|
SY with Ng |
|
y = - 1.7x2 + 228.4x + 17,217 |
|
24,847 |
|
|
HN with Ng |
|
y = - 1.7x2 + 228.4x + 14,450 |
|
22,080 |
|
|
KDML without Ng |
|
y = - 1.7x2 + 285.4x + 6,669 |
|
18,580 |
83.5
|
|
MD without Ng |
|
y = - 1.7x2 + 285.4x + 6,518 |
|
18,429 |
|
|
SY without Ng |
|
y = - 1.7x2 + 285.4x + 12,184 |
|
24,095 |
|
|
HN without Ng |
|
y = - 1.7x2 + 285.4x + 9,416 |
|
21,327 |
The average value of rice yield records from the above 75th percentile by the rice varieties (Table 6) ranged from 5,030.0 to 6,735.0 kg DM.ha-1, which were higher than the mean values (Table 1) around 6.5 to 27.4%. KDML variety had 10 from 57 records (n=10) that were above 75th percentile. Rice yield of HN varietywas the highest following by SY, KDML and MD varieties, respectively. The harvest indexes (HI) were adopted from the above 75th percentile of the yield records and were averaged. The HI ranged from 0.307 to 0.452, higher than the average HI (Table 1) around 0.02. The expected AGW of SY was the highest following by KDML, HN, and MD varieties ranked from 12,438 to 16,344 kg DM.ha-1. The optimized rates of nitrogen were computed by substitution of particular expected AGW to the generated scenarios.
In order to reach the expected AGW, nitrogen fertilizer application of 35.6, 24.3, 16.1, and 22.2 kg N.ha-1 without incorporated green manure were sufficient to supply for rice cultivations of KDML, MD, SY, and HN, respectively. Incorporated green manure could diminished application of nitrogen fertilizer to 14.6, 4.0, 0 and 8.9 kg N.ha-1, which were around 58.9, 83.5 and 90.9% of nitrogen fertilizer needed in the scenarios without incorporated green manure. Nitrogen fertilizer was not required for SY variety under average value of nitrogen from incorporated green manure.
Table 6. Yield and harvest indexes for expected above ground weight (AGW) and optimized rates of nitrogen fertilizer.
|
Rice variety |
|
Average value of yield record from the above 75th percentile by the rice variety |
|
Computed expected AGW (kg DM.ha-1) (1)/(2) |
|
Computed optimized rate of nitrogen fertilizer (kg N.ha-1) |
|||
|
|
Yield (1) (kg DM.ha1) |
|
Harvest index (2) |
|
|
With Ng |
Without Ng |
||
|
KDML (n=10) |
|
5,120.0 |
|
0.349 |
|
14,664.2 |
|
14.6 |
35.6 |
|
MD (n=4) |
|
5,597.5 |
|
0.458 |
|
12,438.9 |
|
4.0 |
24.3 |
|
SY (n=3) |
|
5,030.0 |
|
0.307 |
|
16,344.0 |
|
- |
16.1 |
|
HN (n=4) |
|
5,735.0 |
|
0.452 |
|
14,902.5 |
|
2.0 |
22.2 |
CONCLUSION
The multiple regression model for AGW was gennerated from the heterogenious nitrogen balance from the previous year and various incoporated amoung of green manure and crop residues in the different plots of the production system. Therefore, the mutiple regression model might be used to optimize nitogen application rates for individual plots under the varrying amount of the incoporated materials. The topical optimization of nitrogen application rates were 16.1-35.6 kgN.ha-1 in comparison to 48.75-82.5 kgN.ha-1 of the nationalwide recommendation rates for irrigated and rainfed conditions (Division of Rice Research and Development, 2016). Incoporating green manure minimized nitrogen fertilizer application 58-90% depended on rice varieties. However, coporating cost for green manure was higher compared to applied nitrogen fertilizer (Table 7); but, in several long-term expertiments insisted that incoporating green manure increased soil organice matter and microbial activities which relatively inproved soil nitrogen balance (Tejada et al., 2008; Bhattacharyya et al., 2017).
Table 7. Cost comparion of green manure incorporation and nitrogen fertilizer application.
|
Cost list |
|
With Ng |
|
Without Ng |
||||||
|
|
KDML |
MD |
SY |
HN |
|
KDML |
MD |
SY |
HN |
|
|
Urea fertilizer application cost (Baht.ha-1) (1) |
|
380.9 |
104.3 |
0.0 |
52.2 |
|
928.7 |
633.9 |
420.0 |
579.1 |
|
Sesbania seed (Baht.ha-1) |
|
675 |
|
-
|
||||||
|
Incorporating cost (Baht.ha-1) |
|
3,750 |
|
- |
||||||
|
Total (Baht.ha-1) |
|
4,805.9 |
4,529.3 |
4,425.0 |
4,477.2 |
|
928.7 |
633.9 |
420.0 |
579.1 |
Note: (1) optimized rate of nitrogen fertilizer x 26.08 Baht/kg N, 50 kg of urea was 600 Baht.
The effect of the selected variables of the previous crop residues on the AGW under stepwised procedure disappeared from the gennerated model. However, in meta anlysis from the literature reviews illustrated that crop residue retention increased rice yield about 5% and reduced nitrogen fertilizer application around 29% (Huang et al., 2013). For the further commitment, the relational structure in the tailored farm-plot database requires participatory development to serve for other aspects of farming system analysis. Online accessibility needs improvement through open application for the responsible expertises to edit, browse and employ database in order to monitor farm operation.
ACKNOWLEDGMENTS
The authors would like to thank Prof. Dr. Attachai Jintrawet for his advice in writing guideline for this paper and Mr. Tewin Keawmuangmoon for his suggestion to correct the database structure. The authors thanks to the Center for Agricuture Resource System Research, Faculty of Agriculture, Chiang Mai University for providing field staffs and facilitation for this study.
REFERENCES
Ali, A.M., Thind, H.S., Sandeep, S., and Singh, Y. 2015. Site-specific nitrogen management in dry direct-seeded rice using chlorophyll meter and leaf colour chart. Pedoshere. 25(1): 72-81. https://doi.org/10.1016/S1002-0160(14)60077-1
Ata-Ul-Karim, S.T., Liu, X., Lu, Z., Zheng, H., Cao, W. and Zhu, Y. 2017. Estimate of nitrogen fertilizer requirement for rice crop using critical nitrogen dilution curve. Field Crop Research. 201: 32-40. https://doi.org/10.1016j.fcr.2016.10.009
Bappa, D.A.S., Chakraborty, D., Singh, V. K., Ahmed, M., Singh, A. K., and Barman, A. 2016. Evaluating fertilization effects on soil physical properties using a soil quality index in an intensive rice-wheat cropping system. Pedosphere. 26(6): 887-894. https://doi.org/10.1016/S1002-0160(15)60093-5
Barnwal, P., and Kotani, K. 2013. Climatics impacts across agricultural crop yield distribution: An application of quantile regression on rice crop in Andhra Pradesh, India. Ecological Economics. 87: 95-109. https://doi.org/10.10.1016/j.ecolecon.2012.11.024
Bhattacharyya, P., Roy, K.S., Nayak, A.K., Shahid, M., Lal, B., Gautam, P., and Mohapatra, T. 2017. Metagenomic assessment of methane production- oxidation and nitrogen metabolism of long term manured systems in lowland rice paddy. Science of the Total Environment. 586: 1245-1253. https://doi.org/10.1016/j.scitotenv.2017.02.120
Birt, A.G., Calixto, A., Tchakerian, M., Dean, A., Coulson, R.N., and Harris, M.K. 2012. Harnessing information technology for use in production agriculture. Journal of Integrated Pest Management. 3(1): 1-8.
Carmen, M.L. 1968. Yield of rice as affected by fertilizer rates, soil and meteorological factors [dissertation] Iowa: Iowa State University.
Conway, G.R. 1985. Agricultural ecology and farming system research. Richmond, N.S.W., Australia. p. 43-59. In: Remenyi, J.V., editor. Proceedings of an International Workshop Held at Hawkesbury Agricultural College. Richmond, 12-15 May 1985. Australian Centre for International Agricultural Research.
Davatgar, N., Neishabouri, M., and Sepaskhah, A. 2012. Delineation of site specific nutrient management zones for a paddy cultivated area based on soil fertility using fuzzy clustering. Geoderma: 173-174: 111-118. https://doi.org/10.1016/j.geoderma.2011.12.005
Division of Rice Research and Development. 2016. Rice Knowledge Bank. [Online] http://www.brrd.in.th/rkb/ accessed Sep,13 2017.
Dobermann, A., and Witt, C. 2004. The evolution of site-specific nutrient management in irrigated rice systems of Asia. p.75-100. In: Dobermann, A., Witt, C., and Dawe, D., editors. Increasing Productivity of intensive rice system through site-specific nutrient management. Internatinal Rice Research Institute, Los Banos, the Philippine.
Dobermann, A., Witt, C., Dawe, D., Abdulrachman, S., Gines, H.C., Nagarajan, R., Satawathananont, S., Son, T.T., Tan, P.S., Wang, G.H., et al. 2002. Site-specific nutrient management for intensive rice croping system in Asia. Field Crop Research. 74: 37-66. https://doi.org/10.1016/S0378-4290(01)00197-6
Esmeijer, J., Bakker, T., Ooms, M., and Kotterink , B. 2015. Data-driven innovation in agriculture: case study for the OECD KBC2-programme. TNO, The Netherlands.
Ginaldi, F., Bindi, M., Dalla Marta, A., Ferrise, R., Orlandini, S., and Danuso, F. 2016. Interoperability of agromic long term experiment database and crop model intercomparison: the Italian experience. European Journal of Agronomy. 77: 209-222. https://doi.org/10.1016/j.eja.2016.02.007
Gliessman, S.R. 1988. The Agroecosystem Concept. p.17-28 In: Gliessman, S.R., Engles, E., and Krieger, R., editors. Agroecology: ecological processes in sustainable agriculture. CRC Press.
Haefele, S., and Konboon, Y. 2009. Nitrogen management for rainfed lowland rice in northeast Thailand. Field Crop Research. 114: 374-385. https://doi.org/10.1016/j.fcr.2009.09.007
Huang, S., Zeng, Y., Wu, J., Shi, Q., and Pan, X. 2013. Effect of crop residue retention on rice yield in China: a meta-analysis. Field Crop Research. 154: 188-194. https://doi.org/10.1016/j.fcr.2013.08.013
Jiménez, D., Dorado, H., Cock, J., Prager, S.D., Delerce, S., Grillon, A., Bejarano, M.A., Benarides, H. and Jarvis, A. 2016. From observation to information: data-driven understanding of on farm yield variation. Plos One. 11(3): 1-20. https://doi.org/10.1371/journal.pone.0150015
Lafitte, H. 1998. Research opportunity to improve nutrient-use efficiency in rice cropping system. Field Crop Research. 56: 223-236. https://doi.org/10.1016/S0378-4290(97)00134-2
Latruffe, L., Desjeux, Y., and Dupraz, P. 2016. Database used for FLINT WP5 activities: descrition and quality assessment. Rennes: INRA.
Linquist, B.A., Liu, L., van Kessel, C., and van Groenigen, K.J. 2013. Enhanced efficiency nitrogen fertilizers for rice system: Meta-analysis of yield and nitrogen uptake. Field Crop Research. 154: 246-254. https://doi.org/10.1016/j.fcr.2013.08.014
Liu, L., Chen, T., Wang, Z., Zhang, H., Yang, J., and Zhang, J. 2013. Combination of site-specific nitrogen management and alternate wetting and drying irrigation increases grain yield and nitrogen and water use efficiency in super rice. Field Crop Research. 154: 226-235. https://doi.org/10.1016/j.fcr.2013.08.016
Ministry of Agriculture and Cooperatives. 2016. คู่มือ การดำเนินงานระบบส่งเสริมการเกษตรแบบแปลงใหญ่. Thailand: Ministry of Agriculture and Cooperatives.
Nagarajan, R., Ramanathan, S., Muthukrishnan, P., Stalin, P., Ravi, V., Babu, M., Selvam, S., Sivanantham, M., Dobermann, A., and Witt, C. 2004. Site-specific nutrient management in irrigated rice systems of Tamil Nadu, India. In: Dobermann, A., Witt, C., and Dawe, D., editors. Increasing Productivity of Intensive Rice System throughsite-specific nutrient management. Los Banos: Internatinal Rice Research Institute.
Niang, A., Becker, M., Ewert, F., Dieng, I., Gaiser, T., Tanaka, A., Senthikumar, K., Rodenburg, J., Johnson, J.-M., Akakpo, C., et al. 2017. Variability and determinants of yield in rice production system of West Africa. Field Crop Research. 207: 1-12. https://doi.org/10.1016/j.fcr.2017.02.014
Rahman, M.S., Huq, Md.M., Sumi, A. Moatafa, M.G., and Azad, M.R. 2005. Statistical analysis of crop-weather regression model for forecasting production impact of aus rice in Bangladesh. International Journal of Statistical Sciences. 4: 57-77.
Rencher, A.C. 2003. Methods of multivariate analysis. John Wiley & Sons.
Thailand Broad of Investment. 2017. Agriculture and biotechnology ready for future growth. Thailand Investment Review. 27(2): 3-4.
Tejada, M., Gonzalez, J., Garcia-Martinez, A., and Parrado, J. 2008. Effects of different green manures on soil biological properties and maize yield. Bioresource Technology. 99: 1758-1767. https://doi.org/10.1016/j.biortech.2007.03.052
Wolfert, S., Ge, L., Verdouw, C., and Bogaardt, M.J. 2017. Big data in smart farming-A review. Agricultural Sysems. 153: 69-80. https://doi.org/10.1016/j.agsy.2017.01.023
Tupthai Norsuwan1*, Kularb Utasuk1, Thakoon Panyasai1, and Chanchai Songchyoswat2
1Center for Agricultural Resource System Research, Faculty of Agriculture, Chiang Mai University, Chiang Mai 50200, Thailand
2Department of Plant Science and Natural Resources, Faculty of Agriculture, Chiang Mai University, Chiang Mai 50200, Thailand
Corresponding author: E-mail: tupthai.n@cmu.ac.th
Total Article Views
Article history:
Received: June 28, 2019
Revised: July 30, 2019
Accepted: July 30, 2019