 ISSN: 2822-0838 Online

Phytochemical Evaluation and Qualitative Analysis as Sweetness Potentially of Selected Thai Plants
Keerati Thamapan, Natta Loahakunjit*, Orapin Kerdchoechuen, Punchira Vongsawasdi, and Withawat MingvanishPublished Date : 2020-05-12
DOI : https://doi.org/10.12982/CMUJNS.2020.0021
Journal Issues : Number 3, July-September 2020
ABSTRACT The objective of this study was to identify the main sweet compounds in nine Thai plants using qualitative (phytochemical test and thin layer chromatography), and quantitative (spectrophotometric) methods. The plant extracts were screened for total saponins, flavonoids and sugars. High Performance Liquid Chromatography-Evaporation Light Scattering Detector (HPLC-ELSD) were used for the identification and characterization of sugars. All plant extracts were provided to demonstrate the use of sensory evaluation. Results indicated that both the water and ethanolic extracts of all selected plants contained saponins, flavonoids, terpenoids and sugars. The water extract of Cha-em Thai had the highest total saponin content. Overall, total flavonoid content was the highest in fruits of Emblica, Yellow Myrobalan and Bastard Myrobalan. The highest total sugar content was found in water Raksamsib extract. Glucose and fructose were present in all plant extracts. Moreover, the sensory evaluation result showed that Cha-em Thai gave the highest sweet score followed by Blady grass and Raksamsib extracts. From the results, it was concluded that extracts of selected Thai plant represent a potential source of sweeteners that might be used in the food and pharmaceutical industries.
Keywords: Sweet compounds, Thai plants, HPLC-ELSD, Sensory evaluation
INTRODUCTION
Non-nutritive sweeteners such as sucralose, aspartame, and acesulfame-K have been increasingly used to substitute sugars (Shankar et al., 2013), notwithstanding inherent disadvantages, such as persistent sweet taste, very objectionable bitter or metallic aftertaste, and the risks of lung and breast tumor, dizziness, and leukemia (Whitehouse et al., 2008). Plant derived artificial sweeteners, including proteins, flavonoids, terpenoids, and saponins are non-saccharides and possess very intense sweetness compared to sugar. Hence, they are used in small amount in foods, beverages and other products. Several protein sweeteners of varying molecular weight (6,473 to 22,206 daltons) have been previously reported, including brazzein, curculin, mabinlin, monelin and thaumatin. Flavonoid sweeteners are divided into two subclasses: dihydrochalcones, and dihydroflavonols together with their glycosides such as glycyphyllin, phlorizin, trilobatin, huangqioside E and neoastilbin (Kim and Kinghorn, 2002). Four groups of terpenoid sweeteners exist, namely mono-, sesqui-, di- and tri-terpenoids, while tri-terpenoid consists of mogroside, abrusoside, albiziasaponin and glycyrrhizin. Plant derived intensely sweet saponins such as polypodoside A and osladin are increasingly used as sugar substitutes (Kim and Kinghorn, 2002). Sweeteners such as stevioside from stevia leaves, glycyrrhizin from licorice roots and mogroside from luo han kuo fruits are used (Kim and Kinghorn, 2002), though with restriction due to their bitter, astringent and grassy aftertaste, and associated risks of hypertension and pseudoaldosteronism when consumed in excess amount (Ferrari et al., 2001).
Several varieties of plants in Thailand have been used for Thai folk medicine. The sweet-tasting medicinal Thai plants selected for this study were Albizia myriophylla Benth. (Cha-em Thai), Carthamus tinctorius L. (Safflower), Vernonia elliptica DC. (Tan Mon), Ixora ebarbata Craib. (Siamese white Ixora), Imperata cylindrica L. (Blady glass), Asparagus racemosus Willd. (Raksamsib), Phyllanthus emblica L. (Emblica), Terminalia chebula Retz. (Yellow myrobalan), and Terminalia bellirica Roxb. (Bastard myrobalan). Some of them have been shown in ancient classical Ayurvedic literature, including A. racemosus, P. emblica, T. chebula, and T. bellirica, and some of their bioactive compounds have been reported.
A. myriophylla contains oleanane-type triterpene saponins, namely albiziasaponin A-E, licorice-saponin F3 and yunganoside B1 (Yoshikawa et al., 2002). Kaempferol 3-sophoroside 1, quercetin 3-rutinoside, kaempferol 3-rutinoside, C-glucosylquinochalcone, cartomin 4, and saffloquinoside A and B have been isolated from C. tinctorius (Jiang et al., 2010). Chauhan et al. (1984) reported that the root of I. arborea has flavone glycoside, and chrism 5-O-β-D-xylopyranoside. I. cylindrica contains impecylone, deacetylimpecyloside, impecyloside, impecyenoide, seguinoside K, and seguinoside K 4-methylether (Liu et al., 2014). The extract of A. racemosus comprises of bioactive compounds such as shatavarin, sarsasapogenin, racemosol, asparagamine and fructo-oligosaccharide (Thakur et al., 2012). Anila and Vijayalakshmi (2002) isolated tannin, mucic acid and vitamin C from Phyllanthus emblica. Terminalia chebula contains 3,4,6-tri-O-galloyl-D-glucose, chebulic acid, β-punicalagin, corilagin, α-punicalagin, chebulagic acid, gallic acid, 1,3,4,6-tri-O-galloyl-β-D-glucose, chebulinic acid, 1,2,3,4,6-penta-O-galloyl-D-glucose, ellagic acid, and 1,6-di-O-galloyl- D-glucose (Pellati et al., 2013). T. bellirica contains gallic acid, ellagic acid, arjungenin and bellericoside (Nandy et al., 1989). The bioactive compounds of V. elliptica have never been reported, but V. amygdalina contains two sesquiterpene lactones, namely vernolide and vernodalol (Erasto et al., 2006). However, compounds responsible for the taste properties of the medicinal plants selected for this study are relatively unknown except for albiziasaponin B, the sweet compound isolated from A. myriophylla, which is about 600 times sweeter than sucrose (Yoshikawa et al., 2002). Although roots of Raksamsib and blady grass have long been known to contain bitter-sweet tastes, there is limited knowledge on the responsible compounds (Alok et al., 2013). Furthermore, fruits of emblica, yellow myrobalan and bastard myrobalan have been reported in Ayurvedic literature to possess sour (amla), astringent (kashaya), bitter (tikta), pungent (katu) and sweet (madhura) tastes (Baliga, 2012).
The present research was thus motivated by the need to identify and characterize new sweet compounds of natural origin. Therefore, the objectives of this research were to screen selected plants for group of sweet compounds, including flavonoids, terpenoids, saponins and sugars, deploying qualitative analytical methods such as phytochemical test and thin layer chromatography (TLC), and quantitative analysis by spectrophotometric method. Sugar composition and contents were identified by HPLC-ELSD. Moreover, sensory evaluation was used to evaluate the taste properties of selected plant extracts.
MATERIALS AND METHODS
Materials and Chemicals
Ethnolamine diphenylborinate, anisaldehyde, vanillin, orcinol, cathechin, rutin and escin were purchased from Sigma-Aldrich Chemical Co. (Singapore). All the other chemicals and sugar standard compounds used were of analytical grade or HPLC grade.
All nine dried Thai plant materials, including stem of A. myriophylla Benth., flower of C. tinctorius L., leaves of V. elliptica DC., root of I. ebarbata Craib., root of I. cylindrica L., root of A. racemosus Willd., fruit of P. emblica L., fruit of T. chebula Retz., and fruit of T. bellirica Roxb., were purchased from local market in Bangkok, Thailand, and were stored at room temperature for further analysis. Plant species were identified by their morphological species compared to taxonomic literature, namely “Thai Plant Names” (Smitinand, 2014).
Sample preparation
The nine Thai plant samples (10 g) were pulverized and sieved through a 40-mesh screen. Powdered samples were used for proximate analysis and compound extraction.
Proximate composition
The powdered samples were analyzed for moisture, ash, protein, lipid, fiber and carbohydrate by the method of AOAC (2000). The conversion factor of 6.25 was used to determine the protein content. Carbohydrate content was determined by the following equation:
% carbohydrate(dry weigh)= 100 – (%protein + %lipid + %ash + %fiber) (1)
Preparation of Thai plant extracts
Compounds were extracted from the pulverized samples (10 g) using distilled water (100 mL) at 80ºC, and was compared with extraction using 95% ethanol (100 mL) at room temperature for 24 h. The extracts were filtered through Whatman No.1 filter paper and solvents were removed under vacuum by rotary evaporator (Buchi, Germany) at 40ºC. Yield percentage of extracts was calculated following equation:
% yield = (weight of crude extract/weight of dried sample) × 100 (2)
Qualitative and quantitative analysis of sweet compounds of extracts
The extracts were analyzed for group of sweet compounds such as flavonoids, saponins, terpenoids and sugars (glycosides) by phytochemical tests, thin layer chromatography and spectrophotometric method. All crude extracts were weighed (10 mg) and dissolved in the same solvent as using for extraction before analysis.
Qualitative analysis by phytochemical test. The water and ethanolic extracts were screened for flavonoids, saponins, terpenoids and glycosides by sodium hydroxide test (Bello, 2011), Foam’s test (Webb, 1955), Salkowski test (Sharma et al., 2012), and glycosides test (Harborne, 1998), respectively.
Flavonoid detection was carried out by adding distilled water to 0.5 mL extract in order to obtain a 2 mL mixture which was subsequently warmed up, and filtered. Afterwards, 10% aqueous sodium hydroxide was added to the mixture. A change in color from yellow to colorless on addition of dilute hydrochloric acid was an indication of the presence of flavonoids. For saponin identification, distilled water was added to 0.5 mL extract, and the mixture filled to 20 mL final volume. The suspension was shaken in a graduated cylinder for 15 min. Appearance of a layer of foam indicated the presence of saponin. In order to ascertain the presence of terpenoids, 0.5 mL extract was mixed with 2 mL chloroform, and 3 mL of concentrated sulfuric acid was carefully added to the mixture which forms a layer. A reddish brown coloration of the interface was indicative of the presence of terpenoids. Glycosides and sugars were determined by dissolving 0.5 mL extract in 5 mL methanol. Ten mL of 50% of hydrochloric acid was added to 2 mL methanolic extract in test tube. The mixture was heated in boiling water bath for 30 minutes. Afterwards, 5 mL of Fehling’s solution was added to the mixture, and then it was boiled for 5 minute. A brick red precipitate was indication of the presence of glycosides.
Qualitative analysis by thin layer chromatography (TLC). Water and ethanolic extracts were characterized by TLC to identify major sweet compounds such as flavonoids, saponins, terpenoids and sugars. Standard markers, including rutin, escin, stevioside and some mono-and disaccharide sugars were co-chromatographed for flavonoids, saponins, terpenoids and sugars, respectively.
Flavonoid compounds of the extracts were identified by TLC (silica gel 60 F254, 20 cm×20 cm) using rutin as standard, with ethyl acetate: formic acid: acetic acid: water (100:11:11:27, v/v/v/v) as mobile phase. The spots were visualized by spraying with ethanolamine diphenylborate (NEU reagent), and detected at 366 nm (Medic-Saric et al., 2008). Saponins were identified using escin as standard, and chloroform : methanol : water (14:6:1, v/v/v) as mobile phase. For visualization, samples were sprayed with anisaldehyde sulfuric (Dinan et al., 2001). Terpenoids were identified using stevioside as standard, and ethyl acetate: acetic acid: water (8:3:2, v/v/v) as mobile phase. They were sprayed with vanillin-sulfuric to develop color spots (Hajnos, 2008). Sugar identification was performed using ethyl acetate : 2-propanol : acetic acid : water (4:2:2:2, v/v/v/v) as the mobile phase and sprayed with orcinol-sulfuric for visualization (Sassaki et al., 2008).
Quantitative analysis by spectrophotometric method
Sweet compounds of the water and ethanolic extracts were quantified as total flavonoids (Dini, 2011), total saponins (Hiai et al., 1976) and total sugar (DuBois et al., 1956) by spectrophotometric method.
Total flavonoid content. Total flavonoids were determined using spectrophotometric assay developed by Dini (2011). Extracts (0.5 mL) and cathechin standard (20 – 100 mg/L) were mixed in test tube with 2 mL of distilled water, and then, 5% of sodium nitrite (0.15 mL) was added to test tube. After 5 min, 10% of aluminium chloride (0.15 mL) was added to the mixture. At 6 min, 1 M of sodium hydroxide (1 mL), and distilled water (1.2 mL) were added and the mixture was thoroughly mixed. The absorbance of the mixture was measured against a blank at 510 nm. The total flavonoids of the extracts were expressed as mg catechin equivalent (CE)/g dry weight of plant.
Total saponin content. Total saponin content of each extract was determined using the method described by Hiai et al. (1976). The extract (0.25 mL) was mixed with vanillin (8% w/v, 0.25 mL) and sulfuric acid (72% w/v, 2.5 mL). The mixture was incubated at 60°C for 10 min and cooled in an ice bath for 15 min. Absorbance was measured at 560 nm using escin as reference standard. The total saponin content was expressed as escin equivalent (EE, mg/g extract).
Total sugar content. Total sugar content was determined based on colorimetric method (Dubois et al., 1956). The extract (1 mL) was mixed with 5% phenol (1 mL), and 5 mL of concentrated sulfuric acid was added. The reaction mixture was incubated at room temperature for 20 minutes, and the absorbance was measured at 490 nm with glucose as standard. The total sugar content was expressed as mg glucose/g dry weight of plant (mg/g DW).
Sugar composition analysis
The water extracts of nine Thai plants were determined sugar composition using High Performance Liquid Chromatography-Evaporating Light Scattering Detector (HPLC-ESLD) method with some modification (Jovanovic-Malinovska et al., 2015) Briefly, HPLC analysis was performed on an Agilent system equipped with 1200 series quaternary gradient pump and 1260 infinity evaporative light scattering detector. The water samples and standards were filtered through 0.45 µm (Millipore) filters. Separation was achieved on Zorbax-carbohydrate column (250 mm × 4.6 mm ID, 5 µm particle size) from Agilent (Palo Alto, CA, USA). The mobile phase consisted of acetonitrile: water (75:25, v/v) in isocratic elution with flow rate of 1.4 mL/min for 30 min. The column temperature was kept at 30°C, the drift tube and evaporator temperatures for ELSD were set at 50°C each, and the nebulizing gas (N2) flow rate was 2.0 standard liter per minute (SLM). Quantification of sugar was based on external calibration, and sugar content was expressed as mg/g sample.
Organoleptic testing
Sensory profiling was performed on the extracts to establish the presence or absence of sweetness. Quantitative descriptive analysis was applied for sensory evaluation. The sensory evaluation was conducted by 15 semi-trained panelists (3 males and 12 females) aged 23 to 30 years old. The intensity of each attribute was scored on a scale of 0 to 5 and panelists were trained on how to conduct ranking test prior to actual sensory evaluation. For the first training session, 1, 2, 5, 10% sucrose concentrations (10 mL) were chosen (Meilgaard et al., 2006), whereas 0.5, 1, 2 and 3% sucrose were used for the second training session. The taste attributes included sweet, sour, bitter, licorice, metallic, long lasting aftertaste, pleasant aftertaste and overall acceptance. Sucrose (6% w/v), caffeine (0.2% w/v) and citric acid (0.2% w/v) were used as standard for sweet, bitter and sour taste, respectively. Samples (1 mL) were dissolved in warm distilled water (5 mL) and served in opaque disposable plastic cups. Panelists rinsed their mouths with distilled water before the sensory evaluation of each individual sample.
Statistical analysis
All assays were conducted in triplicate and analyzed by analysis of variance (ANOVA) and Least Significant Difference (LSD) using Version 9 of the SAS program (SAS Institute Inc., Cary, NC). Sensory analysis was performed based on a Randomized Complete Block Design (RCBD), and significant differences between samples were obtained by ANOVA using the SAS Program.
RESULTS
Proximate composition of nine Thai plants
Percent compositions of the nine Thai plant species are presented in Table 1. Variation in moisture content between species was found. Ash content was high in Tan Mon and Bastard Myrobalan (4.40%) compared to other plant species. The protein content ranged from 2.52% to 11.14%, with safflower accounting for the highest protein content (11.14%), whereas Siamese White Ixora had the lowest protein content (1.98%). Among the plant species, Cha-em Thai, Siamese White Ixora, Tan Mon and Blady grass showed the highest lipid content ranging from 2.41% to 2.84%. Results of the fiber content analysis showed that Siamese White Ixora had the highest fiber content (47.47%), while Raksamsib had the lowest (12.13%). For carbohydrate content, Bastard myrobalan showed the highest value (74.75%), whereas Siamese White Ixora had the lowest values (46.88%).
Table 1. The compositions of nine Thai plants used as natural sweeteners (% dry weight basis).
|
Dried plants |
Plant part |
Ash (%) |
Protein (%) |
Lipid (%) |
Fiber (%) |
Carbohydrate (%) |
|
Cha–em Thai |
stem |
3.10±0.20 |
7.55±0.50 |
2.84±0.90 |
32.13±4.11 |
54.38 |
|
Safflower |
flower |
4.03±0.15 |
11.14±0.48 |
0.65±0.10 |
28.80±2.82 |
55.38 |
|
Tan Mon |
leaf |
4.40±0.26 |
7.00±0.35 |
2.50±0.16 |
29.27±0.31 |
56.83 |
|
Siamese White Ixora |
root |
0.88±0.16 |
1.98±0.28 |
2.79±0.29 |
47.47±2.00 |
46.88 |
|
Blady glass |
root |
2.83±0.31 |
2.64±0.28 |
2.41±0.22 |
26.93±1.20 |
65.19 |
|
Raksamsib |
root |
2.47±0.45 |
6.73±0.76 |
0.91±0.06 |
22.13±0.31 |
67.76 |
|
Emblica |
fruit |
1.63±0.15 |
2.52±0.19 |
0.41±0.19 |
25.67±0.70 |
69.77 |
|
Yellow Myrobalan |
fruit |
3.77±0.32 |
3.91±0.47 |
0.59±0.05 |
24.67±0.42 |
67.06 |
|
Bastard Myrobalan |
fruit |
4.40±0.30 |
4.95±0.30 |
0.63±0.31 |
15.27±0.23 |
74.75 |
Yield percentage of water and ethanolic extracts
Percent yield of extract is one of the parameters used for characterizing phytochemical products. Results of the extraction yields of all nine Thai plants (Table 2) showed that the percent yield of water extracts ranged from 3.33% to 12.01%, of which Tan Mon and Siamese White Ixora had the highest (12.01%) and lowest (3.33%) percent of extraction yields, respectively. In comparison, the highest (10.35%) ethanolic extraction yield was found in Yellow Myrobalan, whereas Safflower had the lowest (1.44%) yield. Overall, yields of water extracts were higher than for ethanolic extracts, except in Blady grass and Yellow myroban.
Table 2. Percentage yield of water and ethanolic extracts of nine Thai plants.
|
Botanical name |
Common Name |
Family |
Plant Part |
% yields (dry weight basis) |
|
|
Water extracts |
Ethanolic extracts |
||||
|
Albizia myriophylla Benth. |
Cha-em Thai |
Leguminosae |
Stem |
9.16b |
3.00f |
|
Carthamus tinctorius L. |
Safflower |
Asteraceae |
Flower |
4.42g |
1.44h |
|
Vernonia elliptica DC. |
Tan Mon |
Compositae |
Leaves |
12.01a |
3.09e |
|
Ixora ebarbata Craib. |
Siamese White Ixora |
Rubiaceae |
Root |
3.33h |
3.01f |
|
Imperata cylindrica L. |
Blady glass |
Poaceae |
Root |
4.80f |
6.09c |
|
Asparagus racemosus Willd. |
Raksamsib |
Asparagaceae |
Root |
6.08d |
3.96d |
|
Phyllanthus emblica L. |
Emblica |
Phyllanthaceae |
Fruit |
5.83e |
2.88g |
|
Terminalia chebula Retz. |
Yellow Myrobalan |
Combretaceae |
Fruit |
5.83e |
10.35a |
|
Terminalia bellirica Roxb. |
Bastard Myrobalan |
Combretaceae |
Fruit |
6.44c |
6.88b |
Note: Extraction yield values are expressed as % of dry plant powders. For each solvent, a,b,c…letter in the same column bearing different letters are significantly different at P ≤ 0.05.
Phytochemical analysis of sweet compounds in Thai plant extracts
Qualitative analysis by biochemical tests and TLC analysis showed the presence of saponins, flavonoids, terpenoids and sugars (glycoside) in all Thai plant extracts (Table 3). The phytochemical compositions of sweet compounds, defined as total flavonoid, total saponin and total sugar, in water and ethanolic extracts of selected plants are shown in Table 4.
Total flavonoid content of each plant extract was determined using catechin standard calibration curve and results ranged from 0.44 to 5.56 mgCE/g DW, and 0.50 to 7.64 mgCE/g DW for the water, and ethanolic extracts, respectively. For the ethanolic extracts, the highest flavonoid content
(7.64 mg CE/gDW) was found in Yellow Myrobalan followed by Bastard myrobalan (7.07 mg CE/gDW), Tan Mon (5.71 mg CE/gDW) and Siamese White Ixora (4.69 mgCE/gDW). For the water extracts, Emblica extract had the highest (5.56 mgCE/g DW), while Raksamsib extract had the lowest flavonoid content (0.44 mgCE/g DW).
Total saponin content in all nine Thai plants ranged from 19.23 to 72.10 mgEE/g DW and 26.57 to 65.87 mgEE/g DW for the water and ethanolic extracts, respectively. The water extract of Cha-em Thai had the highest saponin content (72.10 mgEE/g DW), while the water extract of Yellow Myrobalan had the lowest saponin content (19.23 mgEE/g DW). In comparison, the ethanolic extract of Siamese White Ixora had the highest saponin content (65.87 mgEE/g DW), whereas Emblica had the lowest content (26.57 mgEE/g DW).
Total sugar content of extracts was estimated using the phenol-sulfuric method. The total sugar of ethanolic and water extracts varied from 9.50 to 123.54 mg/g DW, and 37.44 to 304.33 mg/g DW, respectively. The highest sugar content in water extracts was found in Raksamsib (304.33 mg/g DW), whereas the lowest content was found in Siamese White Ixora (37.44 mg/g DW). In comparison, the highest sugar content in ethanolic extracts was found in Bastard myrobalan (123.54 mg/g DW), while the lowest content was found in Cha-em Thai (9.50 mg/g DW).
Table 3. Comparison of phytochemical compositions of nine Thai plants analyzed by biochemical and TLC methods.
|
Dried plants |
Flavonoid |
Saponin |
Terpenoid |
Sugar |
||||||||||||
|
Biochemical test |
TLC |
Biochemical test |
TLC |
Biochemical test |
TLC |
Biochemical test |
TLC |
|||||||||
|
Et |
Aq |
Et |
Aq |
Et |
Aq |
Et |
Aq |
Et |
Aq |
Et |
Aq |
Et |
Aq |
Et |
Aq |
|
|
Cha–em Thai |
+ |
+ |
+ |
+ |
+ |
+ |
+ |
+ |
+ |
+ |
+ |
+ |
+ |
+ |
+ |
+ |
|
Safflower |
+ |
+ |
+ |
+ |
+ |
+ |
+ |
+ |
+ |
+ |
+ |
+ |
+ |
+ |
+ |
+ |
|
Tan Mon |
+ |
+ |
+ |
+ |
+ |
+ |
+ |
+ |
+ |
+ |
+ |
+ |
+ |
+ |
+ |
+ |
|
Siamese White Ixora |
+ |
+ |
+ |
+ |
+ |
+ |
+ |
+ |
+ |
+ |
+ |
+ |
+ |
+ |
+ |
+ |
|
Blady glass |
+ |
+ |
+ |
+ |
+ |
+ |
+ |
+ |
+ |
+ |
+ |
+ |
+ |
+ |
+ |
+ |
|
Raksamsib |
+ |
+ |
+ |
+ |
+ |
+ |
+ |
+ |
+ |
+ |
+ |
+ |
+ |
+ |
+ |
+ |
|
Emblica |
+ |
+ |
+ |
+ |
+ |
+ |
+ |
+ |
+ |
+ |
+ |
+ |
+ |
+ |
+ |
+ |
|
Yellow Myrobalan |
+ |
+ |
+ |
+ |
+ |
+ |
+ |
+ |
+ |
+ |
+ |
+ |
+ |
+ |
+ |
+ |
|
Bastard Myrobalan |
+ |
+ |
+ |
+ |
+ |
+ |
+ |
+ |
+ |
+ |
+ |
+ |
+ |
+ |
+ |
+ |
Note: (+) = Present, (-) = Absent, Et = ethanolic extracts, Aq = water extracts.
Table 4. Sweet compounds of water and ethanolic extracts of nine Thai plants analyzed by spectrophotometric method.
|
Dried plants |
Part used |
Total flavonoids |
Total saponins |
Total sugars |
|||
|
Water |
Ethanol |
Water |
Ethanol |
Water |
Ethanol |
||
|
Cha–em Thai |
stem |
0.92±0.03d |
1.64±0.02f |
72.10±1.00a |
59.57±1.14b |
86.83±2.06g |
9.50±0.23g |
|
Safflower |
flower |
1.50±0.05c |
0.97±0.03h |
59.57±0.59c |
55.43±0.72c |
174.88±3.39c |
58.88±1.32b |
|
Tan Mon |
leaf |
4.04±0.32b |
5.71±0.51c |
35.80±0.47e |
42.37±0.62e |
75.08±2.70h |
15.50±0.50f |
|
Siamese White Ixora |
root |
0.94±0.05d |
4.69±0.29e |
28.93±0.31f |
65.87±1.45a |
37.44±0.85i |
17.48±0.46f |
|
Blady glass |
root |
1.04±0.02c |
1.13±0.02g |
57.70±2.05c |
48.90±0.72d |
211.50±2.17b |
31.71±1.82d |
|
Raksamsib |
root |
0.44±0.01e |
0.50±0.02i |
67.70±1.00b |
30.03±1.77g |
304.33±3.42a |
53.04±1.77c |
|
Emblica |
fruit |
5.56±0.17a |
5.19±0.25d |
21.77±0.42g |
26.57±0.53h |
102.33±0.92f |
24.50±2.50e |
|
Yellow Myrobalan |
fruit |
5.41±0.20a |
7.64±0.31a |
19.23±0.71h |
36.93±1.11f |
148.75±3.08d |
122.71±5.46a |
|
Bastard Myrobalan |
fruit |
4.02±0.41b |
7.07±0.27b |
51.67±0.95d |
31.60±0.52g |
110.83±4.11e |
123.54±4.77a |
Note: Catechin was used as standard for total flavonoid content and expressed in mg catechin equivalent/g of plant dry weight (mgCE/g DW). Escin was used as standard for total saponin content and expressed in mg escin equivalent/g of plant dry weight (mgEE/g DW). Glucose was used as standard for total sugar content and expressed in mg/g of plant dry weight (mg/g DW). Terpenoids were not detected. For each solvent, values in the same column bearing different letters are significantly different at P ≤ 0.05.
Sugar composition analysis of plant extracts by HPLC-ELSD
The composition and contents of sugar from water extracts and standard compounds, including rhamnose, ribose, xylose, arabinose, fructose, glucose, galactose and sucrose were analyzed by HPLC-ELSD as shown in Table 5. Blady grass had the highest fructose, glucose and sucrose contents of 68.23, 80.37, and 155.10 mg/g DW, respectively, whereas Emblica had the least fructose and glucose contents of 14.90 and 11.04 mg/g DW, respectively.
Table 5. Sugar content of nine Thai plant water extracts analyzed by HPLC-ELSD.
|
Dried plants |
Sugar content (mg/g DW of plants) |
Total Sugar |
|||||||
|
Rhamnose |
Ribose |
Xylose |
Arabinose |
Fructose |
Glucose |
Galactose |
Sucrose |
||
|
Cha–em Thai |
1.76 |
- |
- |
- |
22.01 |
21.46 |
13.48 |
11.55 |
70.26 |
|
Safflower |
- |
- |
- |
- |
42.24 |
45.37 |
- |
29.99 |
117.60 |
|
Tan Mon |
- |
2.66 |
2.22 |
3.87 |
37.90 |
35.34 |
- |
- |
72.00 |
|
Siamese White Ixora |
- |
- |
- |
- |
20.62 |
54.77 |
14.95 |
7.56 |
97.90 |
|
Blady glass |
- |
- |
- |
- |
68.23 |
80.37 |
- |
155.10 |
303.70 |
|
Raksamsib |
- |
1.30 |
1.53 |
- |
55.64 |
29.54 |
- |
108.99 |
197.00 |
|
Emblica |
- |
6.05 |
1.53 |
1.79 |
14.90 |
11.04 |
- |
- |
35.31 |
|
Yellow Myrobalan |
- |
5.74 |
- |
- |
58.95 |
71.35 |
- |
15.40 |
151.44 |
|
Bastard Myrobalan |
- |
4.41 |
- |
- |
41.32 |
34.67 |
- |
- |
80.40 |
Note: The results were expressed as mean ± S.D. for 3 replicates and (-) indicates not found.
Sensory profile of Thai plant water extracts
The spider diagram which depicts the sensory attributes of the Thai plant water extracts is shown in Figure 1. Yellow Myrobalan, Bastard Myrobalan and Emblica had strong sour taste (4.7, 4.2 and 4.0, respectively), and some bitter taste (3.2, 3.0 and 1.8, respectively). Cha-em Thai extract had the sweetest taste followed by Blady grass, whereas Raksamsib had the least sweet taste (3.7, 2.3 and 2.2, respectively). Cha-em Thai, Blady grass and Raksamsib had the highest pleasant aftertaste score (3.7, 3.7 and 3.2, respectively) and overall acceptance (3.8, 3.7 and 2.5, respectively). None of the extracts had a metallic taste and only Cha-em Thai extract had licorice taste (3.3).
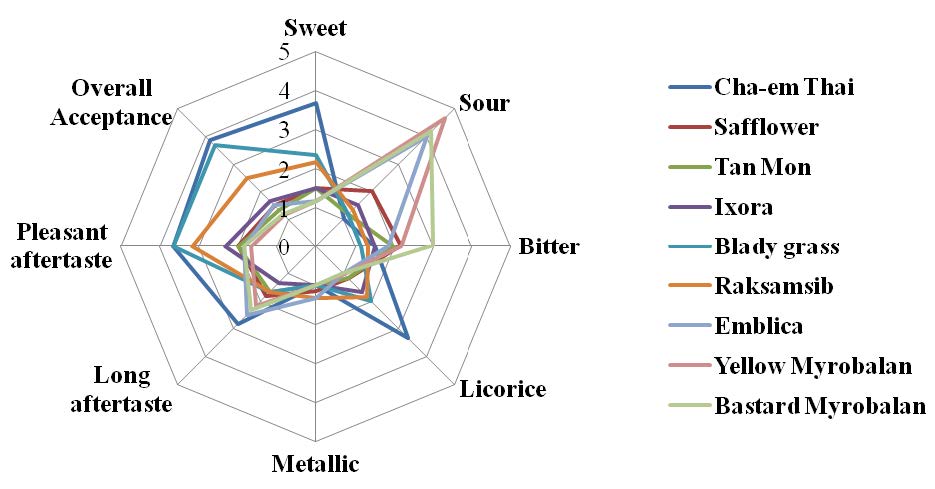
Figure 1. The spider diagram of descriptive sensory analysis on nine Thai plants water extracts.
DISCUSSION
The proximate composition of these Thai plants might be attributed to the soil characteristics and climatic parameters (Guevara-Figueroa et al., 2010). Carbohydrate was the most abundant compounds found in all plants which might be correlated to the sweetness properties in these plants. Statistical analysis for all the extraction yields was significantly different (P≤0.05), which means that there was a significant difference between yields obtained for all solvents. The difference between extraction yields obtained by the different solvents depended on the raw material (Zarnowski and Suzuki, 2004), and the polarity of different compounds present (Hayouni et al., 2007).
Preliminary examination of phytochemical compounds is important for the quantitative estimation and discovery of pharmacologically active chemical compounds. Saponins, flavonoids and terpenoids have been reported to be potent plant secondary metabolites with sweetening properties (Kim and Kinghorn, 2002). Some of flavonoid and saponin compounds have sweet taste which are in glycoside form. However, the sweetness compounds of nine Thai plants in group of flavonoids and saponins are unknown. Both rutin and escin are represent the group of flavonoid and saponin glycosides because the structure of these compounds are similar to the well-known sweetness compounds such as hesperidin dihydrochalcone and glycyrrhizin (Kim and Kinghorn, 2002). Saponins could be absolutely dissolved in water, but partially dissolved in ethanol (Doughari, 2012). Flavonoids and terpenoids could be dissolved in water and ethanol depending on the compound structure (Marston and Hostettmann, 2006). Sugars in plant are generally found in free and glycoside forms, and could be extracted with water and ethanol. Although the phytochemicals detected could be responsible for the sweet characteristics of the plant materials used, information on the pure sweet compounds and their structure is needed to deepen our understanding of them.
Flavonoids could be dissolved in water and ethanol depending on the compound structure. For example, flavonoid glycosides are soluble in both water and alcohol, while some free state flavonoids (e.g., isoflavones, flavonones, methylated flavones, and flavonols) can dissolve in organic solvent (e.g., chloroform, dichloromethane, diethyl ether or ethyl acetate) (Marston and Hostettmann, 2006). Moreover, the results indicated that of the different plant parts used, fruits, especially of Emblica, Yellow myrobalan and Bastard myrobalan, were the richest in flavonoids. Many types of triterpenoid saponins found in Cha-em Thai, only albiziasaponin possesses the sweet compound, Albiziasaponin B (Yoshikawa et al., 2002). Results showed that the water extracts, Cha-em Thai had the highest saponin content compared with other plants, which is expectedly true as saponins are totally water soluble and could only partially dissolve in ethanol depending on their structure (Doughari, 2012).
The sugar content in the water extracts was higher than in ethanolic extracts with the exception of Bastard Myrobalan. The highest sugar content found in Raksamsib water extract is consistent with Thakur et al. (2012), which found a high fructo-oligosaccharide sugar content (26.7%) in roots of Raksamsib. Furthermore, total sugar content could be used to estimate the potential of plants as sweetening agents. Hussain et al. (1990) suggested that concentration levels of sugars in a given plant part should be well over 5% dry weight (over 50 mg/g dry weight) in order to impart a potent sweet sensation. All water extracts of selected plants had over 50 mg/g dry weight total sugar content, with the exception of Siamese White Ixora. Therefore, it could be suggested that Thai plants used in this study are potential natural sweeteners. Moreover, both the quantitative and qualitative results revealed that phytochemicals including saponins, flavonoids and sugars were found in all nine plants.
For sugar analysis, the results showed that water extracts contained total sugar content higher than ethanolic extracts determined by spectrophotometric method. Therefore, water extracts were selected to identify sugar composition using HPLC-ELSD, which HPLC-ELSD method could expressed both of qualitative and quantitative of sugars. Although spectrophotometric method is normally used for determined total sugars, the sensitivity of spectrophotometry for glucose analysis is low (27 µg/L)(Galant et al., 2015). HPLC-ELSD had higher sensitivity than spectrophotometric method (0.37 µg/L)(Masuko et al., 2005). Glucose and fructose were presented in all water extracts. Raksamsib had fructose, glucose and sucrose, which indicates that these sugars might be components of fructo-oligosaccharide (FOS) which is responsible its mild sweet taste (Thakur et al., 2012). Rhamnose and glucose, which found in Cha-em Thai, are in form of sugar moiety, glycone, are components of oleanane-type triterpene saponins in Cha-em Thai named Albiziasaponin (Yoshikawa et al., 2002). Overall, root extracts showed higher content of fructose, glucose and sucrose than extracts from other part of plants (stem, flower, leaf and fruit).
Comparison of the HPLC-ELSD and TLC sugar profile results showed that glucose and fructose were found in all plants. Rhamnose was only found in stem of Cha-em Thai, ribose and xylose were found in Tan Mon leaf, Emblica fruit and Raksamsib root. Arabinose was also found in Tan Mon leaf and Emblica fruit. However, some sugars such as ribose, xylose and arabinose were not found in TLC because of the low sensitivity and accuracy of TLC method compared to HPLC-ELSD (Wang and Fang, 2004).
Comparison of quantitative analysis results showed that the saponin content of Cha-em Thai, Raksamsib and Blady grass was related to the sweet, pleasant aftertaste, and overall acceptance score. The highest sweet, pleasant aftertaste, and overall acceptance scores were found in Cha-em Thai, Raksamsib, and Blady grass, respectively. However, the sensory score and the sugar content were not related because the highest sweet score was found in Cha-em Thai, even though this plant had low sugar content. Blady grass and Raksamsib had high sugar content, but received low sweet score. These results suggest that sugar compounds are not primarily responsible for the sweet properties of these plants.
Strong sour taste of Yellow Myrobalan, Bastard Myrobalan and Emblica due to high vitamin C content and polyphenol compounds in these plants (Anila and Vijayalakshmi, 2002; Pellati et al., 2013; Nandy et al., 1989). The sweet taste, licorice-like taste and long aftertaste in Cha-em Thai is due to the presence of Albiziasaponin B (Yoshikawa et al., 2002), which is about 600 times sweeter than sucrose. Thakur et al. (2012) reported that the sweet taste of Raksamsib extracts might be due to the taste of fructo-oligosaccharides.
CONCLUSION
The phytochemical contents of sweet compounds including saponins, flavonoids, terpenoids and sugars, which could be in glycoside form were found in nine Thai plant extracts at different concentrations. Sensory attributes of the plant extracts were analyzed by semi-trained sensory panelists and results showed that Cha-em Thai had the highest sweet and licorice-like taste scores. Blady grass and Raksamsib extracts gave mild sweet, and high overall acceptance scores.
Cha-em Thai could potentially be used as sweetener and it had the highest saponin content, in addition to the highest sweet, licorice-like, and overall acceptance taste scores. In addition, Blady grass and Raksamsib have high saponin, and sugar contents, and a high sweet and overall acceptance taste scores, which makes them potential sweetening agents. Thus, it can propose for further studies on the potential use of Cha-em Thai, Blady grass and Raksamsib for the development of new sweet compounds. However, the objective in this study was try to screen the group of sweetness unknown compounds due to natural sweetness compounds in Thai plant has not been identified. For flavonoid and saponin compounds identification by HPLC-ELSD, many standard compounds are needed to use as references. Therefore, the further study will identify the individual sweetness compounds by LC-MS-MS. Research is currently underway to isolate, identify, characterize and elucidate the structure of the individual active compounds responsible for sweet taste and their potential use in the food and pharmaceutical industries.
ACKNOWLEDGEMENTS
This work is financially supported by Thailand Research Fund through the Royal Golden Jubilee Ph.D Program (Grant No. PHD/0073/2554), King Mongkut’s University of Technology Thonburi (KMUTT), Bangkok, Thailand.
REFERENCES
Alok, S., Jain, S.K., Verma, A., Kumar, M., Mahor A., and Sabharwal, M. 2013. Plant profile, phytochemistry and pharmacology of Asparagus racemosus (Shatavari): A review. Asian Pacific Journal of Tropical Disease. 3(3): 242-251. https://doi.org/10.1016/S2222-1808(13)60049-3
Anila, L., and Vijayalakshmi, N.R. 2002. Flavonoids from Emblica officinalis and Mangifera indica—effectiveness for dyslipidemia. Journal of Ethnopharmacology. 79(1): 81-87. https://doi.org/10.1016/S0378-8741(01)00361-0
AOAC. 2000. Association of Official Analytical Chemists. 14th ed. Washington D.C.
Baliga, M.S., Meera, S., Mathai, B., Rai, M.P., Pawar, V., and Palatty, P.L. 2012. Scientific validation of the ethnomedicinal properties of the Ayurvedic drug Triphala: A review. Chinese Journal of Integrative Medicine 18(12): 946-954. https://doi.org/10.1007/s11655-012-1299-x
Bello, I.A., Ndukwe, G.I., Audu, O.T., and Habila, J.D. 2011. A bioactive flavonoid from Pavetta crassipes K. Schum. Organic and Medicinal Chemistry Letters. 1(1): 14-14. https://doi.org/10.1186/2191-2858-1-14
Chauhan, J., Kumar, S., and Chaturvedi, R. 1984. A flavone glycoside from the stem of Ixora arborea. Phytochemistry. 23(10): 2404-2405. https://doi.org/10.1016/S0031-9422(00)80572-5
Dinan, L., Harmatha, J., and Lafont, R. 2001. Chromatographic procedures for the isolation of plant steroids. Journal of Chromatography A. 935(1): 105-123. https://doi.org/10.1016/S0021-9673(01)00992-X
Dini, I. 2011. Flavonoid glycosides from Pouteria obovata (R. Br.) fruit flour. Food Chemistry. 124(3): 884-888. https://doi.org/10.1016/j.foodchem.
2010.07.013
Doughari, J.H. 2012. Phytochemicals: extraction methods, basic structures and mode of action as potential chemotherapeutic agents, Phytochemicals-A global perspective of their role in nutrition and health. London: InTech.
Dubois, M., Gilles, K.A., Hamilton, J.K., Rebers, P., and Smith, F. 1956. Colorimetric method for determination of sugars and related substances. Analytical Chemistry. 28(3): 350-356. https://doi.org/10.1021/ac60111a
017
Erasto, P., Grierson, D., and Afolayan, A. 2006. Bioactive sesquiterpene lactones from the leaves of Vernonia amygdalina. Journal of Ethnopharmacology. 106(1): 117-120. https://doi.org/10.1016/j.jep.2005.12.016
Ferrari, P., Sansonnens, A., Dick, B., and Frey, F.J. 2001. In vivo 11β-HSD-2 activity: variability, salt-sensitivity, and effect of licorice. Hypertension. 38: 1330-1336. https://doi.org/10.1161/hy1101.096112
Galant, A.L., Kaufman, R.C., and Wilson, J.D. 2015. Glucose: detection and analysis. Food Chemistry. 188: 149-160. https://doi.org/10.1016/j.foodchem.2015.04.071
Guevara-Figueroa, T., Jiménez-Islas, H., Reyes-Escogido, M.L., Mortensen, A.G., Laursen, B.B., Lin, L-W., De León-Rodríguez, A., Fomsgaard, I.S., and Barba de la Rosa, A.P. 2010. Proximate composition, phenolic acids, and flavonoids characterization of commercial and wild nopal (Opuntia spp.). Journal of Food Composition and Analysis. 23(6): 525-532. https:// doi.org/10.1016/j.jfca.2009.12.003
Hajnos, L.M. 2008. TLC of Diterpenes. In: Waksmundzka-Hajnos M., Sherma J., and Kowalska T., editors. Thin layer chromatography in phytochemistry. Florida: CRC Press. p. 481-511.
Harborne, A.J. 1998. Phytochemical methods a guide to modern techniques of plant analysis. Netherlands: Springer.
Hayouni, E.A., Abedrabba, M., Bouix, M., and Hamdi, M. 2007. The effects of solvents and extraction method on the phenolic contents and biological activities in vitro of Tunisian Quercus coccifera L. and Juniperus phoenicea L. fruit extracts. Food Chemistry. 105(3): 1126-1134. https://doi.org/10.1016/j.foodchem.2007.02.010
Hiai, S., Oura, H., and Nakajima, T. 1976. Color reaction of some sapogenins and saponins with vanillin and sulfuric acid. Planta Medica. 29(02): 116-122. https://doi.org/10.1055/s-0028-1097639
Hussain, R.A., Lin, Y-M., Poveda, L.J., Bordas, E., Chung, B.S., Pezzuto, J.M., Soejabto, D.D., and Kinghorn, A.D. 1990. Plant-derived sweetening agents: saccharide and polyol constituents of some sweet-tasting plants. Journal of Ethnopharmacology. 28(1): 103-115. https://doi.org/10.1016/0378-8741(90)90067-4
Jiang, J.S., He, J., Feng, Z.M., and Zhang, P.C. 2010. Two new quinochalcones from the florets of Carthamus tinctorius. Organic Letters. 12(6): 1196-1199. https://doi.org/10.1021/ol902971w
Jovanovic-Malinovska, R., Kuzmanova, S., and Winkelhausen, E. 2015. Application of ultrasound for enhanced extraction of prebiotic oligosaccharides from selected fruits and vegetables. Ultrasonics Sonochemistry. 22(0): 446-453. https://doi.org/10.1016/j.ultsonch.2014.07.016
Kim, N.C., and Kinghorn, A.D. 2002. Highly sweet compounds of plant origin. Archives of Pharmacal Research. 25(6): 725-746. https://doi.org/10.1007/bf02976987
Liu, X., Zhang, B.F., Yang, L., Chou, G.X., and Wang, Z.T. 2014. Four new compounds from Imperata cylindrica. Journal of Natural Medicines. 68(2): 295-301. https://doi.org/10.1007/s11418-013-0793-9
Marston, A., and Hostettmann, K. 2006. Separation and quantification of flavonoids. In: Anderson, O.M., and Markham, K.R., editors. Flavonoids: chemistry, biochemistry and applications. Florida: CRC Press. p. 1-36.
Masuko, T., Minami, A., Iwasaki, N., Majima, T., Nishimura, S.-I. and Lee, Y.C. 2005. Carbohydrate analysis by a phenol–sulfuric acid method in microplate format. Analytical Biochemistry. 339(1): 69-72. https://doi.org/10.1016/j.ab.2004.12.001
Medic-Saric, M., Jasprica, I., Mornar, A., and Males, Z. 2008. Application of TLC in the isolation and analysis of flavonoids. In: Waksmundzka-Hajnos M., Sherma J., and Kowalska T., editors. Thin layer chromatography in phytochemistry. Florida: CRC Press. p. 405-420.
Meilgaard, M.C., Carr, B.T., and Civille, G.V. 2006. Sensory evaluation techniques. 3rd ed. Florida: CRC press.
Nandy, A.K., Podder,G., Sahu, N.P., and Mahato, S.B. 1989. Triterpenoids and their glucosides from Terminalia bellerica. Phytochemistry. 28(10): 2769-2772. https://doi.org/10.1016/S0031-9422(00)98085-3
Pellati, F., Bruni, R., Righi, D., Grandini, A., Tognolini, M., Pio Prencipe, F., Poli, F., Benvenuti, S., Del Rio, D., and Rossi, D. 2013. Metabolite profiling of polyphenols in a Terminalia chebula Retzius ayurvedic decoction and evaluation of its chemopreventive activity. Journal of Ethnopharmacology. 147(2): 277-285. https://doi.org/10.1016/j.jep.2013.02.025
Sassaki, L.G., de Souza, M.L., Cipriani, R.T., and Iacomini, M. 2008. TLC of Carbohydrates. In: Waksmundzka-Hajnos M., Sherma J., and Kowalska T., editors. Thin layer chromatography in phytochemistry. Florida: CRC Press. p. 256-274.
Shankar, P., Ahuja, S., and Sriram, K. 2013. Non-nutritive sweeteners: review and update. Nutrition. 29(11): 1293-1299. https://doi.org/10.1016/j.nut.2013.03.024
Sharma, A.K., Gangwar, M., Tilak, R., Nath, G., Sinha, A.S.K., Tripathi, Y.B., and Kumar, D. 2012. Comparative in vitro antimicrobial and phytochemical evaluation of methanolic extract of root, stem and leaf of Jatropha curcas Linn. Pharmacognosy Journal. 4(30): 34-40. https:// doi.org/10.5530/pj.2012.30.7
Smitinand, T. 2014. Thai plant names. revised edition. Bangkok.
Thakur, M., Connellan, P., Deseo, M.A., Morris, C., Praznik,W., Loeppert, R., and Dixit, V.K. 2012. Characterization and in vitro immunomodulatory screening of fructo-oligosaccharides of Asparagus racemosus Willd. International Journal of Biological Macromolecules. 50(1): 77-81. https://doi.org/10.1016/j.ijbiomac.2011.09.027
Wang, Q., and Fang, Y. 2004. Analysis of sugars in traditional Chinese drugs. Journal of Chromatography B. 812(1–2): 309-324. https://doi.org/10.1016/j.jchromb.2004.09.027
Webb, L. 1955. A preliminary phytochemical survey of Papua-New Guinea. Pacific Science. 9(4): 430-441. http://hdl.handle.net/10125/8910
Whitehouse, C.R., Boullata, J., and McCauley, L.A. 2008. The potential toxicity of artificial sweeteners. Official Journal of American Association of Occupational Heath Nurses. 56(6): 251-9; quiz 260-1. https://doi.org/10.3928/08910162-20080601-02
Yoshikawa, M., Morikawa, T., Nakano, K., Pongpiriyadacha, Y., Murakami, T., and Matsuda, H. 2002. Characterization of new sweet triterpene saponins from Albizia myriophylla. Journal of Natural Products. 65(11): 1638-1642. https://doi.org/10.1021/np020220l
Zarnowski, R., and Suzuki, Y. 2004. Expedient Soxhlet extraction of resorcinolic lipids from wheat grains. Journal of Food Composition and Analysis. 17(5): 649-663. https://doi.org/10.1016/j.jfca.2003.09.007
Keerati Thamapan1, Natta Laohakunjit1*, Orapin Kerdchoechuen1, Punchira Vongsawasdi2, and Withawat Mingvanish3
1Division of Biochemical Technology, School of Bioresources and Technology, King Mongkut’s University of Technology Thonburi, Bangkok 10140, Thailand
2Department of Microbiology, Faculty of Science, King Mongkut’s University of Technology Thonburi, Bangkok 10140, Thailand
3Department of Chemistry, Faculty of Science, King Mongkut’s University of Technology Thonburi, Bangkok 10140, Thailand
*Corresponding author. E-mail: nutta.lao@kmutt.ac.th
Total Article Views
Article history:
Received: December 7, 2018
Revised: March 2, 2019
Accepted: April 24, 2019