 ISSN: 2822-0838 Online

Metabolomics and Biological activities of Chlorella vulgaris grown under modified growth medium (BG11) composition
Eman A. El-fayoumy, Sanaa M. M. Shanab, and Emad A. Shalaby*Published Date : 2019-12-09
DOI : https://doi.org/10.12982/CMUJNS.2020.0007
Journal Issues : Number 1, January-March 2020
ABSTRACT The aim of this work was to determine the biochemical compounds and evaluate the biological activities of Chlorella vulgaris cultivated under a biotic stress condition (various Zinc and Cupper conc.). The growth rate was recorded as well as determination of active compounds, pigments and defense enzymes, in addition to the biological activities as antioxidant, antimicrobial and anticancer. The obtained results revealed that, higher copper concentrations [0.632 mg /L (Cu)] showed an inhibitory effect to growth while 1.76 mg /L (Zn) enhanced growth which reached its maximum at 25th day of cultivation. Furthermore, combination of 0.88mg/L (Zn) and 0.316mg /L (Cu) induced an increase in growth rate, catalase, tannins, lipid peroxidation and glutathione-S-transferase and a decrease in flavonoids, phenolic content, protein and antioxidant activity. Also, the results of antioxidant activity showed that, elevation of Zn conc. induced an augmentation of antioxidant activity either by DPPH(2, 2 diphenyl-1-picrylhydrazyl) or ABTS (2, 2’- azino-bis ethylbenzthiazoline-6-sulfonic acid), with maximum activity at 0.88 mg/L Zinc conc. (89.91%) even exceeded those of control (85.62%). While more elevated Zn conc. (1.76 mg/L) induced lower activity when compared with synthetic antioxidant standard (Butylated hydroxyl toluene, BHT). Concerning antimicrobial activity, Gram +ve bacteria, Staphylococcus aureus recorded moderate activity in sulfur-contained extract. Cytotoxicity of three cancer cell lines was inversely proportional to extracts conc. used, where the higher conc. (500µg/ml) showed the lowest cell viability of the tested cell lines which ranged from 22.06 to 69.89%. 0.316 mg/L (Cu) of conc. 500 µg/ml recorded the lowest cell viability of (32.166 %) in breast cell line , (22.06%) in colon cell line, and 27.18 06%) in cervical cell line.
Keywords: Chlorella vulgaris, Chemical compositions, Anticancer, Antioxidant Antimicrobial, Defense enzymes
INTRODUCTION
Microalgae include unicellular, simple, primitive, and photosynthetic organisms and are considered a potentially valuable and new source of different biologically active molecules for applications in various fields such as food industry, agriculture, pharmaceutical, nutraceutical, and cosmetic sectors (Shalaby, 2011; Shanab et al., 2012; Shalaby and Dubey, 2018). Chlorella sp. is a microalga that potential by used for food supplement, pharmaceuticals, animal feed, aquaculture and cosmetics (Widayat et al., 2018). They can be easily cultured and harvested, have short generation times and enable an environmentally-friendly approach to drug discovery by overcoming problems associated with the over-utilization of marine resources and the use of destructive collection practices (Lauritano et al., 2016).
The bioactive compounds from natural sources has beneficial effects on health (Herrero et al., 2013) and used for the treatment of different human diseases (Newman and Cragg, 2012).
Several studies on the impact of various stresses including heavy metal exposure on microalgal growth have been done (Pinto et al., 2003; Zouari et al., 2016). Algae often minimize free radical damage by inducing an antioxidant defensive system (Li et al., 2006; Olivares et al., 2016), such as non-enzymatic (e.g., glutathione (GSH), tocopherols, ascorbate (ASC), and carotenoids), and enzymatic (e.g., superoxide dismutase (SOD), catalase, ascorbate peroxidase (APX)), which are known to be involved in protecting plants against high toxic levels of heavy metals (Pinto et al., 2003; Sáeza et al., 2015; Machado and Soares, 2016; Moenne et al., 2016). A large number of algal extracts and / or extracellular products have proven antimicrobial, antitumor, antioxidant and antiviral activities (Ghasemi et al., 2004; Ozemir et al., 2004).
This study aimed to identify the secondary metabolites produced by Chlorella vulgaris cultivated undernutrient stress concentration especially copper and zinc as micronutrients by an increase or decrease of the element content in the culture medium (BG11). Nutrient stress was performed by single nutritive component (Cu, Zn) and in combination of two elements (Cu+Zn) as well as the biological activities of these metabolites (antioxidant, antimicrobial and anticancer activities) were targeted in this study.
Statement of Novelty
- First time for cultivation of chlorella vulgaris under these conc. of microelements.
- Enhancement of the production of bioactive compounds from C.vulgaris
as antioxidant, anticancer. - Production of C.vulgaris biomass in modified growth media more than
BG11 (control media).
MATERIALS AND METHODS
Chemicals and drugs
Pure hexane, chloroform, ethanol, ether, acetone, methanol and methylene chloride were purchased from E. Merck Co. (Darmstadt, Germany). Sulfarhodamine, 2, 2 diphenyl-1-picrylhydrazyl (DPPH), 2, 2'- azino-bis (ethylbenzthiazoline-6-sulfonic acid (ABTS.+) were purchased from Sigma-Aldrich (St. Louis, MO, USA). Trichloroacetic acid and other materials were of the highest available commercial grade.
Algal cultivation
The green microalga Chlorella vulgaris used in this study was kindly isolated and identified by Dr.Sanaa Shanab, Professor of Phycology in the Department of Botany and Microbiology, Faculty of Science, Cairo University, according to Bourelly 1972, Prescott 1978, 1982, then molecularly identified by sigma company (6th October, Egypt).
The alga was cultivated on BG11 medium (Stanier et al., 1971) and incubated at controlled culture conditions of temperature (25±2°C) light intensity (40µE/m2/S), light duration (16-8 L/D cycles) with continuous aeration (60 bubbles/min).
Preparation of axenic culture (free from bacteria)
Purification of Chlorella vulgaris culture from bacteria is necessary for this study concerning secondary metabolites production without interference of bacteria mixed with the alga under investigation. Mixture of antibiotics; penicilliumG, dihydrostreptomycin sulfate and gentamycin sulfate at different concentrations according to the method described by Andersen (2005). The axenic culture of the alga was used in all experimental work.
Bacterial and fungal cultures
For determination of antimicrobial activity of different algal extracts, it was tested in vitro against G+ve and G-ve bacterial strains using agar well diffusion method.
The Gram positive bacterial strains, Staphylococcus aureus (ATCC: 6538) and Streptococcus mutans, (ATCC: 25175), the gram negative strains; Escherichia coli (ATCC: 9637) and Klebsiella pneumonia (ATCC: 10031) were cultured using nutrient agar medium and incubated at the favorable culture condition. Fungal strains used in this study were Aspergillus niger (ATCC: 32856) and candida albicans (ATCC: 10231).
Cell line cultures (for anticancer activity).
Human breast adenocarcinoma (MCF-7), human colorectal carcinoma (HCT 116) and human cervical cancer (Hela) were propagated in RPMI-1640 medium L-Glutamine (lonzaverviers SPRL, Belgium cat#12-604F), this medium was supplemented with 10%fetal bovine serum (FBS) (seralab, UK cat#EU-000-H) and 1% antibiotic, Antimycotic). The cells were incubated in 5% Co2 humidified at 37°c for growth.
Antioxidant enzymes kits
5-a-Catalase enzyme (Bio diagnostic). It is an antioxidant enzyme used against H2O2 which cause intracellular damage.The kit include: (1) phosphate buffer PH7 (100 mM/L), (2) H2O2 substrate as standard (500 mM/L), 3- chromogen inhibitor and (4) enzyme peroxidase (>2,000/L), 4-Aminoantipyrine preservative (2 mM/L).
5-b-Glutathione-S-transferase (GST) [Bio diagnostic]. They are multifunctional enzymes which play a key role in cellular detoxification. The enzymes protect cells against toxicants by conjugating them to glutathione and neutralizing their electrophilic sites. GST kit measures total GST activity by recording the absorbance at 340 nm’
5-c-Lipid peroxidation (Malondialdehyde) [Bio diagnostic]. Thiobarbituric
acid (TBA) react with malondialdehyde (MDA) in acidic medium at 95°c for
30 min. to form thiobarbituric acid reactive product determined spectrophotometrically by absorbance at 534 nm (of the pink product).The kit include: (1) standard (10 nmol/ml) (2) Thiobarbituric acid detergent stabilizer (25 mmol/L).
Modification of the chemical composition of the culture medium
Studying the effect of varying nutritive elements provided by the culture medium (BG11), an increase or decrease of certain element concentration was performed (as single element stress). copper and zinc concentrations used were; zero, 0.158, 0.316 and 0.632 mg/L for copper and zero, 0.44, 0.88 and 1.76 mg/L for zinc respectively. Combination of the two major nutrients used was copper and zinc at concentration 0.316 mg/L for copper and 0.88 mg/L for zinc
(as double element stress).
Determination of algal growth rates
Growth of chlorella vulgaris culture (free from bacteria) was determined by measuring the optical density at 680 nm at 5 day interval though the incubation period of 30 days at the controlled culture conditions.
Determination of algal dry weight
Algal dry biomass was determined at 5 day interval of the incubation period (using 20 ml algal suspension), filtration, washing and drying at 105°c for 24 h according to the method described by Talukdar (2012).
Determination of chlorophylls and carotenoids
Pigments were determined according to Lichtenthaler and Wellburn (1985) using 96% methanol and recording the absorbance at the wavelengths 666, 653 and 470 nm and using the following equations:
Chlorophyll a (mg/g) = 15.65* A666 – 7.340* A653
Chlorophyll b (mg/g) = 27.05* A653- 11.2*A666
Total carotenoids (mg/g) = 1000*A470-2.860*Ca-129*Cb/245
Where A666, A653 and A470 nm are the absorbance at the indicated wavelengths.
Extraction of algal biomass
The dried algal biomass were extracted three times with organic solvent mixture of methanol and methylene chloride (1:1) for 40 minutes followed by centrifugation, filtration and evaporation of solvents using rotary evaporator at 40-50 °C. The obtained crude extract was expressed as percentage of the dried biomass weight used (mg extract/g dry biomass weight).
Determination of the total phenolic contents
Phenolic contents in the crude extract was determined according to the method of Taga et al. (1984) and expressed as Gallic acid equivalent/gram of the alga (GAE/g).
Determination of Flavonoid contents
Flavonoid content in the algal extract was determined by the spectrophotometric method recorded by Quettier et al. (2000) and expressed in terms of Rutin equivalent (mg of Ru/g of extract)
Determination of Tannins
Using Vanillin hydrochloride method of Broadhurst and Jones (1978). The amount of Tannic acid in the sample was recorded from the standard curve and expressed as tannic equivalents.
Estimation of total protein
Extraction of protein was performed according the modified method of Rausch (1981) and total protein concentration was determined using the method of Lowry et al. (1951) and absorbance was recorded at 720 nm. Total protein was determined using the calibration curve of BSA (0.2-40 µg/ml).
Determination of antioxidant enzymes and Lipid peroxidation Catalase estimation. Algal homogenate+phosphate buffer+H2O2 at 25°c, incubate for 1 min. then chromogen –inhibitor and enzyme peroxidase and preservative after incubation for 10 min. at 37°C, record absorbance of sample against sample blank and standard against standard blank using methods of
Aebi (1984) and Fossati et al. (1980) catalase activity U/g=Astandard-Asample/Astandard*1/gm biomass used.
Glutathionne-S-transferase. Algal homogenate and phosphate buffer at PH 7.4 + glutathione reduced (GSH). Incubation at 37°C for 5 min. then add CDNB and incubate at 37°C for 5 min. and finally mix with TCA, centrifuge at 3,000 rpm for 5 min. record the absorbance of sample (Asample) against blank at 340 nm, calculate the activity as U/g biomass=Asample *2.812/g biomass sample according to the method reported by Habig et al. (1974).
Lipid peroxidation (MDA determination method). Algal homogenate+phosphate buffer (PH 7.5), centrifuge at 4,000 rpm for 15 min. supernatant+chromogen, heat in boiling water bath for 30 min. coal and record the absorbance of algal sample (Asample) against blank and standard against distilled water at 354 nm. MDA in algal sample (nmol/g algal biomass) = Asample/Astandard*10/g tissue used. According the method described by Satoh (1978) and Ohkawa et al. (1979).
Biological activities of algal extract. Determination of biological activities of the crude extract produced from chlorella vulgaris cultured in normal BG11 growth medium (control) and altered (stressed) BG11 medium with modified contents of Copper and Zinc, single or in combination, the following activities were performed:
Antioxidant activity
-DPPH radical scavenging activity. The scavenging effects of crude Methanol: Methylene chlorid (1:1), extract was determined by the method of Yen and Chen (1995), where, 2.0 ml of 0.16 mM DPPH solution (in methanol) was added to a test tube containing 2.0 ml aliquot of sample. The mixture was vortexed for 1 min and kept at room temperature for 30 min. in the dark. The absorbance of all the sample solutions and BHT as synthetic standard were measured at 517 nm. The percentage (%) of scavenging activity was calculated as the following:
% Antioxidant activity = (Control-Sample x 100) / Control
Where control in DPPH solution (0.16 mM).
-ABTS radical cation scavenging assay. This assay was based on the ability of different substances to scavenge (2, 2’- azino-bis ethylbenzthiazoline-6-sulfonic acid (ABTS.+)) radical cation in comparison to a standard (BHT). The radical cation was prepared by mixing 7 mM ABTS stock solution with 2.45 mM potassium persulfate (1/1, v/v) and leaving the mixture for 4-16 hrs. until the reaction was completed and the absorbance was stable. The ABTS.+ solution was diluted with ethanol to an absorbance of 0.700 ± 0.05 at 734 nm for measurements according to Pellegrini et al., 1999). The photometric Assay was conducted on 0.9 ml of ABTS+. and 0.1 ml of tested samples and mixed for 45 s, and measurements were taken at 734 nm after 1 min. The antioxidant activity of the tested samples was calculated by determining the decrease in absorbance at different concentrations by using the following equation: E= ((Ac-At)/Ac) x 100, where: At and Ac are the respective absorbance of tested samples and ABTS.+
Increased regeneration of ROS occurred under stress conditions, the defense system in the form of low molecular weight substances (as ascorbic acid, β-carotene, glutathaione) and/or antioxidant enzymes (superoxide dismutase/catalase/peroxidase/glutathione-S-transferas) were produced in order to scavenge the ROS and avoid their harmful action on biomolecules and biomembranes.
Antimicrobial assay
To investigate the produced secondary metabolites produced under normal and stressed culture conditions of the selected alga for this study (Chlorella vulgaris), agar well diffusion method (Scott, 1989) was used. The algal crude extracts dissolved in DMSO were tested at a concentration of 15 mg/ml against both G+ve and G-ve bacterial strains and fungal strains (Aspergillusniger and candida albicans) which were previously cultured on their specific culture medium and incubated in their favorable conditions. (The activity was expressed as diameter of inhibition zones in mm), Ampicillin and Gentamicin were used as standards for G+ve and G-ve bacteria respectively and DMSO as -ve control, while Nystain was used as standard drug for fungi.
Anticancer activity
Cytotoxic effect of crude extracts was tested against different cancer cell lines (by MTT assay (El-Far et al., 2009; Dharmendra and Maurya, 2011; Ranganathan et al., 2015)) using 96-well plate in triplicates and the crude extracts dissolved in DMSO were tested against Breast, Hela and colon canceroma cell lines, Data were calculated as percentage of cell viability % cell viability = Mean absorbance in test wells/mean absorbance in control wells*100
Statistical analysis
Data were subjected to an analysis of variance, and the means were compared using the ‘Least Significant Difference (LSD)’ test at 0.05 levels, as recommended by Snedecor and Cochran (1982). Data are presented as mean ± SD.
RESULTS
Growth rate
The growth rate of Chlorella vulgaris cultivated under various zinc concentrations (of BG11 medium) was recorded in Table 1 the results revealed that, in zero (zinc) conc. an increase in growth rate during the incubation period until the 25th day of cultivation after which growth starts to decline. In control media (0.22 mg/L Zinc) a gradual increase of growth was recorded with maximum (0.995±0.01 g/L) at the 20th day then growth decreased. In 1X Zinc conc, (0.44 mg/L) an increased growth gradually recorded till the 25th day of cultivation (0.432±0.102 g/L). In 2X Zinc conc. (0.88 mg/L) a pronounced enhancement of growth was shown more than those of 0.44 mg/L Zn with maximum at 25th day of cultivation (0.528±0.107 g/L). In 4X Zinc conc. (1.76 mg/L) the results showed maximum growth rate was always recorded during all of the period of cultivation compared to all Zn conc. (0.44 and 0.88 mg/L Zn) even more than the control was showed (at 25th day) recording 1.005±0.14 g/L by the end of cultivation period (30 days) growth decline was recorded in all cases but still 4X Zn showed comparable maximum growth (0.916±0.112 g/L) as indicated in Table 1.
The data in Table 2 showed that an obvious increase in growth rate during the incubation period from 0-25th day of cultivation of C.vulgaris at all copper conc. with lower frequency increase in 0.632mg/L Cu conc. than those of 0.158, 0.316 mg/L Cu and even those of control and zero Cu conc. Maximum growth was noticed in 2X Cu (1.44±0.018 g/L) in the 20th and at the 25 th day of cultivation (1.609±0.02) followed in descending order by the growth rate at 1X Cu conc. (1.200±0.0014 g/L). By the end of cultivation time (30 days) and with the start of stationary phase of growth, a decline of growth was observed, but still 0.316 mg/L Cu conc. showed higher growth rate compared to all other conc. (1.470±0.011 g/L).
Table 3 recorded the combined effect of the two micronutrients (Cu and Zn) in 2X conc. during 30 days of cultivation. The combination of Cu + Zn showed an inhibitory effect of growth compared to those of control especially at the first 10 days of cultivation after which a steady increase of growth was noticed since the 20th and 25th day of cultivation compared to control. The combination Zn+Cu, induced comparable growth rate from 20-30 days of cultivations as shown in Table 3.
Table 1. Growth rate of chlorella vulgaris (O.D and dry wt. (g/L)) cultivated under different Zinc concentrations.
|
Days |
(0) Zn |
Cont. |
1X Zn |
2x Zn |
4X Zn |
|||||
|
|
Wt. |
O.D |
WT. |
O.D |
WT. |
O.D |
WT. |
O.D |
WT. |
O.D |
|
0 |
0.02± |
0.002± 0.0005g |
0.026±0.004f |
0.002± |
0.03± 0.004f |
0.003± 0.00153g |
0.03± |
0.003± |
0.02± |
0.003± |
|
5 |
0.08± |
0.049±0.001f
|
0.22± 0.003e |
0.089± |
0.036± |
0.02±
|
0.08± |
0.05±
|
0.06± |
0.04±
|
|
10 |
0.11± |
0.07±
|
0.38± 0.035d |
0.27± |
0.105± |
0.07±
|
0.169±0.007d |
0.11±
|
0.21± |
0.13±
|
|
15 |
0.17± |
0.11±
|
0.50± |
0.36± |
0.27± |
0.17± 0.0021d
|
0.35± |
0.22±
|
0.54± |
0.34±
|
|
20 |
0.246±0.003c |
0.16±
|
0.995±0.01a |
0.63± |
0.33± |
0.21± 0.004b
|
0.48± |
0.31±
|
0.66± |
0.42±
|
|
25 |
0.505±0.008a |
0.32±
|
0.60± |
0.55± |
0.43± |
0.27±
|
0.53± |
0.398±
|
1.01± |
0.64±
|
|
30 |
0.48± |
0.30± |
|
|
0.27± |
0.172±
|
0.48± |
0.34±
|
0.92± |
0.58±
|
Note: Data are presented as means ± SD (n=3) in each column and for each part means with different letters are significantly different (P˂0.05, One Way Anova, Fisherˈs LSD comparison).
Table 2. Growth rate of chlorella vulgaris (O.D and dry wt. (g/L) cultivated under different Copper concentrations.
|
Days |
(0) CU |
Cont. (0.079mg/L) |
1X CU |
2x CU |
4X CU |
|||||
|
|
Wt. |
O.D |
WT. |
O.D |
WT. |
O.D |
WT. |
O.D |
WT. |
O.D |
|
0 |
0.03± |
0.002± 0.0005g |
0.026±0.0037f |
0.002± |
0.03± |
0.003±0.0016f |
0.03± |
0.003± |
0.030± |
0.003± |
|
5 |
0.099±0.005f |
0.063±
|
0.216± 0.0030e |
0.09± |
0.10± |
0.063±0.0011e
|
0.120± |
0.076±
|
0.083± |
0.053± 0.001f
|
|
10 |
0.21± |
0.13±
|
0.38± 0.04d |
0.28± |
0.22± |
0.14±
|
0.42± |
0.27± 0.002e
|
0.17± 0.003e |
0.102± 0.002e
|
|
15 |
0.51± |
0.32± |
0.50± |
0.36± |
0.54± |
0.441±0.0036c
|
1.018± |
0.65±
|
0.25± |
0.16±
|
|
20 |
0.72± |
0.45±
|
0.995±0.010a |
0.63± |
0.997± |
0.689±0.004b
|
1.44± |
0.918±
|
0.46± |
0.2907±
|
|
25 |
0.93± |
0.592±
|
0.600±0.008b |
0.550± |
1.20± |
0.78±
|
1.61± |
0.99±
|
0.95± |
0.60±
|
|
30 |
0.78± |
0.497±
|
|
|
0.84± |
0.63±
|
1.47± |
0.94± |
0.81± |
0.51±
|
Note: Data are presented as means ± SD (n=3) in each column and for each part means with different letters are significantly different (P˂0.05, One Way Anova, Fisherˈs LSD comparison).
Table 3. Growth rate of chlorella vulgaris (O.D and dry wt. (g/L) cultivated on BG11 medium with modified Cu and Zn concentrations and combined effect of two elements.
|
Days |
Cont. |
(0.316 mg/L CU+ 0.88 mg/LZn) |
||
|
WT. |
O.D |
WT. |
O.D |
|
|
0 |
0.026±0.0037f |
0.002±0.0006f |
0.03±0.0020f |
0.003±0.0016f |
|
5 |
0.216±0.0030 |
0.089±0.004e |
0.086±0.003e |
0.055±0.003e |
|
10 |
0.383±0.035d |
0.277±0.0060d |
0.315±0.005d |
0.201±0.002d |
|
15 |
0.500±0.008c |
0.360±0.0085c |
0.442±0.007c |
0.280±0.0035c |
|
20 |
0.995±0.010a |
0.630±0.010a |
1.121±0.012b |
0.710±0.007b |
|
25 |
0.600±0.008b |
0.550±0.0076b |
1.310±0.020a |
0.830±0.0015a |
|
30 |
|
|
1.100±0.013b |
0.770±0.002b |
Note: Data are presented as means ± SD (n=3) in each column and for each part means with different letters are significantly different (P˂0.05, One Way Anova, Fisherˈs LSD comparison).
Pigments
The obtained results recorded in Table 4 showed that, in case of (Zn) conc. the elevation of Zinc conc. induced a gradual increase in carotenoids and total pigments which reached its maximum at 1.76 mg/L Zn (2.243±0.082, 6.07±0.438 mg/g). Concerning (Cu) conc. also, the increase in Cu conc. induced an obvious enhancement of pigment content which reached the maximum carotenoids of 3.77±0.2 mg/g and total pigments of 16.349±0.350 mg/g at 0.316 mg/g (Cu) conc. Combination of 0.88 mg/L (Zn) and 0.316 mg/L (Cu) led to an inhibition of pigment production comparable to those produced singly in Zn and Cu conc. (2.825±0.066, 10.81±0.191 mg/g of carotenoids and total pigments respectively).
Table 4. Pigments contents (as mg/g) produced by C.vulgaris cultivated under Copper and Zinc conc. separately or in combination.
|
Treatments |
Chl a |
Chl b |
Carotenoids |
Total pigments |
|
zinc conc. (mg/L) |
|
|
|
|
|
Control |
3.540±0.154c |
0.158±0.0068e |
1.666±0.100c |
5.364±0.0500c |
|
0 |
2.37±0.130d |
1.014±0.0136c |
0.9±0.005d |
4.300±0.148d |
|
0.44 |
1.74±0.027e |
1.132±0.0887b |
0.5±0.0045e |
3.387±0.111e |
|
0.88 |
4.66±0.318b |
1.192±0.0291a |
2.079±0.0043b |
7.937±0.340b |
|
1.76 |
5.214±0.408a |
0.852±0.0320d |
2.243±0.0824a |
8.310±0.365a |
|
copper conc. (mg/L) |
|
|
|
|
|
Control |
3.540±0.154e |
0.158±0.0068f |
1.666±0.100d |
5.364±0.0500e |
|
0 |
3.48±0.419e |
0.402±0.0068d |
2.100±0.1000e |
5.307±0.1528e |
|
0.158 |
5.160±0.121c |
0.676±0.0545c |
2.533±0.1523b |
8.369±0.300c |
|
0.316 |
8.891±0.089a |
3.688±0.072a |
3.77±0.200a |
16.349±0.350a |
|
0.632 |
3.713±0.088d |
0.391±0.0698e |
1.340±0.0053f |
5.447±0.4014e |
|
0.88mg/L Zn+ 0.316mg/L Cu |
7.721± 0.083b |
0.8377±0.0971b |
2.825±0.0661c |
10.808±0.191b |
Note: Data are presented as means ± SD (n=3) in each column and for each part means with different letters are significantly different (P˂0.05, One Way Anova, Fisherˈs LSD comparison).
Flavonoids and Phenolic compounds content
The obtained data in Table 5 for Cultivation of C.vulgaris on BG11 medium contained different Zn and Cu concentrations separately or in combination revealed that, at 0.44 mg/L Zn the alga produced a significant large content of flavonoids (23.89±1.336 mg/g) which is much higher than that produced by the control alga (21.495±2.20 mg/g) while lower (zero Zn conc.) or higher Zn conc. (0.88 and 1.76 mg/L) produced lower flavonoid contents compared to both those of control and 0.44 mg/L Zn as shown in Table 5.
Concerning copper, the conc. 0.316 mg/L Cu induced the production of the greatest flavonoid content (which reached 25.062±1.503 mg/g) exceeded that of the control (21.495± 2.2 mg/g) as well as those produced by lower (zero Cu) and higher Cu concentrations (0.158, 0.632 mg/g).
Combination of 0.88 mg/L Zn and 0.316 mg/L Cu induced much lower flavonoid content (7.529±0.74 mg/g) which equivalent to about half of that produced at 0.88 mg/L Zn (15.35 mg/g) and third that produced at 0.316 mg/L Cu (25.06 mg/g).
Also, The obtained data illustrated in Table 5 revealed that, Zn conc., 0.88 mg/L Zn produced the maximum phenolic content (60.166±1.25 mg GA/g) which represent more than double fold those of the control (25.92±0.425 mg GA/g) and it was followed in descending order by the quantity of phenolic content produced at 0.44 mg/L Zn (53.76±0.68 mg GA/g) while zero Zn and 1.76 mg/L Zn induced lower and comparable phenolic contents (20.00 and 19.34 mg GA/g respectively).
In case of Cu concentrations, increasing Cu concentrations (0, 0.158, 0.316 mg/L) induced an increased phenolic production with the maximum content of 35.20±1.058 mg GA/g at 0.316 mg/L Cu, which was about 1.5 folds that of the control (24.8±0.42 mg GA/g).
Combination of 0.88 mg/L Zn and 0.316 mg/L Cu led to extremely lower phenolic production (22.62±0.713 mg GA/g) synthesized by each of single micronutrients (60.166 in case of 0.88 mg/L Zn and 35.20 in case of 0.316 mg/L Cu).
The obtained results in Table 5 showed that, in case of Zn conc., Zn starvation produced the highest tannin content (1.7187±0.054 mg/g).
While in (Cu) conc., the more elevated Cu conc. (0.632 mg/L) produced the highest tannin content (1.412±0.0826 mg/g). Combination of 0.88 mg/L (Zn) and 0.316 mg/L (Cu) induced an increased amount of tannin (1.5426±0.1124 mg/g) which exceeded those produced separately by both Zn and Cu at the same concentrations.
Table 5. Flavonoids, phenolic and Tannins contents (expressed as mg /g dry wt.) produced by C. vulgaris grown under Copper and Zinc conc. separately or in combination.
|
Treatments
|
Flavonoids |
Phenolic contents as (mg Gallic acid equivalent/g dry wt.) |
Tannins conc. as (mg Tannic acid equivalent/g dry wt.) |
|
Zinc conc. (mg/L) |
|
|
|
|
Control |
21.495±2.20b |
25.92±0.425c |
1.052±0.0989b |
|
0 |
13.28±1.027d |
20.00±0.579d |
1.719±0.0545a |
|
0.44 |
23.892±1.336a |
53.76±0.680b |
1.004±0.0836b |
|
0.88 |
15.348±0.664c |
60.166±1.25a |
0.613±0.0620c |
|
1.76 |
7.095±0.364e |
19.34±1.23d |
0.49±0.0437c |
|
Copper conc. (mg/L) |
|
|
|
|
Control |
21.50±2.20b |
24.80±0.424c |
1.05±0.0989c |
|
0 |
14.47±1.064d |
25.92±0.425bc |
0.61±0.0288d |
|
0.158 |
16.00±1.35c |
27.16±0.854b |
0.508±0.0284d |
|
0.316 |
25.06±1.503a |
35.20±1.058a |
1.317±0.0653b |
|
0.632 |
1.35±0.370f |
15.02±0.159e |
1.41±0.0826ab |
|
0.88mg/L Zn+ 0.316mg/L Cu |
7.53±0.732e |
22.62±0.713d |
1.543±0.1124a |
Note: Data are presented as means ± SD (n=3) in each column and for each part means with different letters are significantly different (P˂0.05, One Way Anova, Fisherˈs LSD comparison).
Antioxidant activity
ROS are products of a normal cellular metabolism and play vital roles in the stimulation of signaling pathways in plant and animal cells in response to changes in intra- and extracellular environmental conditions. Proteins, nucleic acids and lipids were also significant targets for oxidative attack, and modification of these molecules can increase the risk of mutagenesis. Therefore, antioxidants are good scavengers for ROS and free radicals. In other word it defends and protect cells from their bad action. The antioxidants prevent damages in proteins, DNA (protect from mutation) and lipid peroxidation (protect plasma membrane) in living cells (normal cells).
In the current study, Concerning Zinc conc. (0, 0.44, 0.88, 1.76 mg/L) the obtained results in Table 6 revealed that, elevation of Zn conc. induced an augmentation of antioxidant activity either by DPPH (30 and 60 min.) or ABTS, with maximum activity at 0.88 mg/L Zinc conc. (89.91%) even exceeded those of control (85.62%). Higher Zn conc. (1.76 mg/L) induced lower activity when compared with synthetic antioxidant standard (BHT).
Concerning Cu concentrations (0, 0.158, 0.316, 0.632 mg/L), the conc. 0.158 mg/L and to less extend 0.316 mg/L Cu, induced higher antioxidant activity recorded by both DPPH and ABTS which exceeded those of the control (Table 6). Combination of 0.88 mg/L Zn + 0.316 mg/L Cu induced a relatively lower antioxidant activity by both DPPH and ABTS assays (73.066, 79.9 and 55.93% respectively) which were much lower not only by those produced by both control and Standard antioxidant (BHT) but also by separate elements at the same conc. as shown in Table 6.
Table 6. Antioxidant activity (%) of chlorella vulgaris extract cultivated in different Zinc, Copper combination of Cu and Zn. concentration by DPPH and ABTS.
|
Treatments |
DPPH at 30 min |
DPPH at 60 min |
ABTS |
|
Zinc conc. (mg/L) |
|
|
|
|
Control |
85.62±0.629b |
84.09±0.944616b |
61.18±0.742d |
|
0 |
64.155±1.003d |
71.24±0.773d |
52±0.980e |
|
0.44 |
81.683±1.533c |
81.283±0.831c |
72.1±0.655c |
|
0.88 |
89.916±0.728a |
89.13±0.615a |
75.23±0.585b |
|
1.76 |
82.133±0.907c |
82.32±0.470c |
49.25±0.901f |
|
Copper conc. (mg/L) |
|
|
|
|
0 |
74±0.952c |
74.6±0.360f |
54.8±0.721e |
|
0.158 |
87.30±0.60a |
84.836±0.660c |
78.03±0.850b |
|
0.316 |
86.293±0.525ab |
86.166±0.665b |
72.84±0.752c |
|
0.632 |
74.14±0.593c |
77.896±0.661e |
40.616±0.625f |
|
0.88mg/L Zn+ 0.316mg/L Cu |
73.066±1.006c |
79.95±0.676d |
55.93±0.901e |
|
BHT |
85.633±0.550a |
89.5±0.55 a |
90.82±0.687a |
Note: Data are presented as means ± SD (n=3) in each column and for each part means with different letters are significantly different (P˂0.05, One Way Anova, Fisherˈs LSD comparison).
Antimicrobial activity
Antimicrobial activity (expressed as diameter of inhibition zone in mm) of C.vulgaris (extract) cultivated in stressed culture of BG11 medium contained 0.158 and 0.316 mg/L (Cu), 0.44 mg/L and 0.88 mg/L (Zn) against standard antibacterial G-ve, G+ve (Gentamycin, Ampicillin respectively) and standard antifungal drugs (Nystatin) were given in Table 7, the obtained results revealed that, in gram –ve bacteria, only 0.88 mg/L (Zn) produced a moderate antibacterial activity (13.3±0.5 mm) against E. coli while Klebsiella pneumonia gave no activity with any of the test extracts.
In Gram+ve bacteria, Staphylococcus aureus produced variable antibacterial activities with the test extracts ranged between 15.3±0.6 to 20.6±0.6 mm. 0.158, 0.316 mg/L (Cu) extracts produced highinhibition zones of 15.3±0.6 and 17.6±0.6 mm. respectively. The highest antibacterial activity was produced by (Zn) containing extracts (0.44 and 0.88 mg/L) recording an activity of 20.6±0.6 and 19.0±1.00 mm which were near to that of standard Ampicillin. Relatively lower activities were obtained with the same extracts against Streptococcus mutans giving an activity ranged 10.3±0.5-14.6±0.5 mm.
Concerning fungal sp. Aspergillus niger have no activity while the yeast Candida albicans produced moderate activity (10.3-11.6 mm) with extracts from algae cultivated under Zn stress while Cu conc. have no activity.
Table 7. Antimicrobial activity (as diameter of inhibition zone in mm) of C. vulgaris (extract) cultivated in BG11 medium contained stressed conc. of Zn and Cu.
|
Sample microorganism |
0.158 mg/L (Cu) |
0.316 mg/L (Cu) |
0.44 mg/L (Zn) |
0.88 mg/L (Zn) |
Standard antibiotic |
|
Gram negative bacteria |
|
|
|
|
Gentamicin |
|
Escherichia coli (ATCC:9637) |
NA |
NA |
NA |
13.3±0.5 |
27±0.5 |
|
Klebsiella pneumonia (ATCC:10031) |
NA |
NA |
NA |
NA |
25±0.5 |
|
Gram positive bacteria |
|
|
|
|
Ampicilin |
|
Staphylococcus aureus (ATCC:6538) |
15.3±0.6 |
17.6±0.6 |
20.6±0.6 |
19.0±1.0 |
22±0.1 |
|
Streptococcus mutans (ATCC:25175) |
NA |
10.3±0.5 |
12.6±0.5 |
14.6±0.5 |
30±0.5 |
|
Fungi |
|
|
|
|
Nystatin |
|
Candida albicans (ATCC:10231) |
NA |
NA |
11.6±0.5 |
11.3±0.5 |
21±0.5 |
|
Asperagillus Nigar (ATCC:32856) |
NA |
NA |
NA |
NA |
20±0.5 |
Antitumor activity
MTT assay was used to assess the cytotoxicity of the crude extract of C.vulgaris against three different solid tumor cell lines. Different cell lines were used according to their origin and morphology as well as sensitivity and receptor sites behavior. The cytotoxicity parameter, IC50 was calculated. The obtained results of the crude extract (Figure 1) showed moderate potency against HeLa and HCT 116 cell lines for algae cultived under 0.316 mg/L Cu with IC50 of 94.2 and 145 μg/mL respectively, followed by algae cultived under 0.158 mg/L Cu with IC50 187 and 197 μg/mL respectively. However, MCF-7 cell lines showed relatively higher resistance against the crude extract with IC50 ranged from 303 to 757 μg/mL for all tested extracts (Figure 1).
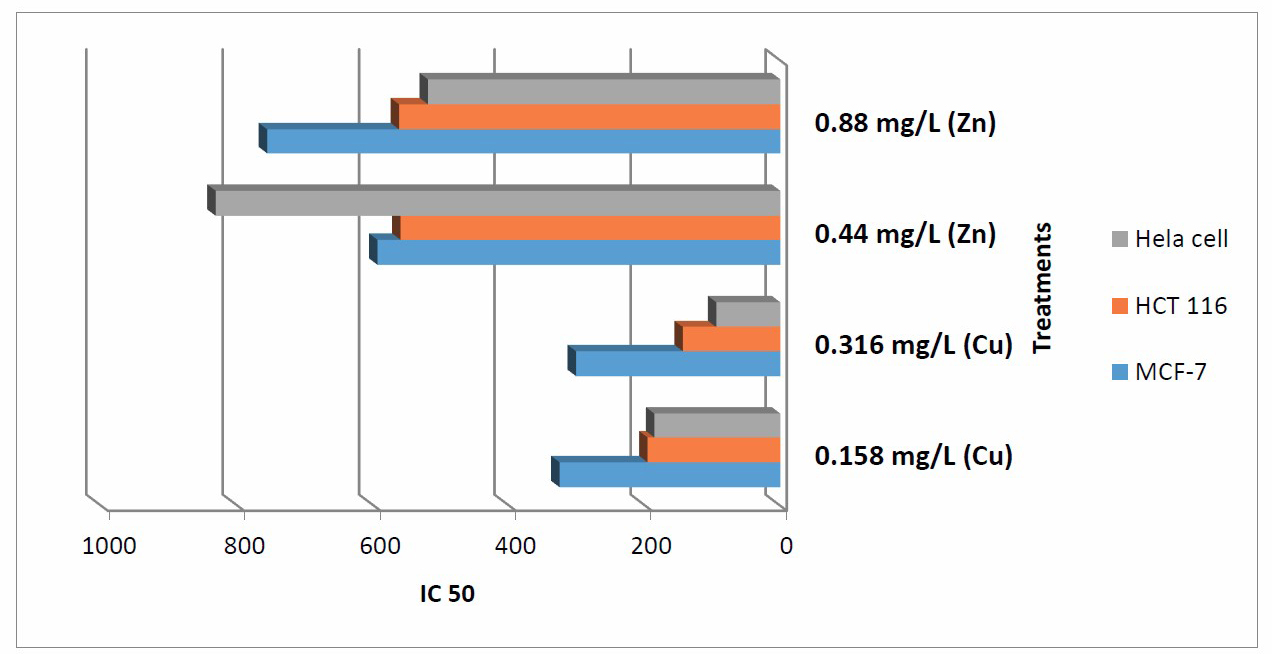
Figure 1. Cytotoxity (IC50) of tested extracts from chlorella vulgaris cultivated under diff. conc. from Zn and Cu on various cancer cell lines.
DISCUSSION
The growth rate results of Chlorella vulgaris cultivated under various zinc concentrations (of BG11 medium) may be due to that Zinc can easily be rationalized since it is a micronutrient required for microalgal metabolism (Bascik-Remisiewicz et al., 2009) as it is a part of prosthetic moieties of some of its relevant enzymes. In our study, the toxicity effect of zinc was progressively decreased when the exposure time was increased which was judged by the increased growth rate of the cultures. This may be due to the accumulation of zinc onto algal cells in higher concentrations which significantly affect/reduced the available zinc ion concentration and its toxicity to algal surviving cells in the final period of experiment as agreed by Lim et al. (2006).
However, the declined growth of C.vulgaris at high copper conc. may be due to the resistant of C.vulgaris to tested Cu concentrations (from 0.158 mg/L to 0.632 mg/L Cu) and copper, seems to regulate the expression of functional activity as conc. factor for different algal enzymes as reported by Harris (1992). Also, these results were in agreement with results obtained by Mamboya et al. (1999) who reported that, copper is acutely toxic to Padinaboergesenii at concentrations higher than 500 mg Cu/L. Low concentration of copper is toxic to P. boergesenii after a prolonged exposure of 21 days.
The data in Table 3 showed that the combination of Cu + Zn showed an inhibitory effect of growth compared to those of control this may be due to the accumulation of zinc or Cu onto algal cells in higher concentrations which significantly affect/reduced the available zinc and cu ions concentration and its toxicity to algal surviving cells in the final period of experiment as agreed by Lim et al. (2006).
The elevation of Zinc and copper conc. induced a gradual increase in pigments contents (carotenoids and total pigments) in C.vulgaris, these results may be due to the gene expression from the effect of Zn and Cu stress on algal cell and led to increase of algal pigments as deference compounds against this abiotic stress such as carotenoids, these results were in agreement with those obtained by Juan et al. (2005) Who reported that As for the moderate concentrations of Cu (up to 0.1 mM), they caused an increase in carotenoids, which protect against stress, since these pigments are responsible for the suppression of singlet oxygen (1O2), reducing lipid peroxidation and consequent oxidative damage.
From the data in Table 5, cultivation of algal cell under Zn conc. produced a significant large content of flavonoids (23.89±1.336 mg/g), However, Concerning copper, the conc. 0.316 mg/L Cu induced the production of the greatest flavonoid content. Furthermore, Combination of 0.88 mg/L Zn and 0.316 mg/L Cu induced much lower flavonoid content (7.529±0.74 mg/g), these results may be due to the gene expression from the effect of Zn and Cu stress on algal cell and led to increase of antioxidant compounds such as phenolic compounds, flavonoids, carotenoids. These results were in agreement with the results obtained by Sakihama et al. (2002), who found that Phenolic compounds responded to stress. However, at 0.1 mM the values presented a significant increase when compared to the control. Thus, these compounds may be acting as antioxidants as well as playing the role of chelating agents (Michalak, 2006). The observed increase in the concentration of phenolic compounds is confirmed by the data shown for anthocyanins and carotenoids, which are also compounds formed by aromatic rings. All these molecules along with proline (neutralization of OH- and 1O2), which presented the same behavior, probably have protective role in plant physiology in response to Cu stress in different cellular compartments, since anthocyanins are found in the vacuole, carotenoids in the chloroplast as well as proline in the cytosol.
The obtained results in Table 5 showed that, in case of Zn conc., Zn starvation produced the highest tannin content (1.7187±0.054 mg/g).
While in (Cu) conc., the more elevated Cu conc. (0.632 mg/L) produced the highest tannin content (1.412±0.0826 mg/g). Combination of 0.88 mg/L (Zn) and 0.316 mg/L (Cu) induced an increased amount of tannin (1.5426±0.1124 mg/g) which exceeded those produced separately by both Zn and Cu at the same concentrations.
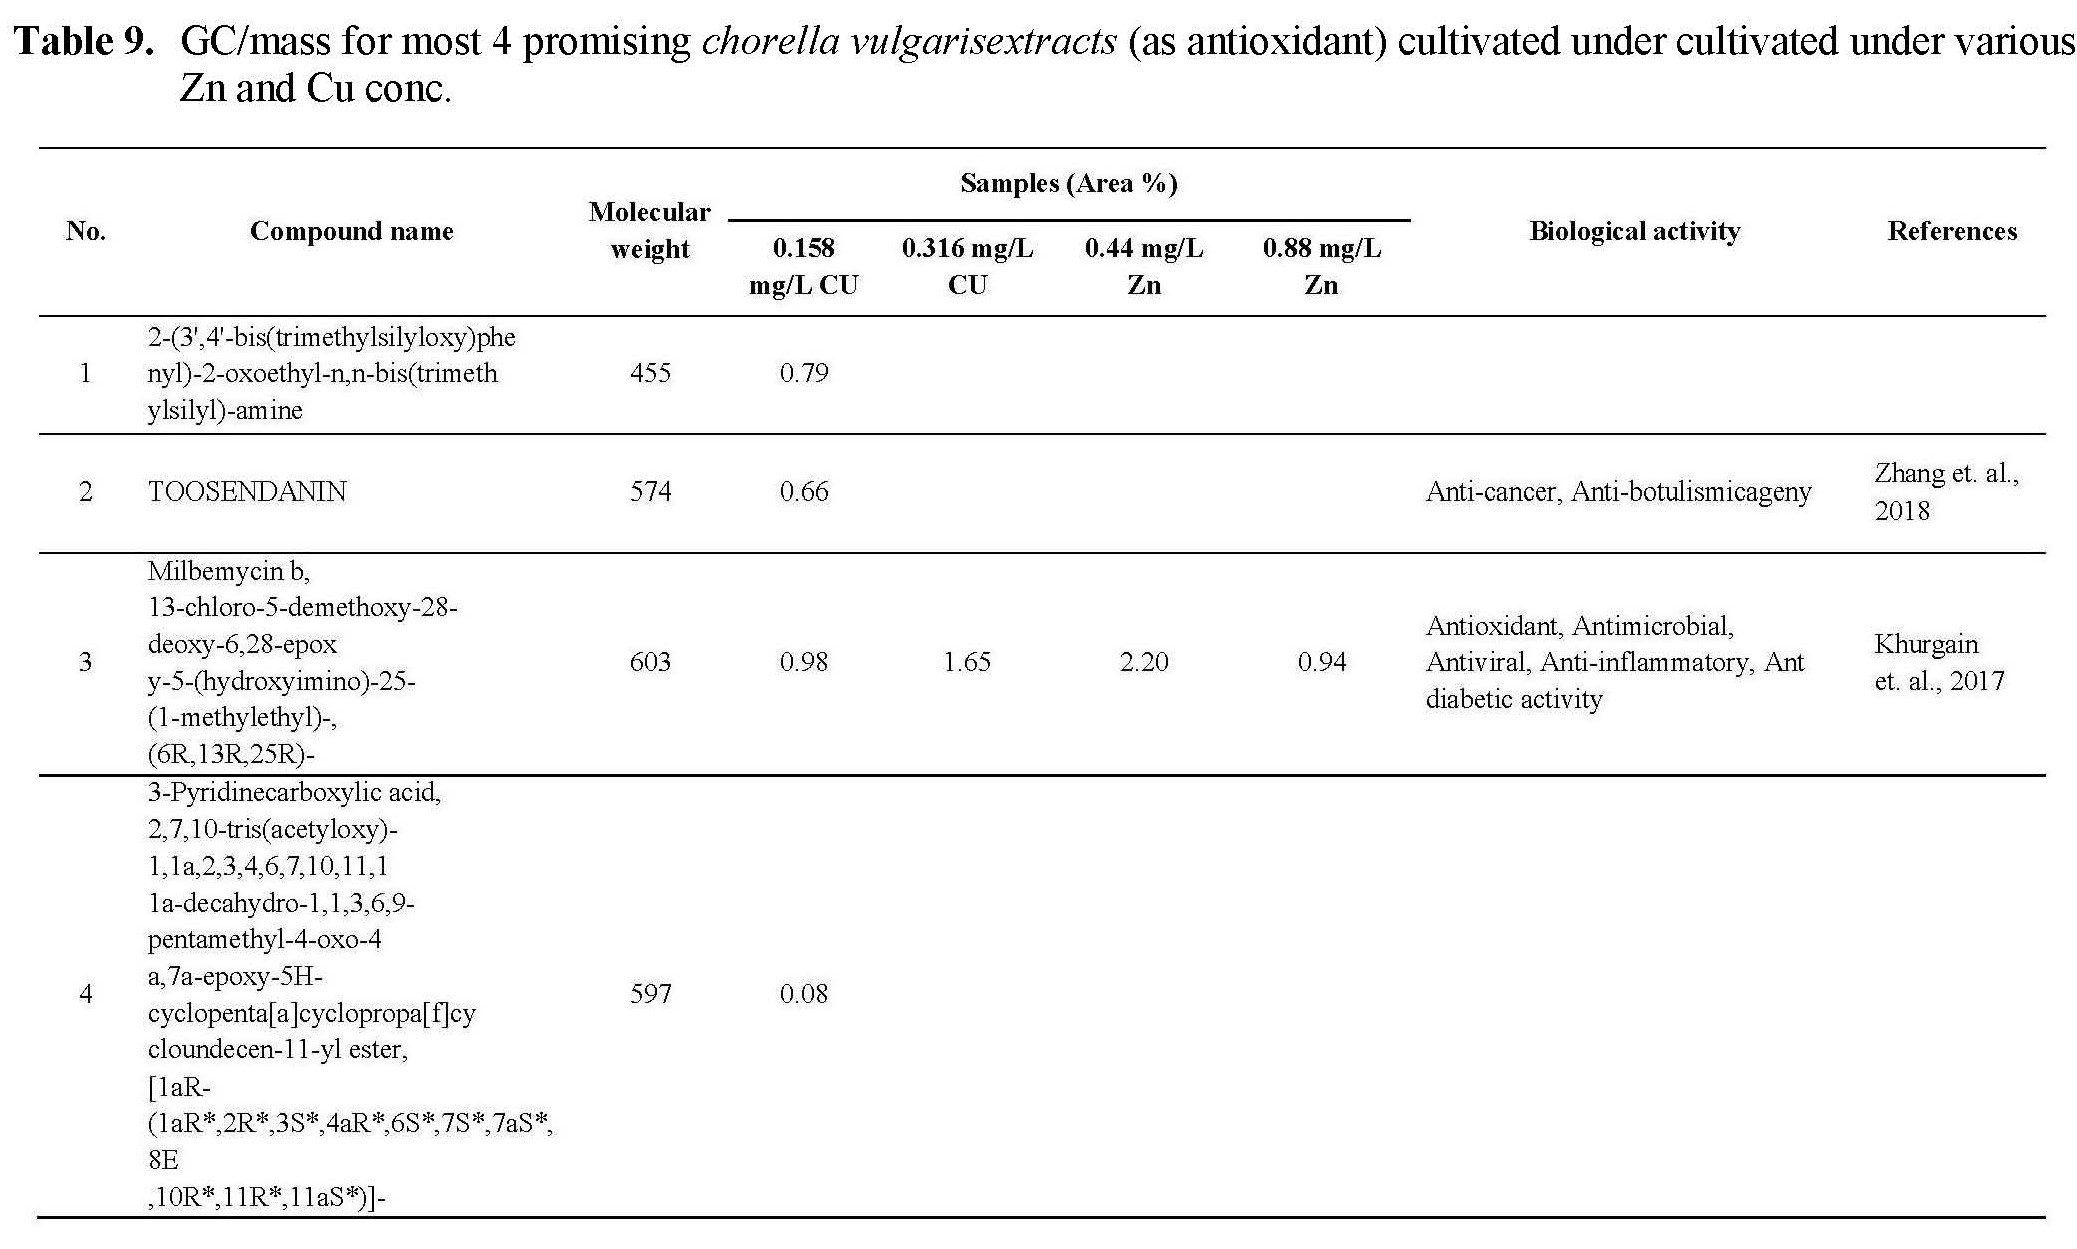
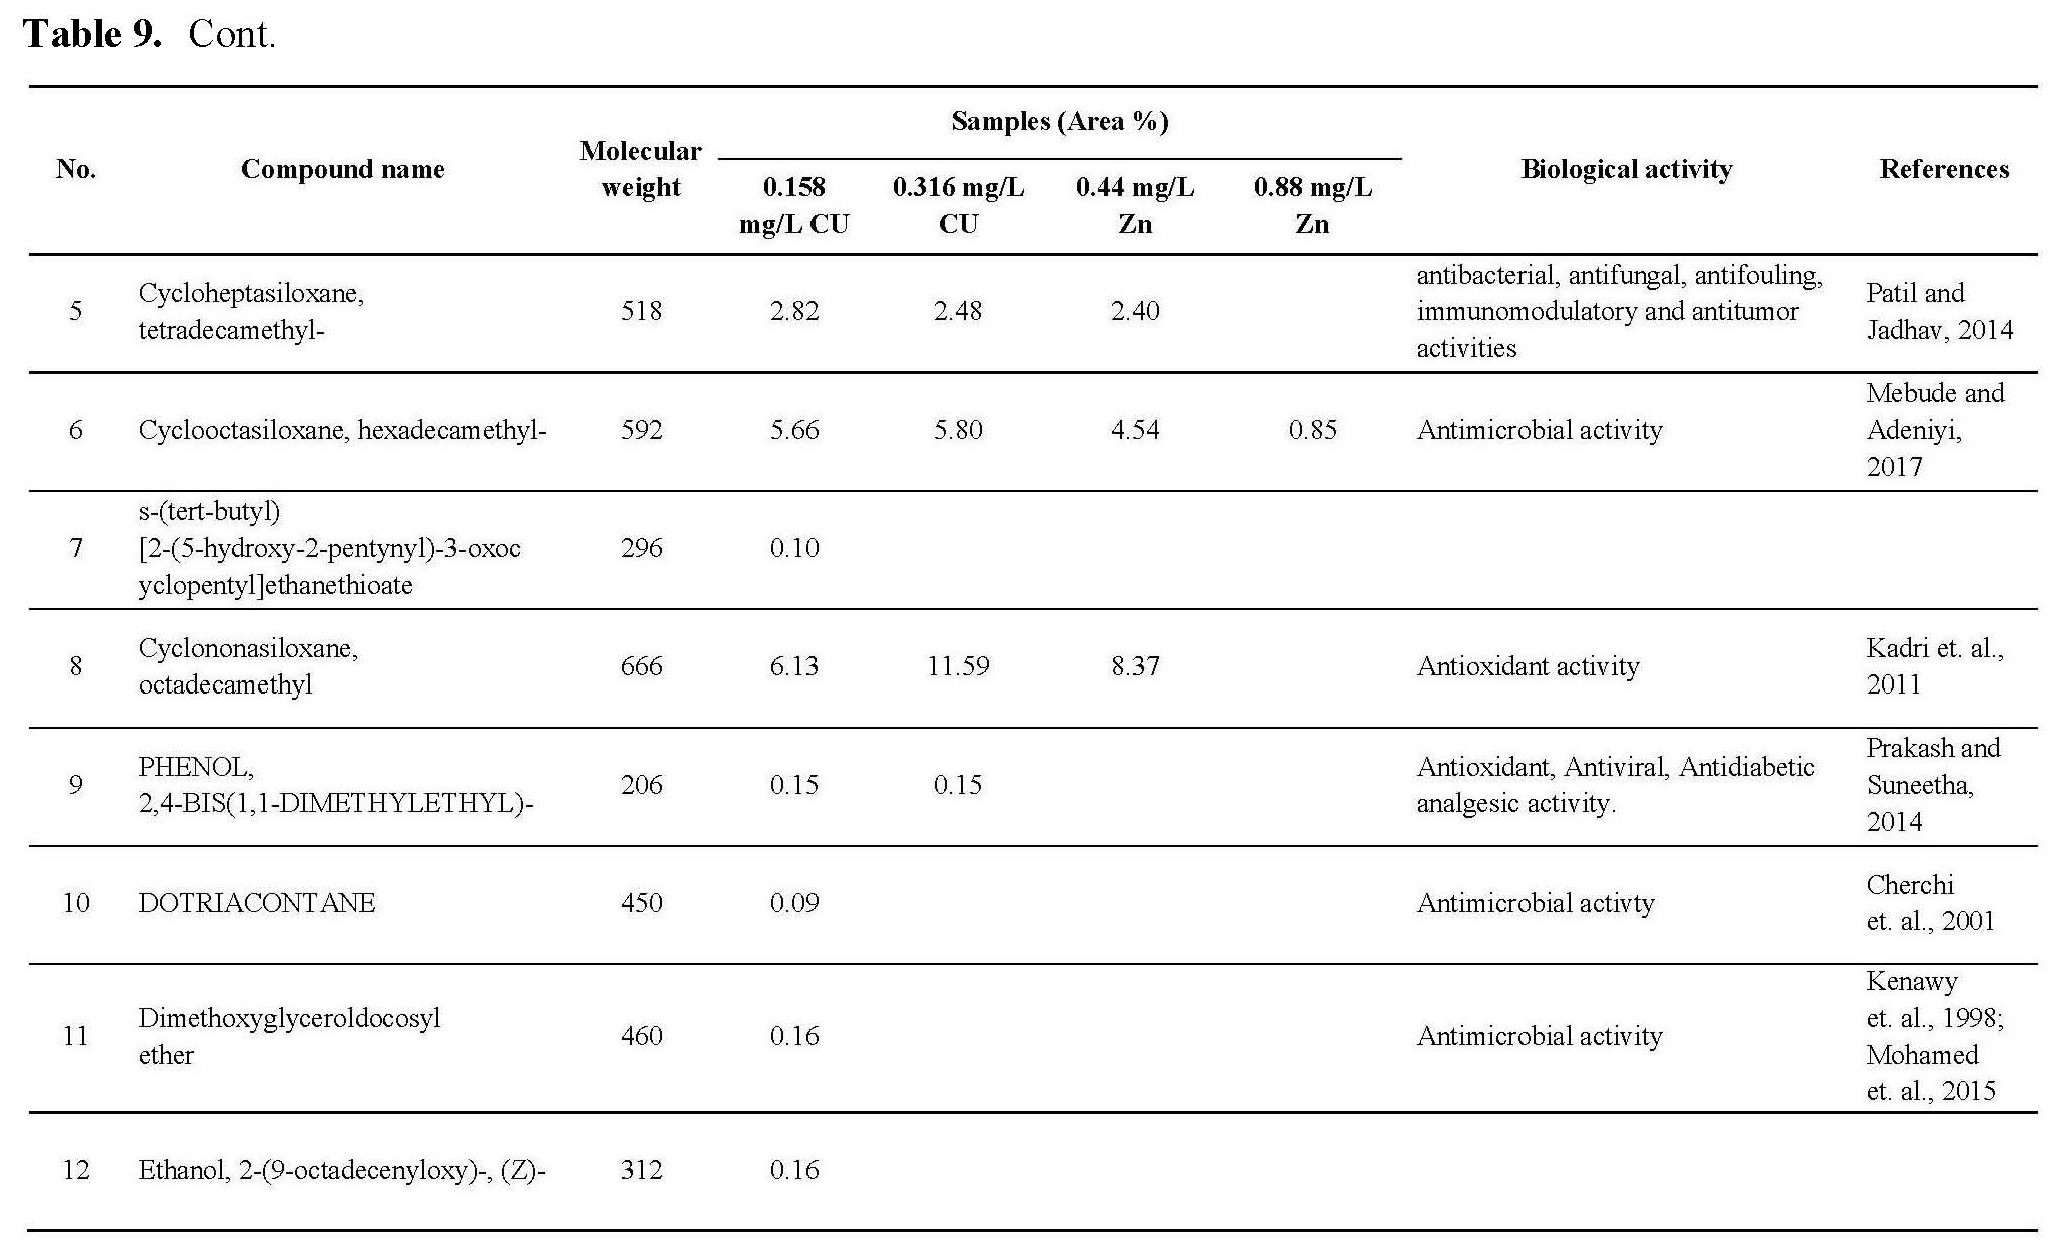
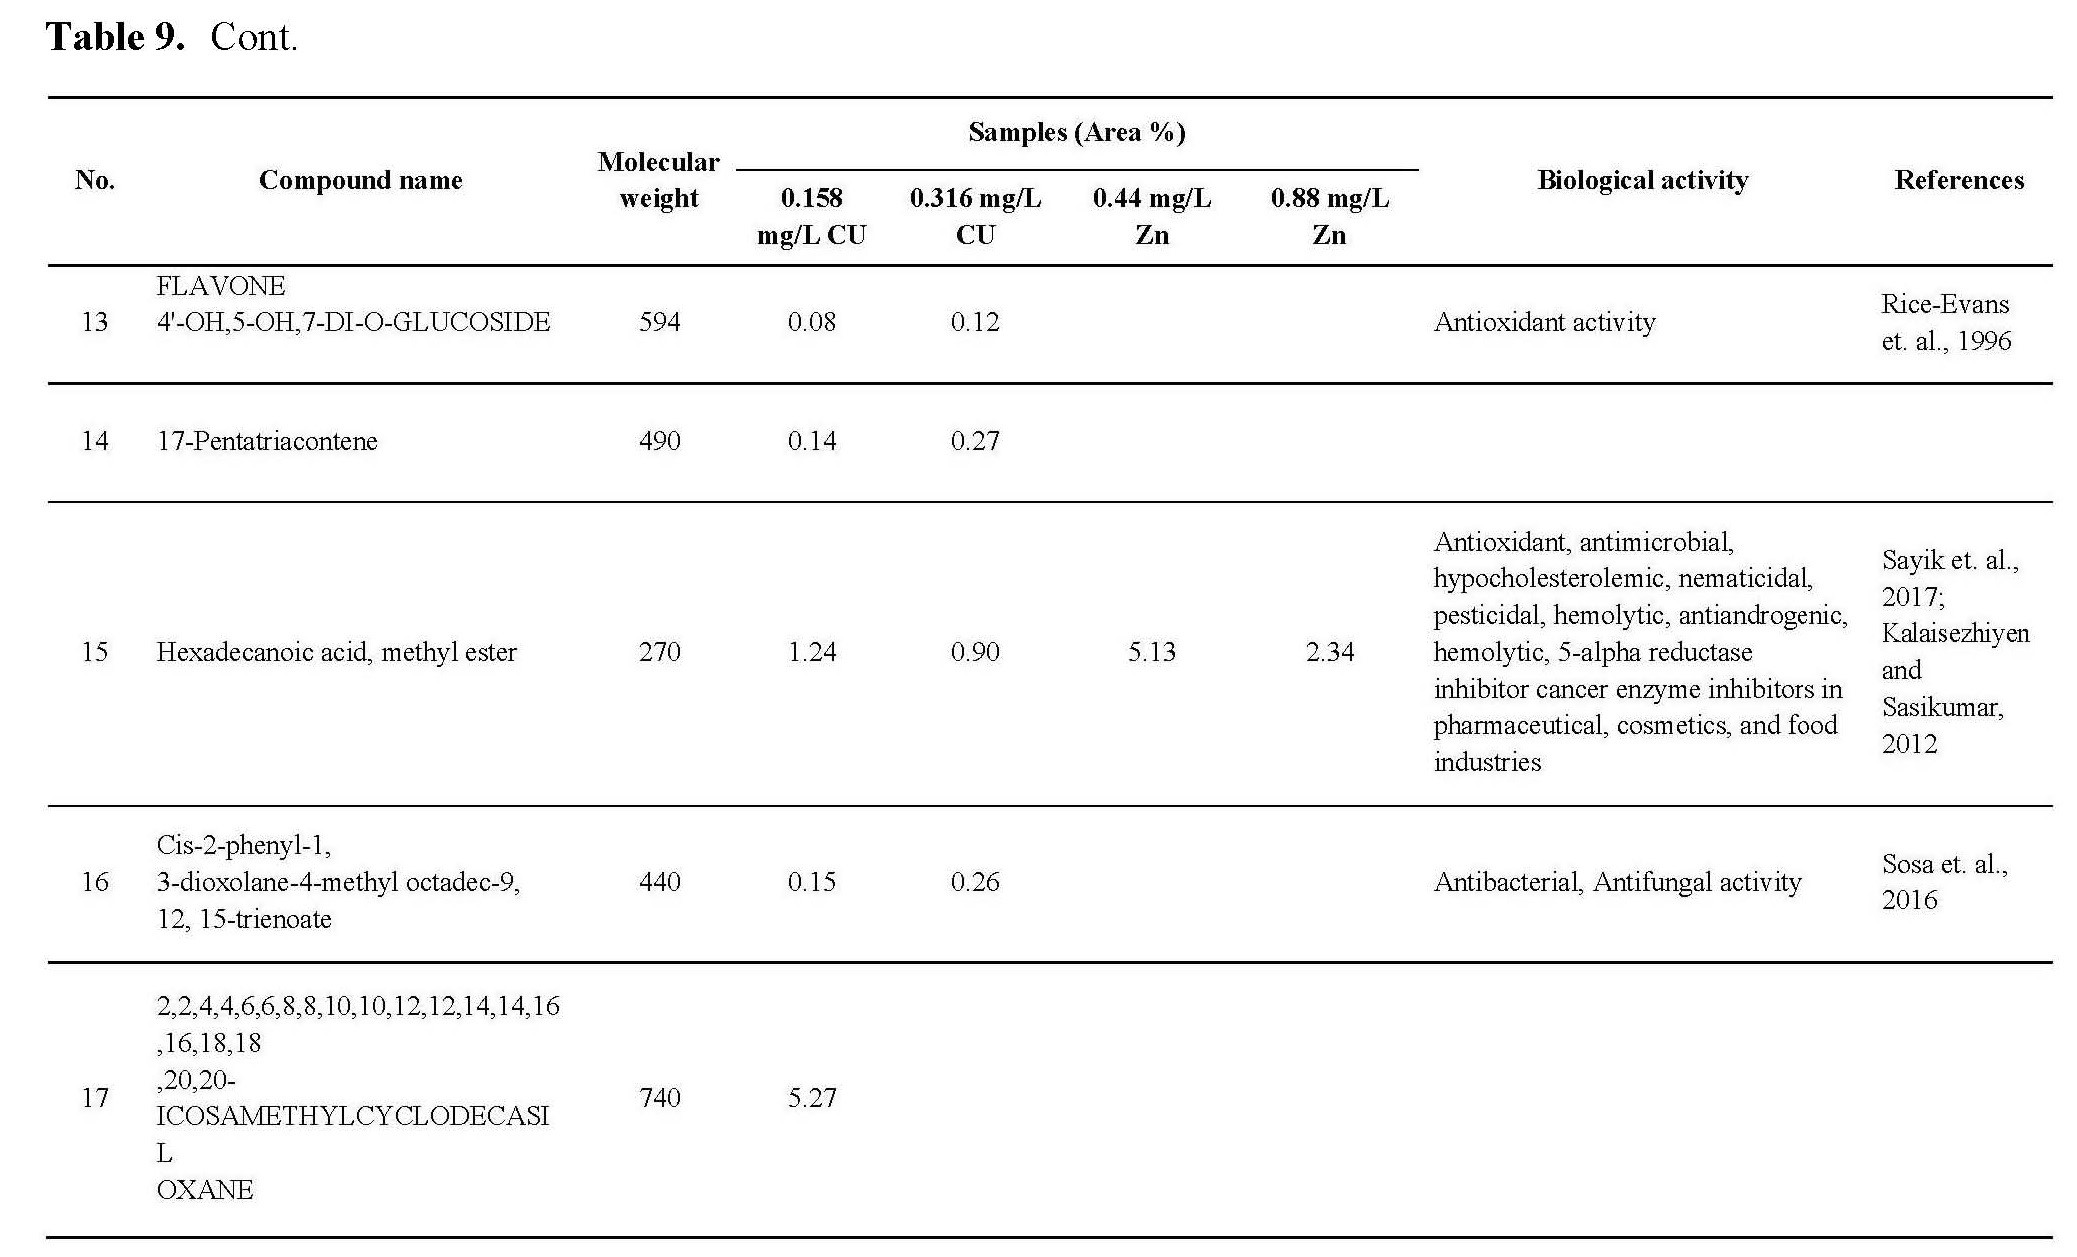
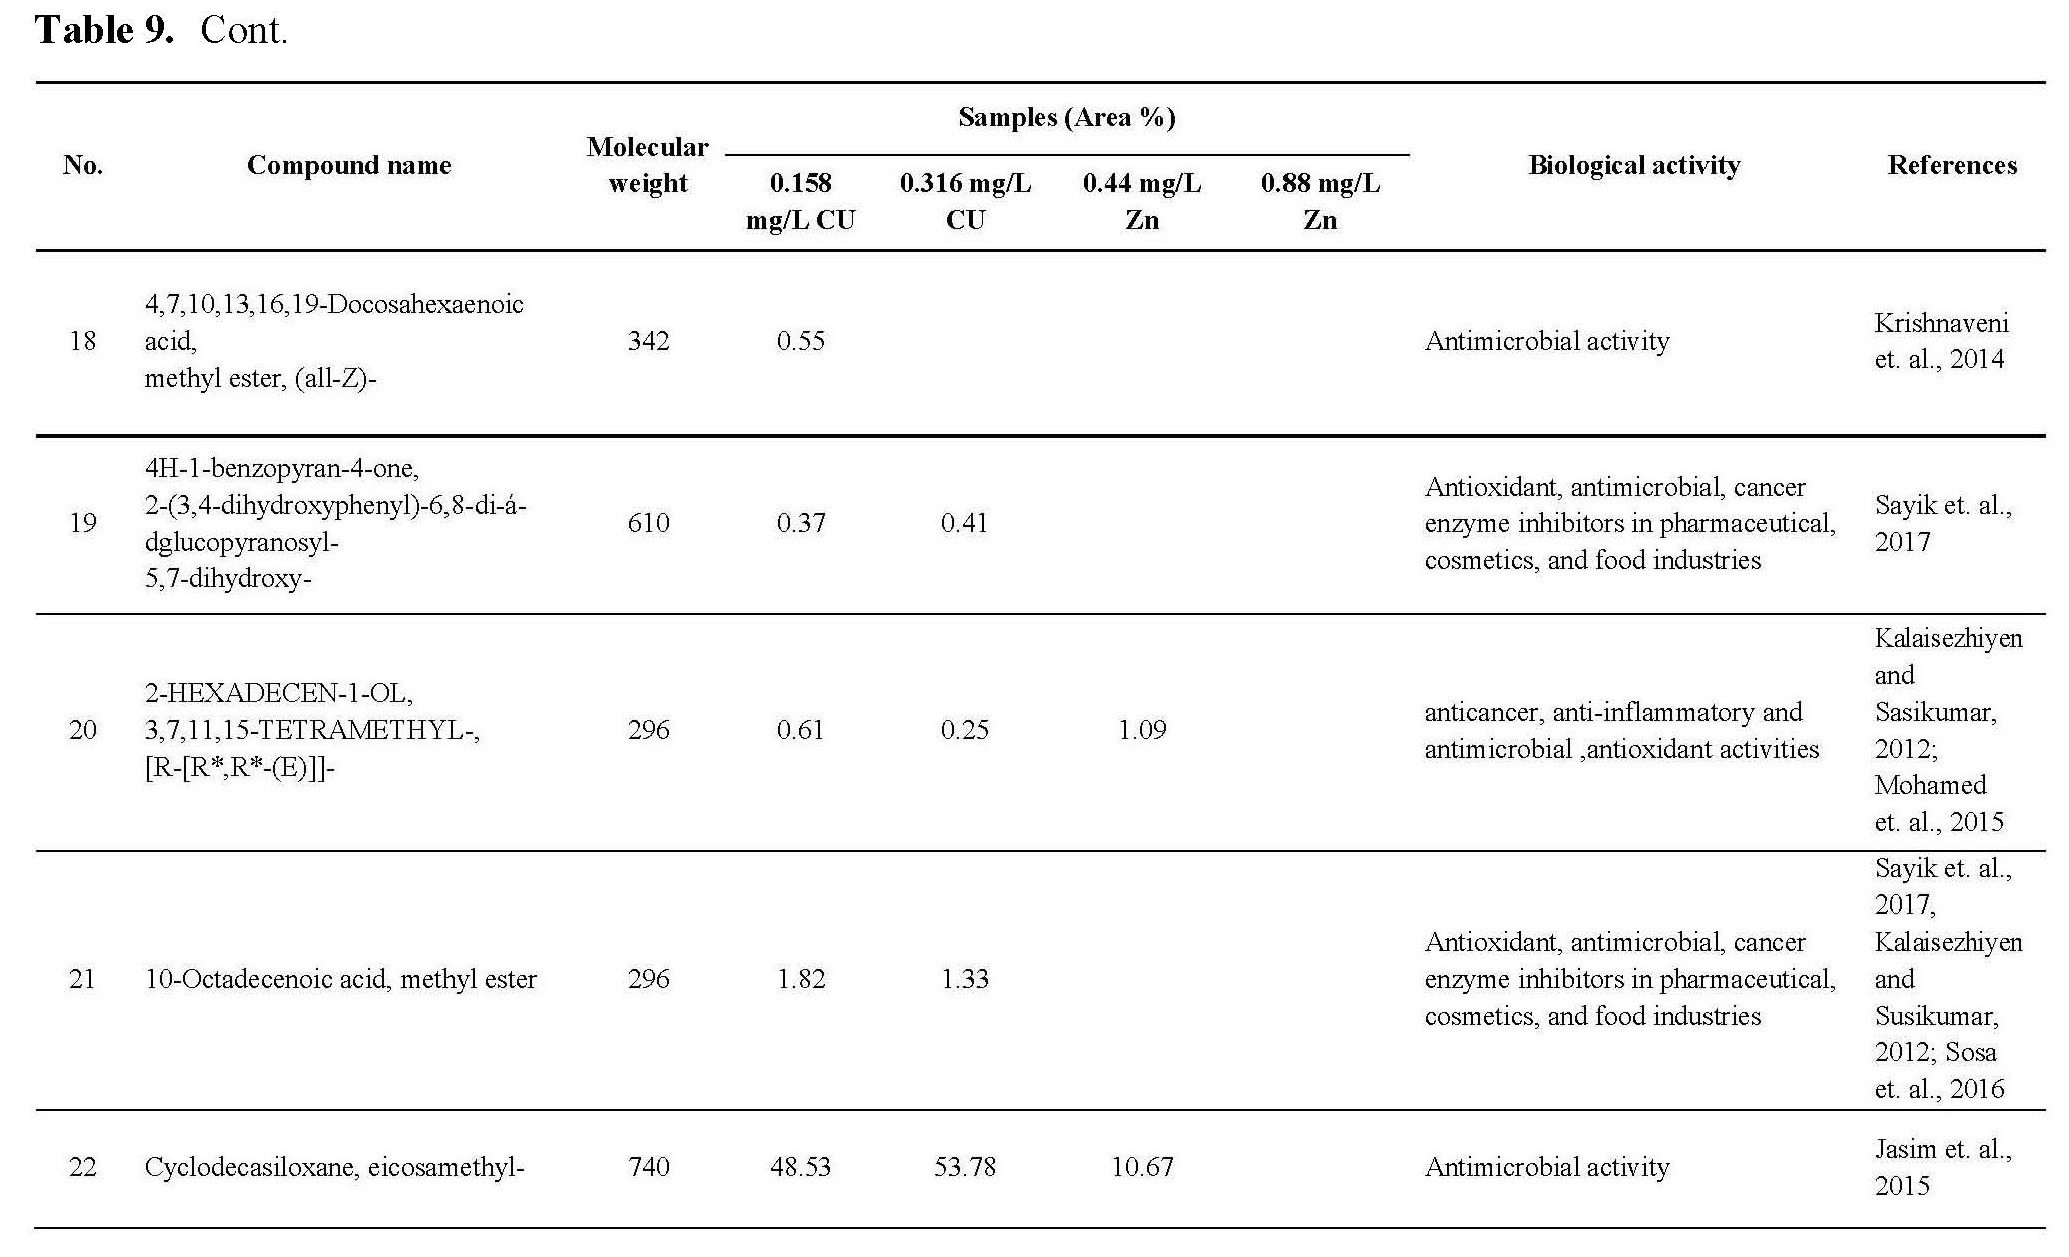
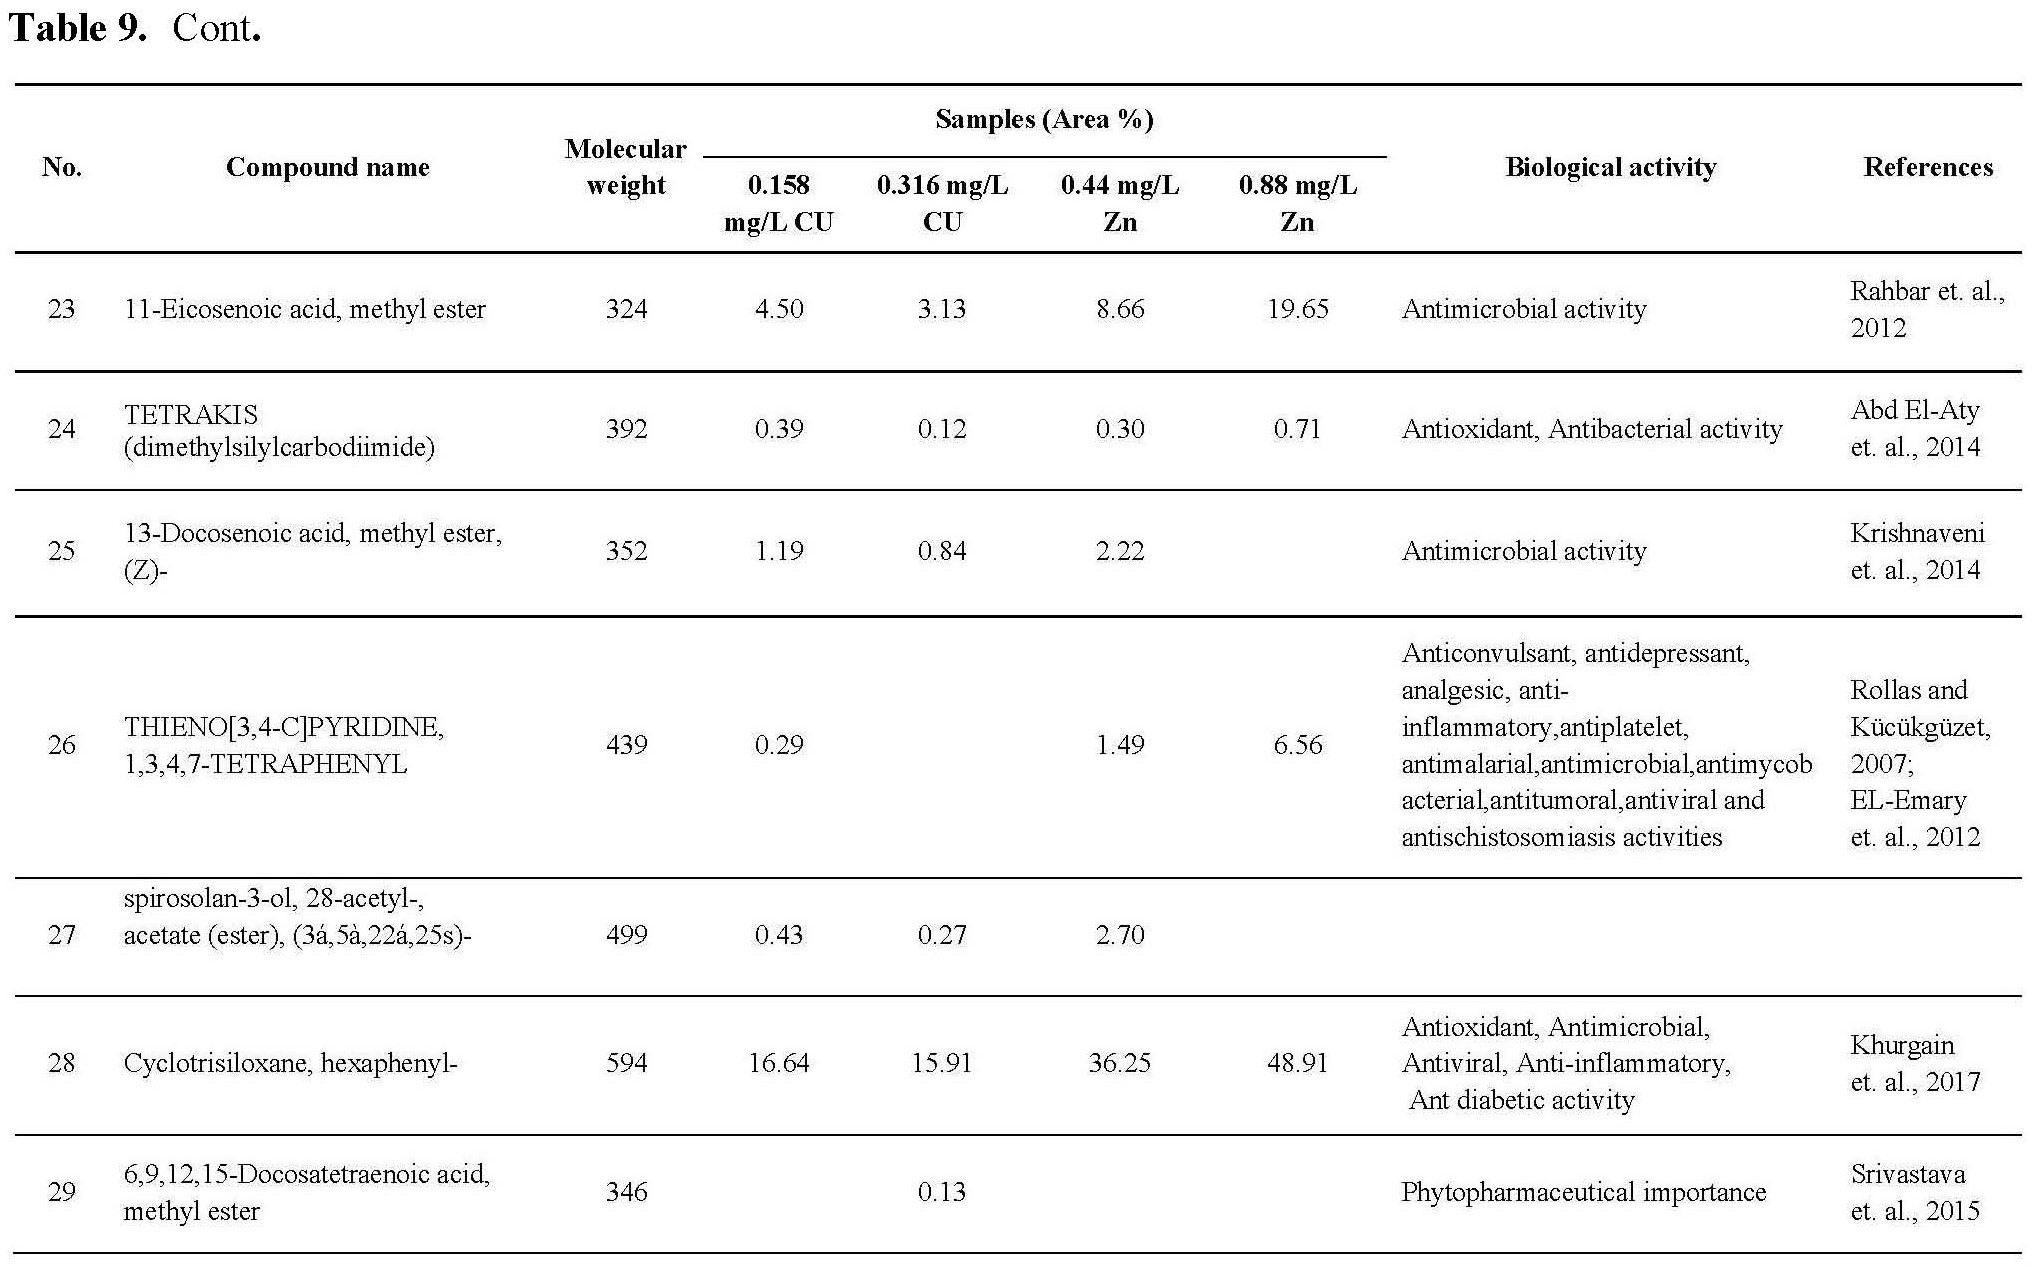
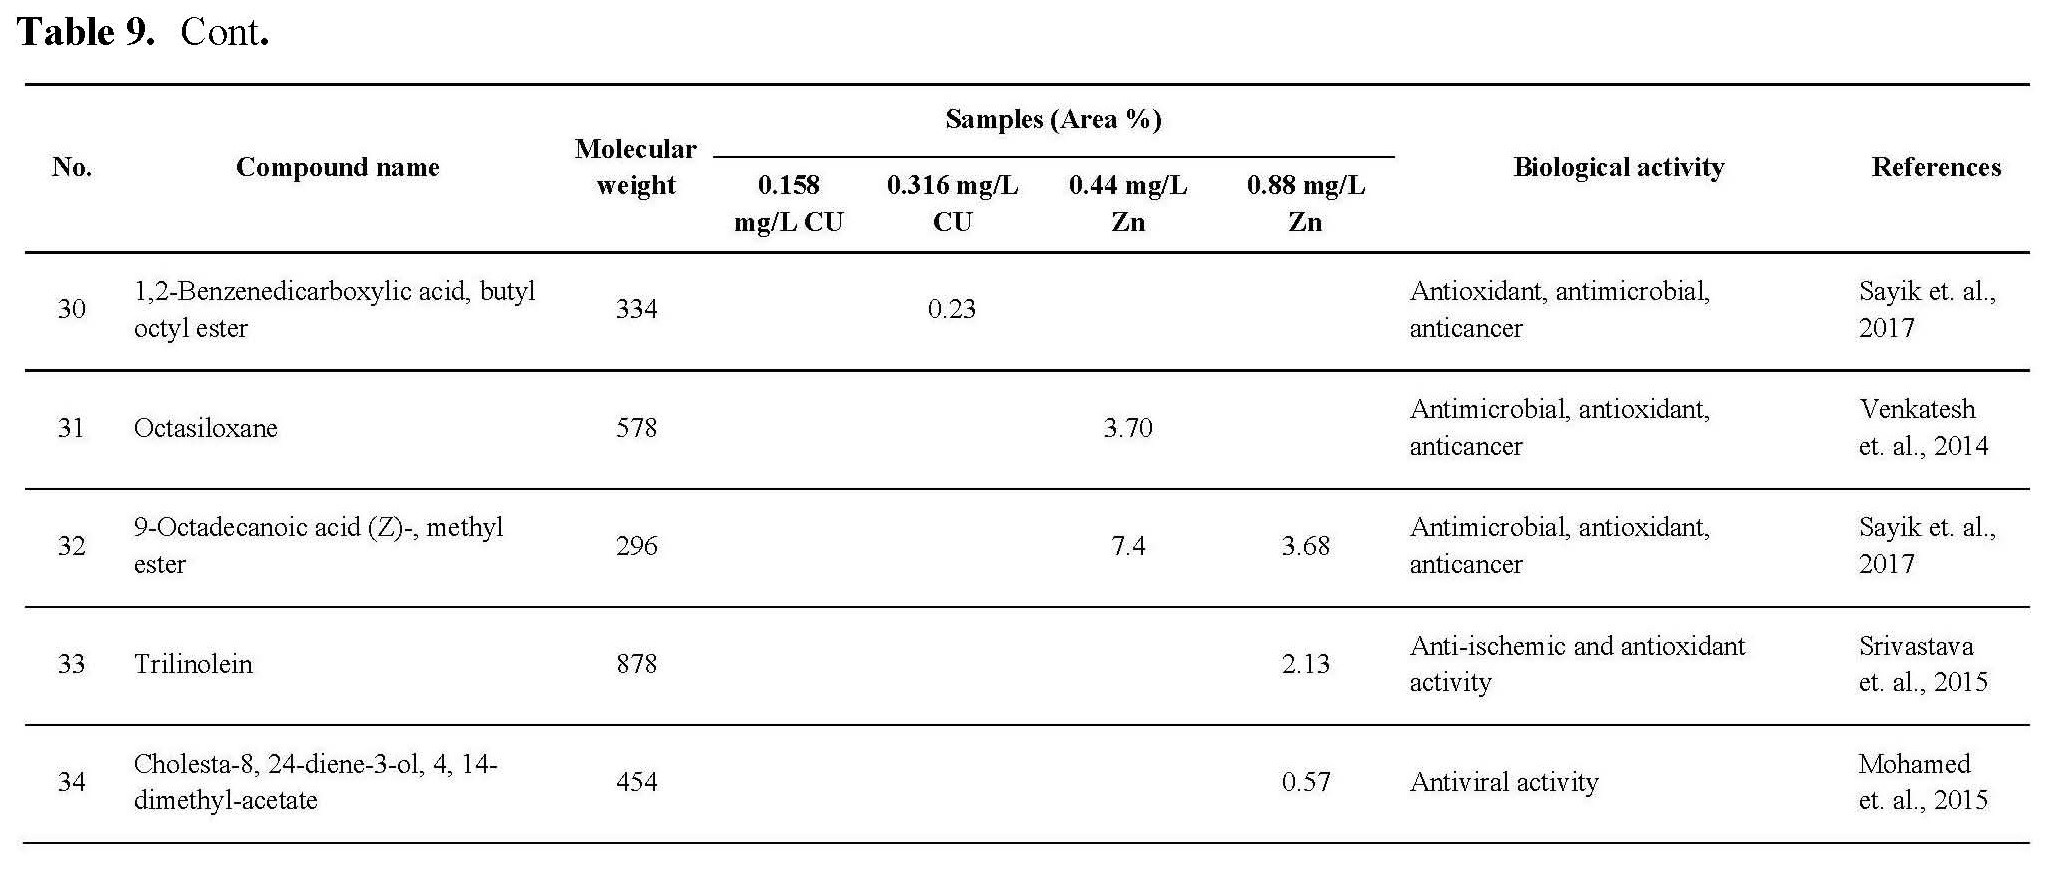
The antioxidant activity of active ingredients of the promising extracts from C.vulgaris cultivated under 0.44 and 0.88 mg/L Zn and 0.158 and 0.316 mg/L Cu may be correlated with the presence of hydroxyl group and unsaturated bonds in the chemical structure of its compounds which show high ability for scavenging free radicals and prevent the oxidation processes, as shown in Table 9, the promising extract are rich with bioactive compounds as antioxidant compounds such as Milbemycin b, cyclononasiloxane, hexadecanoic acid, 10-octadecanoic acid, Tetrakis, cyclotrisiloxane. These observations were in agreement with the previously published results (Kadri et al., 2011; Abd El-Aty et al., 2014; Khurgain et al., 2017; Sayik et al., 2017). Also, the obtained results correlated with data in Table 5, there are strong correlation between the antioxidant activity of promising extracts (Table 6) and concentration of flavonoids and phenolic compounds in Table 5, the algae cultivated under 0.44 and 0.88 mg/L Zn produced 23.89 and 15.34 mg/g flavonoids and 53.76 and 60.16 mg/g phenolic content. However, algae cultivated under 0.158 and 0.316 mg/L Cu produced 16.0 and 25.06 mg/g flavonoids and 27.16 and 35.20 mg/g phenolic content.
The obtained data recorded in Table 8 revealed that Concerning Zn, increased Zn conc., induced a gradual increase in lipid peroxidation while 1.76 mg/L (Zn) produced the highest lipid peroxidation (198.85±2.00 nmol/g). Moreover in case of 0.316 mg/L Cu conc. induced the greatest lipid peroxidation content (277.77±2.45 nmol/g) was induced. Combination of 0.88 mg /L (Zn) and 0.316 mg/L (Cu) led to the production of greater lipid peroxidation (217.74±2.50 nmol/g) than those produced by separate (Zn), 137.84±1.32 but less than that of (Cu) at the same concentrations (277.77±2.45). Concerning Glutathaione-S-transferase, (U/g tissue), the data recorded in Table 8 illustrated that, (Zn) conc., 1.76 mg/L produced 309.412±2.59 U/g while in case of (Cu) conc., 0.632 mg/L induced 345.93±3.06 U/g of the enzyme. Combination of 0.88 mg/L Zn and 0.316 mg/L Cu induced greater enzyme content (291±3.13 U/g). Concerning catalase activity (%), (Zn) conc., 1.76 mg/L Zn induced the greatest enzyme content (%) which reached 52.09±1.57%. Concerning (Cu) conc. the highest Cu conc. 0.632 mg/L induced the maximum catalase activity (57.97±1.93%). Combination of 0.88 mg/L (Zn) + 0.316 mg/L (Cu) produced an increased a catalase activity (47.3±1.70%) which was much more than those produced by 0.88 mg/L Zn but less than those produced by 0.316 mg/ L Cu separately. These results may be due to the mechanism of effect of heavymetal as inducer of oxidative stress in algal cell of Chlorella microalga activated a variety of antioxidative enzymes such as SOD, GST, CAT and APX to diminish the ROS. These biological responses can be interpreted as a tolerant mechanism as reported by Ajayan and Selvaraju (2012).
Table 8. Lipid peroxidation (MAD n mol/g), Protein (mg/g), Glutathaione-S-transferase (U/g tissue), Catalase activity (%) produced by C.vulgaris cultivated under Copper and Zinc conc. separately or in combination.
|
Treatments |
Lipid peroxidation (MAD n mol/g) |
Protein conc. as mg/g |
GST (U/g) |
Catalase activity (%) |
|
Zinc conc.(mg/L) |
|
|
|
|
|
Control |
66.51±0.67e |
125.15±3.77b |
69.87±1.90d |
33.53±0.96d |
|
0 |
170.21±1.40b |
80.52±2.26d |
190.00±2.23b |
40.09±1.65b |
|
0.44 |
130.08±1.52d |
74.40 ±3.92e |
175.82±1.98c |
37.97±1.02c |
|
0.88 |
137.84±1.32c |
113.88±3.18c |
191.23±2.03b |
41.90±1.30b |
|
1.76 |
198.85±2.00a |
172.30±3.16a |
309.412±2.59a |
52.09±1.57a |
|
copper conc. (mg/L) |
|
|
|
|
|
Control |
66.51±0.67e |
125.15±3.77d
|
69.87±1.90f |
33.53±0.96e |
|
0 |
90.34±0.89d |
122.66 ±2.58e
|
117.61±1.66e |
32.79±0.94e |
|
0.158 |
248.03±2.06b |
171.89.84c |
170.58±1.90d |
45.215±1.06d |
|
0.316 |
277.77±2.45a |
472.28±2.02a |
224.32±1.95c |
55.128±1.23b |
|
0.632 |
250.64±2.01b |
103.57±1.24f |
345.93±3.06a |
57.97±1.93a |
|
0.88 mg/L Zn + 0.316 mg/L Cu
|
217.74±2.50c |
172.30±3.16a
|
291.50±3.13b |
47.3±1.70c |
Note: Data are presented as means ± SD (n=3) in each column and for each part means with different letters are significantly different (P˂0.05, One Way Anova, Fisherˈs LSD comparison).
The antimicrobial activity of C.vulgaris cultivated under Zn and Cu conc. may be due to the types and content of secondary metabolites which synthesized during algal cultivated under Cu, Zn stress, from these metabolites which recorded antimicrobial activites: Milemycin b, cycloheptasiloxane, cyclooctasiloxane, hexadecanoicbacid, 2-hexadecanoic-1-Ol, cyclodecasiloxane, 4-Eicosaenoic acid, Tetrakis, 13-Docosenoic acid, Cyclotrisiloxane, Octasiloxane as shown in Table 9. these compounds have high ability to inhibit microbial growth by its effect on microbe replication, microbe enzymes, cell membrane etc. as reported by Rollas and Kücükgüzel, 2007; Kalaisezhiyen and Sasikumar, 2012; Krishnaveni et al., 2014; Khurgain et al., 2017, Mebude and Adeniyi, 2017; Sayik et al., 2017.
From the obtained data in Figure 1 , it is clear that the cytotoxicity pattern of the crude extract of C.vulgaris on both HCT 116 and HeLa cell lines is similar while differs on MCF-7. These results indicate that the effect of crude extract on HCT 116 and Hela cells is concentration dependant through the concentrations tested (1-1000 μg/mL). This effect can be explained as receptor independent for these type of cells (Westerink and Schoonen, 2007).
Also, the cytotoxic profile of the crude extract may be due to its content from bioactive compounds as mention in Table 9, the data revealed that the algal cultivated under 0.316 Cu mg/L was rich with different anticancer compounds such as Milbemycin b, cycloheptasioxane, hexadecanoic acid, cyclotrisiloxane, 1,2-benzenedicarboxylic acid. Furthermore, alga cultivated under 0.158 mg/L (Cu) was rich with the following anticancer compounds: Toosendanin, Milbemycin b, cycloheptasioxane, hexadecanoic acid and cyclotrisiloxane as recorded by Rollas and Kücükgüzel 2007; Kalaisezhiyen and Sasikumar, 2012; Krishnaveni et al., 2014; Khurgain et al., 2017; Mebude and Adeniyi, 2017 and Sayik et al., 2017 (Table 9).
CONCLUSION
From our data, it can be concluded that the pronounced results may encourage a country-wide project for making a pharmaco-economic value of microalgae in Egypt. In this concern, our results support the use of Chlorella vulgaris for the production of active compounds especially for pharmaceutical remedies. In addition, they have scavenging antioxidant properties against the reactive oxygen species. The present study reveals the high potency of crude extracts as antioxidants and potential anticancer in comparison to synthetic standards. This crude extract represents favorable economic and industrial value for the production of commercial products. the biological activities of C.vulgaris increased for more than 2 times when cultivated under stress of Cu and Zn ions and it can used for the production of bioactive compounds with high percentage.
ACKNOWLEDGEMENTS
This work was fully supported by a grant from the Faculty of Science, Cairo University, Egypt.
REFERENCES
Abd El-Aty, A.M., Mohamed, A.A., and Samhan, F.A. 2014. In vitro antioxidant and antibacterial activities of two fresh water Cyanobacterial species, Oscillatoria agardhii and Anabaena sphaerica. Journal of Applied Pharmaceutical Science. 4(07): 069-075. https://doi.org/10.7324/JAPS. 2014.40712
Aebi, H. 1984. Catalase in vitro. Methods in Enzymology. 105: 121-126. https://doi.org/10.1016/s0076-6879(84)05016-3
Ajayan, K.V., and Selvaraju, M. 2012. Heavy metal induced antioxidant defense system of green microalgae and its effective role in phycoremediation of tannery effluent. Pakistan Journal of Biological Sciences. 15: 1056-1062. https://doi.org/10.3923/pjbs.2012.1056.1062
Andersen, R.A. 2005. Algal culturing techniques. 1st ed. Phycological society of America: Elseviver Academic Press.
Báscik-Remisiewicz A., Tomaszewska E., Labuda K., and Tukaj Z. 2009. The effect of Zn and Mn on the toxicity of Cd to the green microalga Desmodesmusarmatus cultured at ambient and elevated (2%) CO2 concentrations. Polish Journal of Environmental Studies. 18(5): 775–780.
Bourrelly P. 1972. Les algaes d´eau douce: initiation à la systématique.Tom I. les alguesvertes. In: N. Boubeé, editor. Paris. 511 p.
Broadhurst, R.B., and Jones, W.T. 1978. Analysis of condensed tannins using acidified vanillin. Journal of Science of Food Agriculture. 29: 788-794. https://doi.org/10.1002/jsfa.2740290908
Cherchi, G., Deidda, D., De Gioannis, B., Marongiu, B., Pompei, R., and Porcedda, S. 2001. Extraction of Santol ina insularis essential oil by supercritical carbon dioxide: influence of some process parameters and biological activity. Flavour and Fragrance Journal. 16: 35–43. https://doi.org/10.1002/1099-1026(200101/02)16:1<35::AID-FFJ942>3.0.
CO;2-Y
Dharmendra K., and Maurya, N.N. 2011. Anticancer property of gallic acid in A549, a human lung adenocarcinoma cell line, and possible mechanisms. Journal of Clinical Biochemistry and Nutrition. 48(1): 85-90. https://doi.org/10.3164/jcbn.11-004FR
El-Far, M., Elmegeed, G.A., Eskander, E.F., Rady, H.M., and Tantawy, M.A. 2009. Novel modified steroid derivatives of androstanolone as chemotherapeutic anticancer- agents. European Journal of Medicinal Chemistry. 44: 3936-3946. https://doi.org/10.1016/j.ejmech.2009.04.020
Fossati, P., Prencipe, L., and Berti, G. 1980. Use of 3,5-dichloro-2-hydroxybenzenesulfonic acid /4-aminophenazone chromogenic system in direct enzymic assay of uric acid in serum and urine. Clinical Chemestry. 26(2): 227-231.
Ghasemi, Y., Yazdi, M.T., Shafiee, A., Amini, M., Shokravi, S., and Zarrini G, Parsiguine. 2004. A novel antimicrobial substance from Fischerella ambigua. Pharmaceutical Biology. 42: 318-322. https://doi.org/10.1080/ 13880200490511918
Habig, W., Pabst, M., and Jakoby, W.J. 1974. Glutathione S-transferases. The first enzymatic step in mercapturic acid formation. Journal of Biological Chemistry. 249: 7130-7139
Harris, E.D. 1992. Copper as a cofactor and regulator of copper, zinc superoxide dismutase. Journal of Nutrition. 122: (3 Suppl): 636-640. https://doi.org/ 10.1093/jn/122.suppl_3.636
Herrero, M., Castro-Puyana, M., Mendiola, J.A., and Ibañez, E. 2013. Compressed fluids for the extraction of bioactive compounds. Trends in Analytical Chemistry. 43: 67–83. https://doi.org/10.1016/j.trac.2012. 12.008
Juan, M., Rivero, R.M., Romero, L., and Ruiz, J.M. 2005. Evaluation of some nutritional and biochemical indicators in selecting salt-resistant tomato cultivars. Environmental and Experimental Botany. 54(3): 193-201. https://doi.org/10.1016/j.envexpbot.2004.07.004
Kadri, A., Zarai, Z., Chobba, I.B., Gharsallah, N., Damak, M., and Békir, A. 2011. Chemical composition and in vitro antioxidant activities of Thymelaea hirsute L. essential oil from Tunisia. African Journal of Biotechnology. 10(15): 2930-2935. https://doi.org/10.5897/AJB11.028
Kalaisezhiyen, P., and Sasikumar, V. 2012. GC- MS. Evaluation of chemical constituents from methanolic leaf extract of kedrostis foetidissima (jacq.) cogn. Asian Journal of Pharmaceutical and Clinical Research. 5(4): 77-81.
Kenawy, E., Abdel-Hay, F.I., EL-shanshoury, A.R., and EL- Newehy, M.H. 1998. Biologically active polymers: synthesis and antimicrobial activity of modified glycidyl methacrylate polymers having a quaternary ammonium and phosphonium groups. Journal of Controlled Release 50: 145-152. https://doi.org/10.1016/S0168-3659(97)00126-0
Khurgain, A.A., Dahan, Z.A., and Gyananath, G. 2017. The GC-MS analysis of leaf extracts of a medicinal plant, Anisotes trisulcus (Forrsk.). International Journal of Green and Herbal Chemistry. Sec. A, 7(1): 001-009. https://doi.org/10.24214/IJGHC/GC/7/1/00109
Krishnaveni, M., Dhanalakshmi, R., and Nandhini, N. 2014. GC-MS analysis of phytochemicals, fatty acid profile, antimicrobial activity of gossypium seeds. International Journal of Pharmaceutical Sciences Review and Researches. 27(1): 273-276.
Lauritano, C., Andersen, J.H., Hansen, E., Albrigtsen, M., Escalera, L., Esposito, F., Helland, K., Giovanna Romano, H.K., and Ianora, A. 2016. Bioactivity screening of microalgae for antioxidant, anti-inflammatory, anticancer, anti-diabetes, and antibacterial activities. Frontiers in Marine Science. 3:1-12. https://doi.org/10.3389/fmars.2016.00068
Lichtenthaler, B.W., and Wellburn, A.R. 1985. Determination of total carotenoids and chlorophylls A and B of leaf in different solvents. Biochemical Society Transactions. 11: 591-592. https://doi.org/10.1042/bst0110591
Li, M., Hu, C., Zhu, Q., Chen, L., Kong, Z., and Liu, Z. 2006. Copperandzinc induction of lipid peroxidation and effects on antioxidant enzyme activities in the microalga Pavlovaviridis (Prymnesiophyceae). Chemosphere 62(4): 565–572. https://doi.org/10.1016/j.chemosphee.2005.06.029
Lim, C.Y., Yoo, Y.H., Sidharthan, M., Ma, C.W., Bang, I.C., Kim, J.M., Lee, K.S., Park, N.S., and Shin, H.W. 2006. Effects of copper (I) oxide on growth and biochemical compositions of two marine microalgae. Journal of Environmental Biology. 27(3): 461-466.
Lowry, H., Rosebrough, N.J., Farr, A.L., and Randall, R.J. 1951. Protein measurement with the folin phenol reagent. Journal of Biological Chemistry. 193: 265-275.
Machado, M.D., and Soares, E.V. 2016. Short- and long-term exposure to heavy metals induced oxidative stress response in Pseudokirchneriella subcapitata. Clean–Soil, Air, Water. 44(11): 1578–1583. https://doi.org/ 10.1002/clen.201600020
Mamboya, F.A., Mtolera, M., Björk, M., and Pratap, H.B. 1999. The effect of copper on the daily growth rate and photosynthetic efficiency of the brown macroalga Padina boergesenii. In: Richmond, M.D., and Francis J., editors. 2001. Marine Science Development in Tanzania and Eastern Africa. Proceedings of the 20th Anniversary Conference on Advances on Marine Sciences in Tanzania. Zanzibar: IMS/WIOMSA. p.185-192.
Mebude, O.O., and Adeniyi, B. 2017. GC-MS analysis of phyto components from the stem bark of cola nitida schott and endl. Journal of Plant Sciences. 5(4): 99-103. https://doi.org/10.11648/j.jps.20170504.11
Michalak, A. 2006. Phenolic compounds and their antioxidant activity in plants growing under heavy metal stress. Polish Journal of Environmental Studies. 15(4): 523-530.
Moenne, A., Gonzáleza, A., and Sáez, C.A. 2016. Mechanisms of metal tolerance in marine macroalgae, with emphasis on copper tolerance in Chlorophyta and Rhodophyta. Aquatic Toxicology. 176: 30–37. https://doi.org/ 10.1016/j.aquatox.2016.04.015
Mohamed, A.A., Ali, S.I., Darwesh, O.M., El-Hallouty, S.M., and Sameeh, M.Y. 2015. Chemical compositions, potential cytotoxic and antimicrobial activities of nitraria retusa methanolic extract sub-fractions. International Journal of Toxicological and Pharmacological Research. 7(4): 204-212.
Newman, D. J., and Cragg, G.M. 2012. Natural products as sources of new drugs over the 30 years from 1981 to 2010. Journal of Natural Products. 75(3): 311–335. https://doi.org/10.1021/np200906s
Ohkawa, H., Ohishi. W., and Yagi, K. 1979. Assay for lipid peroxides in animal tissues by thiobarbituric acid reaction. Analytical Biochemistry. 95: 351-358. https://doi.org/10.1016/0003-2697(79)90738-3
Ozemir, G., Karabay, N.U., Dalay, M.C., and Pazarbasi, B. 2004. Antibacterial activity of volatile components and various extracts of Spirulina platensis. Phytotherapy Research. 18: 754-757. https://doi.org/10.1002/ptr.1541
Olivares, H.G., Lagos, N.M., Gutierrez, C.J., Kittelsen, R.C., Valenzuela, G.L., and Lillo, M.E.H. 2016. Assessment oxidative stress biomarkers and metal bioaccumulation in macroalgaefromcoastal areas withmining activities in Chile. Environmental Monitoring Assess. https://doi.org/10.1007/s10661-015-5021-5.
Patil, A., and Jadhav, V. 2014. GC-MS analysis of bioactive components from methanol leaf extract of Toddalia asiatica (L.) International Journal of Pharmaceutical Sciences Review and Research. 29(1): 18-20.
Pellegrini, Re. R. N., Proteggente, A., Pannala, A., Yang, M., and Rice-Evans, C. 1999. Antioxidant activity applying improved ABTS radical cationdecolorization assay. Free Radical Biology and Medicinal. 26: 1231-1237. https://doi.org/10.1016/S0891-5849(98)00315-3
Pinto, E., Sigaud-Kutner, T.C.S., Leitao, M.A.S., Okamoto, O.K., Morse, D., and Colepicolo, P. 2003. Heavy metal-induced oxidative stress in algae. Journal of Phycology. 39: 1008–1018. https://doi.org/10.1111/j.0022-3646.2003.02-193.X
Prakash, A., and Suneetha, V. 2014. Punica granatum (Pomegranate) rind extract as a potent substitute for L-ascorbic acid with respect to the antioxidant activity. Research Journal of Pharmaceutical, Biological and Chemical Sciences. 5(2): 597-603.
Prescott G.W. 1978. How to know the fresh water algae. Iowa : Brown Company publishers. p.12-267.
Prescott G.W. 1982. Algae of the western great lakes area W.M.C. Iowa: Brown Company Publishers. 1-977.
Quettier, D.C., Gressier, B., Vasseur, J., Dine, T., Brunet, C., Luyckx, M.C., Cayin, J.C., Bailleul, F., and Trotin, F. 2000. Phenolic compounds and antioxidant activities of buckwheat (Fagopyrum esculentum Moench) hulls and flour. Journal of Ethnopharmacol. 72: 35-42. https://doi.org/10.1016/ S0378-8741(00)00196-3
Rahbar, N., Shafaghat, A., and Salimi, F. 2012. Antimicrobial activity and constituents of the hexane extracts from leaf and stem of Origanum vulgare L. ssp. Viride (Boiss.) Hayek. growing wild in Northwest Iran. Journal of Medicinal Plants Research. 6(13): 2681-2685. https://doi.org/10.5897/ JMPR11.1768
Ranganathan, S., Halagowder, D., and Sivasithambaram , N.D. 2015. Quercetin suppresses twist to induce apoptosis in MCF-7 breast cancer cells. PLoS One. 10(10): p. e0141370. https://doi.org/10.1371/journal.pone.0141370
Rausch, T. 1981. The estimation of microalgal protein content and its meaning to the evaluation of algal biomass I. Hidrobiologia. 78: 237–251. https://doi.org/10.1007/BF00008520
Rice-Evans, C.A., Miller, N.J., and Paganga, G. 1996. Structure-antioxidant activity relationships of flavonoids and phenolic acids. Free Radical Biology and Medicine. 20(7): 933-956. https://doi.org/10.1016/0891-5849(95) 02227-9
Rollas, S., and Kücükgüzel, S.G. 2007. Biological activities of hydrazine derivitives. Molecules. 12(8): 1910-1939. https://doi.org/10.3390/1208 1910
Sáeza, C.A., Roncarati, F., Moenne, A., Moody, A.J., and Brown, M.T. 2015. Copper-induced intra-specific oxidative damage and antioxidant responses in strains of the brown alga Ectocarpus siliculosus with different pollution histories Claudio. Aquatic Toxicology. 159: 81–89. https://doi.org/ 10.1016/j.aquatox.2014.11.019
Sakihama, Y., Cohein, M.F., Grace, S.C., and Yamasaki, H. 2002. Plant phenolic antioxidant and prooxidant activities: phenolics-induced oxidative damage mediated by metals in plants. Toxicology. 177(1): 67-80. https://doi. org/10.1016/S0300-483X(02)00196-8.
Satoh, K. 1978. Serum lipid peroxide in cerebrovascular disorders determined by a new colorimetric method. Clinica Chimica Acta. 90: 37-43. https://doi.org/10.1016/0009-8981(78)90081-5
Sayik, A., Serguzel, A., Yusufoglu, A.S., Acik, L., Turker, G., Aydin, B., and Arslan, L. 2017. DNA- binding, biological activities, and chemical composition of wild growing epilobium angustifolium L. extracts from Canakkale, Turkey. Journal of Turkish Chemical Society. 4(3): 811-840. https://doi.org/10.18596/jotcsa.319789
Scott, A.C. 1989. Laboratory control of antimicrobial therapy. In: Collee J.G., et al., editor. Practical Medical Microbiology. 13th ed. Edinburgh: Churchill Livingstone. p.161.
Shalaby E. 2011. Algae as promising organisms for environment and health. Plant Signaling and Behavior. 9: 1338-1350. https://doi.org/10.4161 /psb.6.9.16779.
Shalaby, E.A., and Dubey, K. 2018. Polysaccharides form cyanobcteria: response to biotic and abiotic stress and their antiviral activity. Indian Journal of Geo-Marine Sciences. 47(1): 21-33.
Shanab, S.M., Mostafa, S.S., Shalaby, E.A., and Mahmoud, G.I. 2012. Aqueous extracts of microalgae exhibit antioxidant and anticancer activities. Asian Pacific Journal of Tropical Medicine. 2:608-615. https://doi.org/10.1016/ S2221-1691(12)60106-3
Snedecor, G.W., and Cochran, W.G. 1982. Statistical methods. Iowa: The Iowa State University Press. p. 507.
Sosa, A.A., Bagi1, S.H., and Hameed, I.H. 2016. Analysis of bioactive chemical compounds of Euphorbia lathyrus using gas chromatography-mass spectrometry and Fourier-transform infrared spectroscopy. Journal of Pharmacognosy and Phytotherap. 8(5): 109-126. https://doi.org/ 10.5897/JPP2015.0371
Srivastava, R., Mukerjee, A., and Verma, A. 2015. GC-MS analysis of phytocomponents in, pet ether fraction of wrightiatinctoria seed. Pharmacognosy Journal. 7(4): 249-253. https://doi.org/10.5530/pj. 2015.4.7
Stanier, R.Y, Kunisawa, R., Mandel, M., and Cohen-Bazire, G. 1971. Purification and properties of unicellular blue-green algae (Order Chroococcales). Bacteriollogical Reviews. 35: 171-205.
Taga, M.S., Miller, E.E., and Pratt, D.E. 1984. Chia seeds as a source of natural lipid antioxidants. Journal of American and Oil Chemistry Society. 61: 928–931. https://doi.org/10.1007/BF02542169
Talukdar, J. 2012. Influences of dissolved inorganic carbon and nitrogen sources on growth, total lipid content and calorific value of freshwater oleaginous microalga Ankistrodesmus falcatus (Corda) Ralfs. Environmental Engineering and Management Journal. 61: 14-25. https://doi.org/ 10.5755/jo1.erem.61.3.1423
Venkatesh, R., Vidya, R., and Kalaivani, K. 2014. Gas chromatography and mass spectrometry analysis of solanumvillosum (mill) (solanaceae). International Journal of Pharmaceutical Sciences and Research. 5(12): 5283-5287. https://doi.org/10.13040/IJPSR.0975-8232.5(12)5283-87
Westerink, W.M.A., and Schoonen, W.G.A.J. 2007. Cytochrome P450 enzyme levels in HepG2 cells and cryopreserved primary human hepatocytes and their induction in HepG2 cells. Toxicology In Vitro. 21(8): 1581-1591. https://doi.org/10.1016/j.tiv.2007.05.014
Widayat Philia, J., and Wibisono, J. 2018. Cultivation of microalgae Chlorella sp on fresh water and waste water of tofu industry. E3S Web Conf. 31: 1-3. The 2nd International Conference on Energy, Environmental and Information System. https://doi.org/10.1051/e3sconf/20183104009
Yen, G.C., and Chen, H.Y. 1995. Antioxidant activity of various tea extracts in relation to their antimutagenecity. Journal of Agriculture and Food Chemistry. 43: 27–37. https://doi.org/10.1021/jf00049a007
Zhang, S., Caol. L., Wang, Z.R., Li, Z., and Ma, J. 2018. Anti-cancer effect of toosendanin and its underlying mechanisms. Journal of Asian Natural Products Research. 9: 1-13. https://doi.org/10.1080/10286020.2018. 1451516
Zouari, M., Ahmed, C.B., Elloumi, N., Bellassoued, K., Delmail, D., Labrousse, P., Abdallah, F.B., and Rouina, B.B. 2016. Impact of proline application on cadmium accumulation, mineral nutrition and enzymatic antioxidant defense system of Oleaeuropaea L. Cv Chemlali exposed to cadmium stress. Ecotoxicology and Environmental Saftey. 128: 195–205. https://doi.org/10.1016/j.ecenv.2016.02024
Eman A. El-fayoumy1, Sanaa M. M. Shanab1, and Emad A. Shalaby2*
1Department of Botany and Microbiology, Faculty of Science, Cairo University, 12613 Giza, Egypt
2Department of Biochemistry, Faculty of Agriculture, Cairo University, 12613 Giza, Egypt
*Corresponding author. E-mail: dremad2009@yahoo.com
Total Article Views
Article history:
Received: March 8, 2019;
Revised: June 6, 2019;
Accepted: July 6, 2019