 ISSN: 2822-0838 Online

Nutritional and Bioactive Compounds in Coconut Meat of Different Sources: Thailand, Indonesia and Vietnam Chitraporn Ngampeerapong and Visith Chavasit*
Published Date : 2019-09-20
DOI : https://doi.org/10.12982/CMUJNS.2019.0037
Journal Issues :
Number 4 , October-December 2019
ABSTRACT
The ASEAN economic forum creates trade and exchange in agricultural produce among member countries. Due to seasonal shortages, coconut is one agricultural product that is traded among ASEAN countries. Although these coconuts are mainly of the same species (Cocos nucifera L.), differences in cultivation and environmental conditions may affect the chemical composition of the coconut meat, which can consequently affect on quality consistencies of the coconut meat-containing food products. Coconut meat samples from Thailand, Indonesia, and Vietnam were assessed for macronutrients and potential bioactive compounds. Results showed that macronutrients and antioxidant activity in the coconut meats of the studied countries were not so much different, except for total phenolic compounds in the coconut meat from Vietnam was 30% higher than the others. The phytosterol content mainly as beta-sitosterol was highest in the coconut meat from Indonesia. Fatty acids profiles from these sources had mostly the same patterns. Ninety percent of fat was comprised of saturated fatty acid, which 60% as medium chain fatty acid (C8-C13) and 30% as long chain fatty acid (> C14). The qualities coconut meats from the studied 3 countries were quite similar and should not cause any differences in the contents of macronutrients and bioactive compounds in the finished products.
Keywords: Bioactive compounds, Coconut meat, Food industry, Macronutrients
INTRODUCTION
Coconut (Cocos nucifera L.) has been widely grown in Southeastern Asian countries for centuries. These countries are the world’s main exporters of coconut meat containing products of various types, such as coconut milk, coconut chips, desiccated coconut, and virgin coconut oil. (Office of Agricultural Economics Ministry of Agriculture and Cooperatives, 2016). Recently, coconut products have become a fast growing exported food of Thailand (SME Thailand NEWS, 2017). Due to rapid economic development in the region, plants of higher economic values have drastically replaced coconut farming areas in the region. On the contrary, a stronger demand for coconut products has risen significantly as more and more claims about the health benefits of these products are being made worldwide, especially for coconut milk and virgin coconut oil. The advent of stronger demand, improper agricultural zoning policies, drought, flooding as well as plant diseases led to a shortage in domestic coconut supplies, which became a serious problem for countries in the region and led to exchange of coconuts among their neighboring countries. The raw materials from different growing areas can have different qualities, which directly effect on the quality and efficacy of the coconut-meat containing products. In responding to the coconut regional trade concern, the objective of this study was to evaluate the differences in certain chemical characteristics of the commercially used coconut meats from 3 different geographical sources, which can influence qualities of the subsequent coconut meat containing products being available in the market.
MATERIALS AND METHODS
Coconut meat
Mature coconut (Cocos nucifera L.) fruits aged 9-12 months that were sent for industrial uses at Theppadungporn Coconut Co., Ltd., Nakhonpathom, Thailand from 3 sources i.e. (i) Palembang, Indonesia, (ii) Ben Tre, Vietnam and (iii) Prachubkerikhan, Thailand. The transportation periods on the containers from Indonesia and Vietnam to the factory were normally 15 days, while within Thailand was 3 days. Three batches of peeled, shredded, fresh, mature coconut meat from 10 fruits per batch from the mentioned sources were kept in tightly closed glass bottles at -20 °C before analysis.
Chemical analysis
Macronutrient. Moisture content was analyzed by drying a weighed sample in a hot air oven until constant weight was obtained (AOAC INTERNATIONAL, 2012). Total fat content was determined extracting the hydrolyzed sample with petroleum ether in a Soxtec system (Model HT 1043, Tecator Co., Ltd., Sweden) (AOAC INTERNATIONAL, 2012). Protein content was analyzed according to the Kjeldahl method (AOAC INTERNATIONAL, 2012), in which 6.25 was used as the multiplication factor for converting total nitrogen into protein content. Ash content was determined after a sample had been burnt in a muffle furnace at 550°C for 2.5 h (AOAC INTERNATIONAL, 2012). Carbohydrate was calculated by subtracting moisture, fat, protein, and ash contents from 100 (FAO, 1998).
Fatty acid profile. The extracted oil from coconut meat was saponified with 0.5 M potassium hydroxide in methanol at 95oC, and methylated into fat- ty acid methyl esters (FAMEs) by adding 14% Boron trifluoride in methanol. FAMEs were analyzed on a DB-23 capillary column (60 m x 0.25 mm I.D.,
0.25 μm) installed in an Agilent 9860 gas chromatography (GC) system equipped with a flame ionization detector and a split/splitless injector (Agilent Technologies, Santa Clara, California, USA) (Petrović Kezić and Bolanča, 2010). Methyl heptadecanoate, C17:0, was used as the internal standard. The Supelco™ 37 Component FAME Mix (10 mg/ml) which consisted of 37 FAMEs as C4:0 to C24:1 including saturated, monounsaturated and polyunsaturated FAMEs at 2-6 % wt/wt of each FAMEs was used as the standard which provided the relative retention times for peak identification and standard curve development for each fatty acid. The peak area was adjusted according to peak area of the internal standard. The detection limit was at 0.1- 0.5 μg/ml.
Total phenolic content, phenolic acid and flavonoids. Shredded coconut meat was extracted with 80% methanol. The extract was used to determine total phenolic content, phenolic acid, and flavonoids. Total phenolic content was analyzed by using Folin-Ciocalteu assay (Singleton and Rossi, 1965) at the absorbance of 755 nm on a spectrophotometer (UV1601, Shimadzu, Kyoto, Japan). The total phenolic content was determined using the standard curve of gallic acid (0.04-0.20 mg/ml). Phenolic acid and flavonoids were determined using High Performance Liquid Chromatography (HPLC) (Lee et al., 2002) with Synergi Hydro-RP column (4 μm particle, 250 x 4.60 mm id, Phenomenex, Torrance, California, USA) and Allsphere ODS-2 as a guard column (10 x 4.6 mm id, Alltech, Deerfield, Illinois, USA). The mobile phases were acetonitrile (mobile phase A) and 3% glacial acetic acid in deionization water (mobile phase B). The initial ratio as 5% mobile phase A, and 95% mobile phase B was applied and held for 3 min. The ratio was linearly increased to 25% mobile phase A in 27 min, and then 75% mobile phase A in 5 min. The post run was performed for 5 min with the mobile phases of the initial ratio. The injection volume was 10 µl and flow rate of 1 ml/min was used. Phenolic acid and flavonoids were detected at 260, 280, and 320 nm by a photodiode array detector. The standards used included chlorogenic acid, orcinol, caffeic acid, epicatechin, caffeine, p-coumeric acid, ferulic acid, rutin, Q-3-rhamnoside, hesperetin, phloridzin, resveratrol, and kaempferol.
Phytosterols. After being saponified, 50 μl of 0.2 mg/ml Δ7-cholesterol was added to the shredded coconut meat as the internal standard. Thereafter, phytosterols were extracted by hexane. The extract was dried under nitrogen gas and dissolved in chloroform: methanol solvent (1:3 v/v). The analysis was performed on a Liquid Chromatography – Atmospheric Pressure Chemical Ionization Mass Spectrometry (LC-APCI-MS/MS) with LunaTM C18 (2) column (3 μm particle, 100 x 2 mm id, Phenomenex, Torrance, Calif., USA.). A mobile phase of acetonitrile/ methanol (99:1, v/v) was used at a flow rate of 600 µl/min, and the injection volume was 3 µl. MS and APCI operations in positive ion and Selected Reaction Monitoring (SRM) modes, respectively (Mo et al., 2013).
Antioxidant activity. Shredded coconut meat was extracted with 80% methanol. Antioxidant activity in the extract was determined using Oxygen Radical Absorbance Capacity (ORAC) and Ferric Reducing Antioxidant Power (FRAP) assays using a 96-well microplate reader (Synergy HT, Bio-Tek Instruments, Winooski, Vermont, USA.) (Ou et al., 2002). The ORAC value was determined using the Trolox standard curve of 3.125- 100 µM in 75 mM phosphate buffer pH 7.4. The FRAP value was determined using the Trolox standard curve of 7.8125-250 µM in deionized water.
Statistical analysis
Difference among mean values (P = 0.05) was determined by using One way Analysis of Variance (ANOVA) and Duncan’s multiple range test with the IBM SPSS Statistics 19.0TM software (IBM Corp., Armonk, New York, USA).
RESULTS
Nutrients
The macronutrients in coconut meat from different sources i.e. Thailand, Indonesia and Vietnam are shown in Table 1. Most macronutrient contents were quite similar, except for fat and protein in coconut meat from Vietnam, which were slightly higher than coconut meat from the other countries. Fatty acid profiles in coconut meat from different sources largely held the same pattern (Table 1). The fatty acid profile of coconut was not affected by growing location. Saturated fatty acids contributed up to 90% of the total fat for coconut meat from different sources. Lauric acid (C12:0) is the major fatty acid found in the coconut meat of up to 50% of total fatty acid. However, the contents of medium chain fatty acids (MCFA) (C8-C13) in the coconut meats of these sources were generally similar which were up to 60 % of total fat. The long chain saturated fatty acid in coconut meat instead was found in lesser amount (30% of total fat) (Table 1). In our study, we found no significant difference (P > 0.05) among the three different sources. Contents of certain fatty acids (C18:1 and C18:2) found in coconut meat from Vietnam were slightly higher but significance (P ≤ 0.05) than the ones from other sources.
Table 1. Macronutrient and fatty acid profile in coconut meat from different sources1,2.
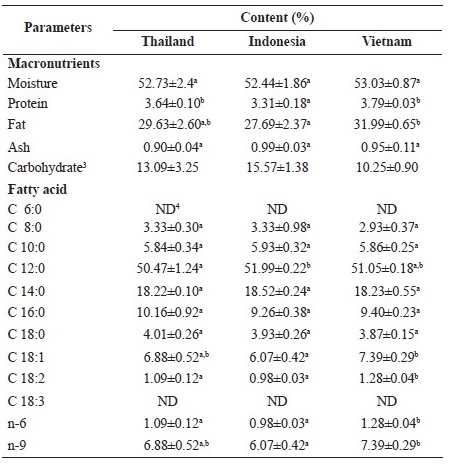
Table 2. Cont.
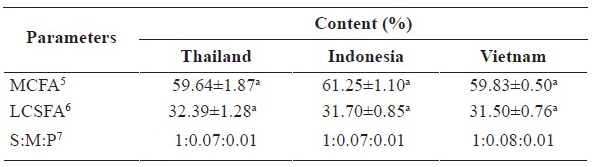
Note: 1Results are presented as mean ± standard deviation (SD) (n=3); 2Means within the same row with different superscripts are significantlydifferent (P < 0.05); 3Carbohydrate was calculated by subtracting moisture, protein, fat and ash from 100; 4ND = Not detected; 5MCFA = Medium chain fatty acids; 6LCSFA = Long chain saturated fatty acids; 7S: Saturated fatty acid; M: Monounsaturated fatty acid; P: Polyunsaturated fatty acid.
Bioactive compounds and antioxidant activity
Total phenolic content in the coconut meat from Vietnam was about 30% more than what was found for other countries (P < 0.05) (Table 2). In addition, coconut meat extracts from different sources showed sets of peaks that could be assumed to be phenolic acids and flavonoids. However, the retention times found during HPLC analysis could not be identified from the available standards (chromatograms were not showed). The higher total phenolic content of the coconut meat from Vietnam affected higher antioxidant activity as ORAC but not FRAP (Table 2). FRAP values of coconut meat from all sources were not significantly different (P > 0.05). Table 2 indicates that the same pattern of phytosterol in coconut meat from different sources. The phytosterol content found in the coconut meat from these sources ranged only from 19-26 mg per 100 g. However, the total phytosterol content in coconut meat from Indonesia was significantly higher than the others (P ≤ 0.05). β-sitosterol was the main phytosterol found and accounted more than 50% of the total content.
Table 2. Total phenolic content, phytosterols and antioxidant activities in coconut meat from different sources1,2,3
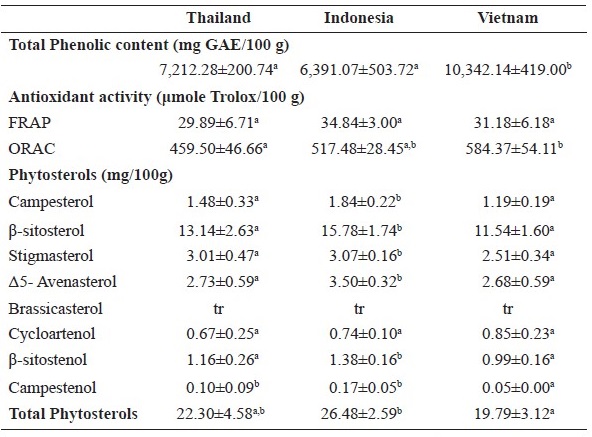
Note: 1Results are presented as mean ± standard deviation (SD) (n=3); 2Means within the same row with different superscripts are significantly different (P < 0.05); 3tr = trace.
DISCUSSION
Due to the increasing demand of coconut used in the industry, the importation of coconut from neighboring countries is needed. Even plants of the same species, differences in cultivation and environmental conditions could affect in the chemical composition of the fruits. Differences in macronutrient contents could be expected, since some studies have shown that macronutrients of a plant can be influenced by climate, soil, and plantation factors (Koyuncu et al., 2014). Fortunately, this situation is rarely found in coconut meat as well as in our study. Previous studies have found that coconut meat from Indonesia and Pakistan cultivars differed only in moisture and ash contents but not in other nutrients (Santoso et al., 1996). These studies also indicated that coconut meat macronutrients from different sources showed little difference.
In our study, fat and protein content in coconut meat from Vietnam were slightly higher than in others. Fat content is mentioned in the international standard as a quality indicator for grading certain coconut products. Codex Alimentarius, CODEX has categorized desiccated coconut, coconut milk and cream products by their fat contents (CODEX STAN 177-1991, CODEX STAN 240-2003). Fat content in coconut meat directly affects the yield of coconut oil and virgin coconut oil. Protein acts as an emulsifier, the quality and quantity of which could affect the stability of processed coconut milk and cream, i.e., pasteurized, canned, and ultraheat treated. Protein in coconut extract as milk or cream combines water and fat to become oil in water emulsion.
Ninety percent of fat in coconut meat was saturated fatty acids, which nutritionally was classified as the main source of saturated fatty acid. In terms of physical and sensory characteristics, the degree of coconut fat saturation however provides desirable unique qualities for consumers. Being different and unique from other tropical oil plants, the saturated fatty acids in coconut fat mainly consist of up to 60% of total fat as medium chain fatty acids (MCFA) (C8-C13), which is the different subclass from the long chain fatty acid (≥ C14) as classified by Food and Agricultural Organization of United Nations (FAO, 2010). These profiles were in the same trend as reported by Appaiah in 2015 (Appaiah et al., 2015). Lauric acid (C12:0) is most dominant fatty acid found in the coconut meat. As compared to the other plant-origin saturated fatty acids i.e. myristic acid (C14:0) and palmitic acid (C16:0), lauric acid tends to have more health benefit since it can also increase more of the blood HDL-cholesterol (Mensink, 2016). However, lauric acid becomes healthier due to its effect on reducing the ratio of TC/HDL-cholesterol (Mensink, 2016). The few amounts of long chain fatty acids in coconut meat should not contribute to the physicochemical properties of coconut meat and their subsequent products, as well as health benefits, since available contents were quite low.
Climate, cultivar, maturity, and growing environment could affect phenolic compound contents. Various types of phenolic compounds, such as phenolic acids, flavonoids, anthocyanins, and tannins, are the secondary metabolites of plants. Most of their functions are associated with health benefits, e.g., anti-aging and aged-related diseases, anticancer, anti-inflammation, and reducing the risk of cardiovascular disease against damage from free radical molecules in cells (Haminiuk et al., 2012). Our study showed high contents of unidentifiable phenolic compounds and flavonoids, which is similar to a previous study (Obidoet al., 2010) that analyzed for flavonoid in the extracts of coconut meat with water and hexane. As a gas chroma- tography - mass spectrometry (GC-MS) was used for analysis of matured coconut meat, salicylic acid, p-hydroxybenzoic acid, syringic acid, m-coumaric acid, p-coumaric acid, gallic acid, caffeic acid, and catechin were identified as its main phenolic compounds (Mahayothee et al., 2016)
Phytosterols are normally found in plant seeds. Coconut meat, which is the endosperm of the coconut seed, was also expected to be a good source of phytosterols. However, the phytosterol content in the coconut meat was much lower than what has been found for various nuts that ranged from 72-220 mg per 100 g (Ros, 2010). Our results showed the same pattern of phytosterol in coconut meat from different sources but the total content of phytosterol was higher in coconut meat from Indonesia. Content and composition of phytosterols could vary among crops, planting location, and temperature (Vlahakis and Hazebroek, 2000). High growing temperature could increase the quantity of total phytosterol and also affect its quality, such as increases in campesterol and decreases in stigmasterol and β-sitosterol. Phytosterols, which have a similar chemical structure to cholesterol, could play a significant role in reducing blood cholesterol by lowering cholesterol absorption in the small intestine (Ostlund, 2004). By consuming fresh coconut meat with the available phytosterol content, the mentioned health benefits should not be achieved, however the health benefit should be found more in the oil-based coconut product, since phytosterols are naturally hydrophobic.
Antioxidant activity could also be influenced by other factors, such as plant variety, growing location, and harvesting season (Ou et al., 2002). Since ORAC and FRAP were analyzed in terms of different reaction mechanisms, we found no linear correlation between the ORAC and the FRAP values (no data reported), which was similar to the study by Ou et al. (2002). Since most phenolic compounds are hydrophilic, their health benefits should be found only in products like desiccated coconut, coconut milk and cream, and coconut milkpowder that were associated with coconut meat as such or as a water-based extract, but not in oil-based products, i.e. coconut oil.
CONCLUSION
The coconut meats from the 3 different countries contained slightly different amounts of macronutrients and bioactive compounds. It is therefore feasible to share the coconut raw material among these 3 ASEAN countries with minimum concern on their effect on quality consistencies of the final products i.e. coconut milk, desiccated coconut and virgin coconut oil.
ACKNOWLEDGEMENTS
This study was funded by the Thailand Research Fund and Theppadungporn Coconut Co., Ltd. under The Research and Researcher for Industry project (Grant No. PHD57I0055). We are grateful to Mr. Robert W. Durst and Mr. Jeff Morre, Oregon State University, USA, for their assistance in HPLC analysis of phenolic acid and flavonoids and LC-APCI-MS/MS analysis of phytosterols.
REFERENCES
Appaiah, P., Sunil, L., Kumar, P.K., and Krishna, A.G. 2015. Physico-chemical characteristics and stability aspects of coconut water and kernel at different stages of maturity. Journal of Food Science and Technology. 52(8): 5196-5203. https://doi.org/10.1007/s13197-014-1559-4
AOAC INTERNATIONAL. 2012. Official Methods of Analysis of AOAC INTERNATIONAL Official Method 952.08. 19th ed., Gaithersburg, MD. CODEX STAN 177-1991. 1991. Sandard for grated desiccated coconut. Retrieved from http://down.40777.cn/stardard/10/CODEX%20STAN%
20178-1991%20CODEX%20STANDARD%20FOR%20GRATED%20 DESICCATED%20COCONUT.pdf.
CODEX STAN 240-2003. 2003. Standard for aqueous coconut products – coconut milk and coconut cream. Retrieved from http://www.fao.org/ fao-who-codexalimentarius/sh-proxy/zh/?lnk=1&url=https%253 A%252F%252Fworkspace.fao.org%252Fsites%252Fcodex%252 FSta nda rds%252FCODE X%2BSTAN%2B240-2003%252
FCXS_240e.pdf.
FAO. 1998. Carbohydrates in human nutrition: report of a joint FAO/WHO expert consultation FAO Food and Nutrition Paper no. 66. Rome: FAO
FAO. 2010. Fats and fatty acids in human nutrition: report of an expert consultation. Rome: Food and Agricultural Organization of United Nations.
Haminiuk, C.W.I., Maciel, G.M., Plata-Oviedo, M.S.V., and Peralta, R.M. 2012. Phenolic compounds in fruits – an overview. International Journal of Food Science and Technology. 47(10): 2023-2044. https://doi.org/10. 1111/j.1365-2621.2012.03067.x
Koyuncu, F., Çetinbaş, M., and Ibrahim, E. 2014. Nutritional constituents of wild-grown black mulberry (Morus nigra L.). Journal of Applied Botany and Food Quality. 87: 93-96. https://doi.org/10.5073/JABFQ. 2014.087.014
Lee, J., Durst, R.W., and Wrolstad, R.E. 2002. Impact of juice processing on blueberry anthocyanins and polyphenolics: comparison of two pre- treatments. Journal of Food Science. 67(5): 1660-1667. https://doi.org/ 10.1111/j.1365-2621.2002.tb08701.x
Mahayothee, B., Koomyart, I., Khuwijitjaru, P., Siriwongwilaichat, P., Nagle, M., and Müller, J. 2016. Phenolic compounds, antioxidant activity, and medium chain fatty acids profiles of coconut water and meat at different maturity stages. International Journal of Food Properties. 19(9): 2041-2051. https://doi.org/10.1080/10942912.2015.1099042
Mensink, R.P. 2016. Effects of saturated fatty acids on serum lipids and lipoproteins: a systematic review and regression analysis. Geneva: World Health Organization.
Mo, S., Dong, L., Hurst, W.F., and van Breemen, R.B. 2013. Quantitative analysis of phytosterols in edible oils using APCI liquid chromatography-tandem mass spectrometry. Lipids. 48(9): 949-956. https://doi.org/10.1007/ s11745-013-3813-3
Obido, O., Joshua, P.E., and Eze, N.J. 2010. Phytochemical analysis of
Cocos Nucifera L. Journal of Pharmacy Research. 3(2): 280-286.
Office of Agricultural Economics Ministry of Agriculture and Cooperatives. 2016. Agricultural Statistics of Thailand 2016. Bangkok: Office of Agricultural Economics Ministry for Agriculture and Cooperatives.
Ostlund, R.E. 2004. Phytosterols and cholesterol metabolism. Current Opinion in Lipidology. 15: 37-41.
Ou, B., Huang, D., Hampsch-Woodil, M., Flanagan, J.A., and Deemer, E.K. 2002. Analysis of antioxidant activities of common vegetables employing oxygen radical absorbance capacity (ORAC) and ferric reducing antioxidant power (FRAP) assays: a comparative study. Journal of Agricultural and Food Chemistry. 50(11): 3122-3128. https://doi.org/10.1021/jf0116606
Petrović, M., Kezić, N., and Bolanča, V. 2010. Optimization of the GC method for routine analysis of the fatty acid profile in several food samples. Food Chemistry. 122: 285-291. https://doi.org/10.1016/j.food chem.2010.02.018
Ros, E. 2010. Health benefits of nut consumption. Nutrients. 2: 652-682 https:// doi.org/10.3390/nu2070652
Santoso, U., Kubo, K., Ota, T., Tadokorob, T., and Maekawa, A. 1996. Nutrient composition of kopyor coconuts (Cocos nucifera L.). Food Chemistry. 57(2): 299-304. https://doi.org/10.1016/0308-8146(95)00237-5
Singleton, V.L., and Rossi, J.A. 1965. Colorimetry of total phenolics with phosphomolybdic-phosphotungstic acid reagents. American Journal of Enology and Viticulture. 16: 144-158.
SME Thailand Club. 2017. SME Thailand News. Retrieved from: http:// www.smethailandclub.com/entrepreneur-2347-id.html
Vlahakis, C., and Hazebroek, J. 2000. Phytosterol accumulation in canola, sunflower, and soybean oils: effects of genetics, planting location, and temperature. Journal of American Oil Chemists’ Society. 77(1): 49-53. https://doi.org/10.1007/s11746-000-0008-6
Chitraporn Ngampeerapong1 and Visith Chavasit2*
1Division of Food Science and Technology, Faculty of Engineering and Agro-Industry, Maejo University, Chiang Mai 50290, Thailand
2Food Cluster, Institute of Nutrition, Mahidol University, Nakhon Pathom 73170, Thailand
*Corresponding author. E-mail:vchavasit@gmail.com,visith.cha@mahidol.ac.th
Total Article Views
Article history:
Received: January 14, 2019;
Revised: April 19, 2019;
Accepted: April 24, 2019