 ISSN: 2822-0838 Online

Multiple Regression Model for Forecasting Quantity of Supply of Off-season Longan
Chompoonoot Kasemset*, Nisachon Sae-Haew and Apichat SopadangPublished Date : 2019-08-28
DOI : 10.12982/CMUJNS.2014.0044
Journal Issues : Number 3, September - December 2014
Abstract
This research work aims to develop a forecasting model to predict the quantity of supply of off-season longan using multiple regression technique. There are 23 factors that influence the quantity of supply of off-season longan. Data collection was done in Chiang Mai and Lamphun provinces. The forecasting model based on multiple regression techniques, with enter, forward, backward, and stepwise selection methods were adopted, and these methods yielded mean absolute percentage error (MAPE) values of 18.39%, 25.63%, 21.21%, and 25.63%, respectively. These results demonstrate that multiple regression with the enter selection method is practical to predict the quantity of supply of off-season longan.
Introduction
Longan is an important export fruit of Thailand that brings in over two billion Baht per year. The main area of longan cultivation is the northern region of Thailand, mainly the Chiang Mai and Lamphun provinces. Although the present trends show a steady rise in longan exports, the oversupply and, subsequently, and low prices of longan during its season are the main problems faced by longan’s agriculturists due to the lack of proper preparation as regards production and lack of market information. Therefore, forecasting of longan yield is necessary for agriculturists in order to plan for their market sales.
The oversupply of longan during its period of season (from July to August) causes agriculturists to face the problems of low quality and price for their produce (Sopadang et al., 2012). Thus, having a supply of off-season longan is a practical solution for them to gain more benefit.
The output of off-season longan is dependent on many parameters. Thus, the objective of this research is to create a forecasting model that predicts the quantity of off-season longan supply using the multiple regression technique. The input factors used in this research came from literature reviews and interviews of experts. The data collections were carried out in the Chiang Mai and Lamphun provinces of Thailand.
Material and Methodology
Preliminary Information
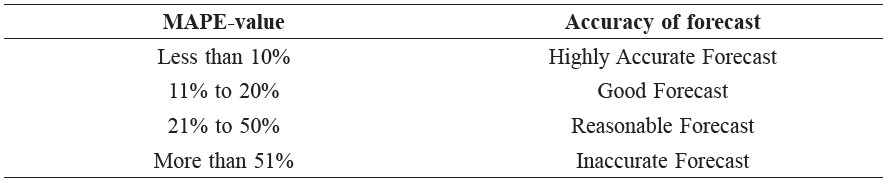
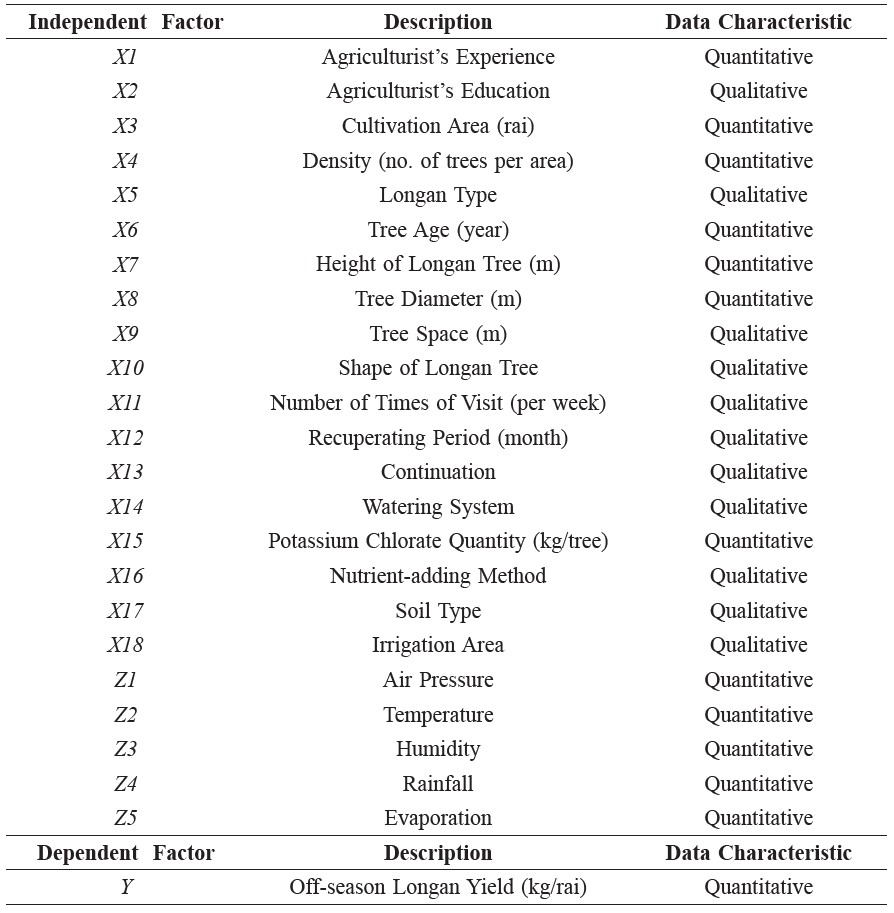
The off-season longan cultivation process is carried on during (1) May to July for the output during November to February and (2) October to November for the output during May to June. The details regarding off-season longan cultivation can be found in Manochai et al. (2005). Unfortunately, the production of off-season longan is not an easy task due to many factors, both controllable and uncontrollable, such as weather, soil, and the agriculturist’s skill (Ramingwong et al., 2011). Sopadang et al. (2008) addressed forty factors that have an effect on the quantity of supply of off-season longan, as presented in Table 1.
Table 1. Factors Related to Off-season Longan Cultivation.
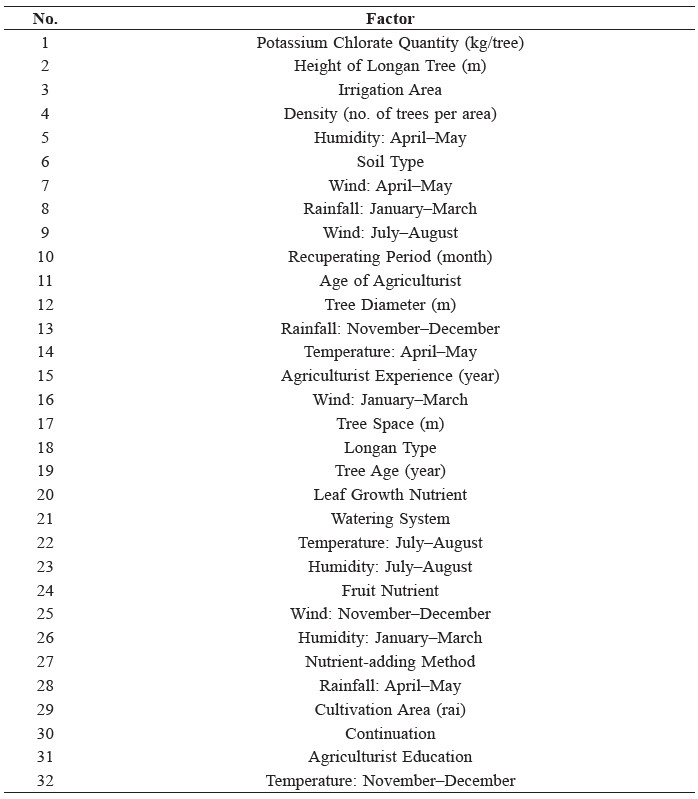
Source: Sopadang et al., 2008.
These forty factors were used in developing the forecasting model based on the artificial neural networks (ANNs) technique discussed in Leksakul and Sopadang (2012), but the disadvantage of this model is that when updated data are available, the model based on ANNs needs to be re-generated for more accuracy in its forecasting performance. The application of the ANNs forecasting model can be also found in Kasemset et al. (2012).
Due to the disadvantage posed by ANNs, this research work took it up as its aim the creation of a forecasting model that will predict the quantity of supply of off-season longan, using the multiple regression technique. The multiple regression technique is a statistical technique used for predicting the unknown value of a variable from the known value of two or more variables. The general formulation of the forecasting model, based on the multiple regression technique, is given in Equation (1):
Y = a + b1X1 + b2X2 + b3X3 +…+bkXk (1)
From Equation (1), it can be seen that there are k independent factors that influence Y as a dependent variable. In forecasting the model, Y is a forecasting value, “a” is a constant term, and “b1, b2, b3,…,bk” are the weights of the different independent variables “X.”
The applications of the multiple regression technique in the prediction of supply quantity have been addressed in various research studies; for example, Gala et al. (2003) applied this technique to predict the supply quantity of olive in Spain by taking into consideration related environmental factors and found that the amount of pollen was an important factor in predicting the supply quantity of olive. Qian et al. (2008) also applied the multiple regression technique for forecasting the supply quantity from wheat production in Canada, and the results showed that the forecasting model that was based on the multiple regression technique gave the forecasting variance as 8-10%, when compared with the mean forecasting values.
The limitations of the multiple regression technique were addressed by Brance et al. (2009) as (i) this technique is practical for exploring the linear relationships between the independent and dependent variables when the relationship follows a straight line, (ii) the dependent and the independent variables should be measured on a continuous scale, and (iii) the multiple regression technique requires a large number of observations. These limitations should be carefully considered when the multiple regression technique is adopted.
To develop a model for forecasting the quantity of supply of off-season longan, the research methodology addressed is as follows.
Data Collection
The data were collected from 95 agriculturists in three districts, Phrao, Chom Thong, and Saraphi, of Chiang Mai province and Ban Hong district of Lamphun province by using questionnaires, during 2009-2011.
Data Analysis
The collected data are tested to confirm that they are good for use in developing the forecasting model, which is based on the multiple regression technique. The first test is the goodness-of-fit test for confirming that the data are non-parametric and distribution free. After that, the data are tested to confirm the basic assumptions of the multiple regression technique, using tests such as the (1) Normal Distribution Test, (2) Linearity Test, (3) Homogeneity of Variance Test, and (4) Multicollinearity Test.
Model Development
In this step, all the collected data are analyzed using PASW Statistics 18. Four selection methods, namely (1) Enter, (2) Forward, (3) Backward, and (4) Stepwise, are adopted to develop the forecasting model based on the multiple regression technique. The forecasting model based on the multiple regression technique provides a set of independent variables which also present an estimated score on each dependent variable. From this step, the formulation of the forecasting model is performed in the form of Equation (1), as addressed previously.
Model Verification and Validation
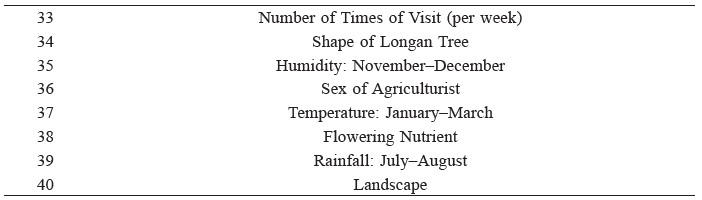
Among the various forecasting models with different selection methods for multiple regression models, MAPE comparison is conducted to finalize the selection of a practical model. The best-fit forecasting model is selected from among the four selection methods by considering the values of the mean absolute percent error (MAPE) which is calculated using the formula given in Equation (2):
where “Xt” is the real data at time “t” and “Ft” is the forecasting value at time “t”.
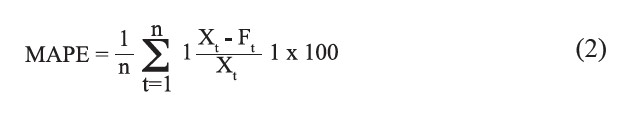
By taking into consideration the MAPE-value, Lewis, C.D., (1982) proposed an interpretation of the MAPE results to judge the accuracy of the forecasting model, as given in Table 2.
Table 2. Interpretation of MAPE Results for Forecasting Accuracy.
Source: Lewis, C.D., 1982.
Results
Data Preparation and Analysis
From the four study areas, the details of the agriculturists are presented in Table 3 and the off-season longan yields during 2009–2011 are presented in Figure 1.
Table 3. Number of Agriculturists in Each Study Area.
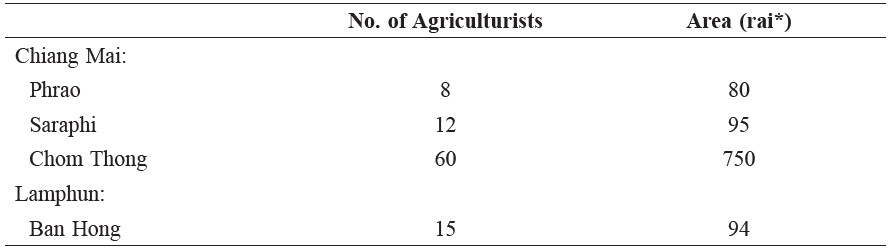
Note: *1 rai = 1,600 m2 or 0.395 acres.
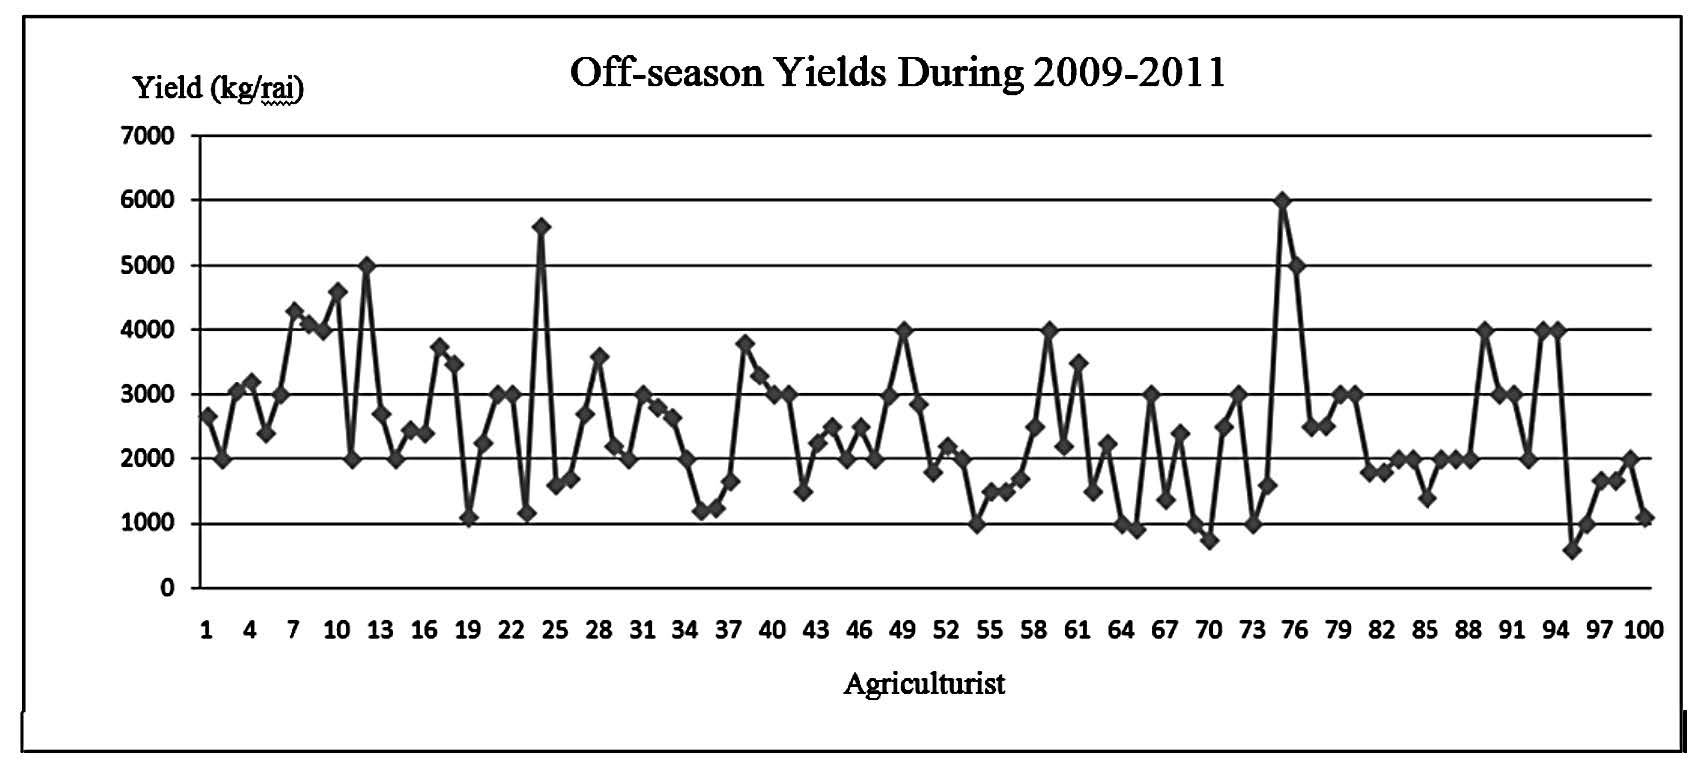
Figure 1. The off-season longan yields during 2009–2011.
From Figure 1, it can be observed that the yields of off-season longan are random, from 400 kg/rai to 6000 kg/rai. Thereafter, all the collected data are tested to confirm, using the following tests: (1) goodness-of-fit test, (2) normal distribution test, (3) linearity test, (4) homogeneity of variance test, and (5) multicollinearity test. The results of these tests are presented in Table 4 and Figure 2.
Table 4. Test Results of Collected Data.
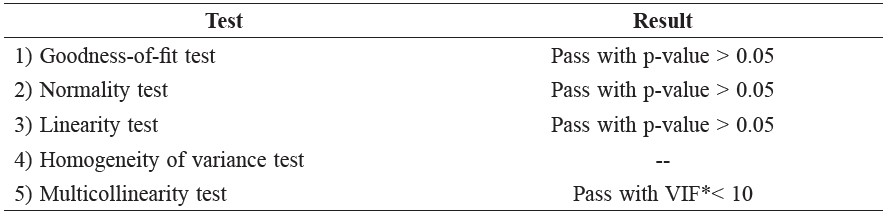
Note: VIF = Variance Inflation Factor.
Table 4 and Figure 2 presented the results of multiple regression assumption tests. Data used to develop forecasting model in this study satisfied all assumptions when p-value for all test were greater than 0.05 and VIF values for multicollineaity test were less than 10.
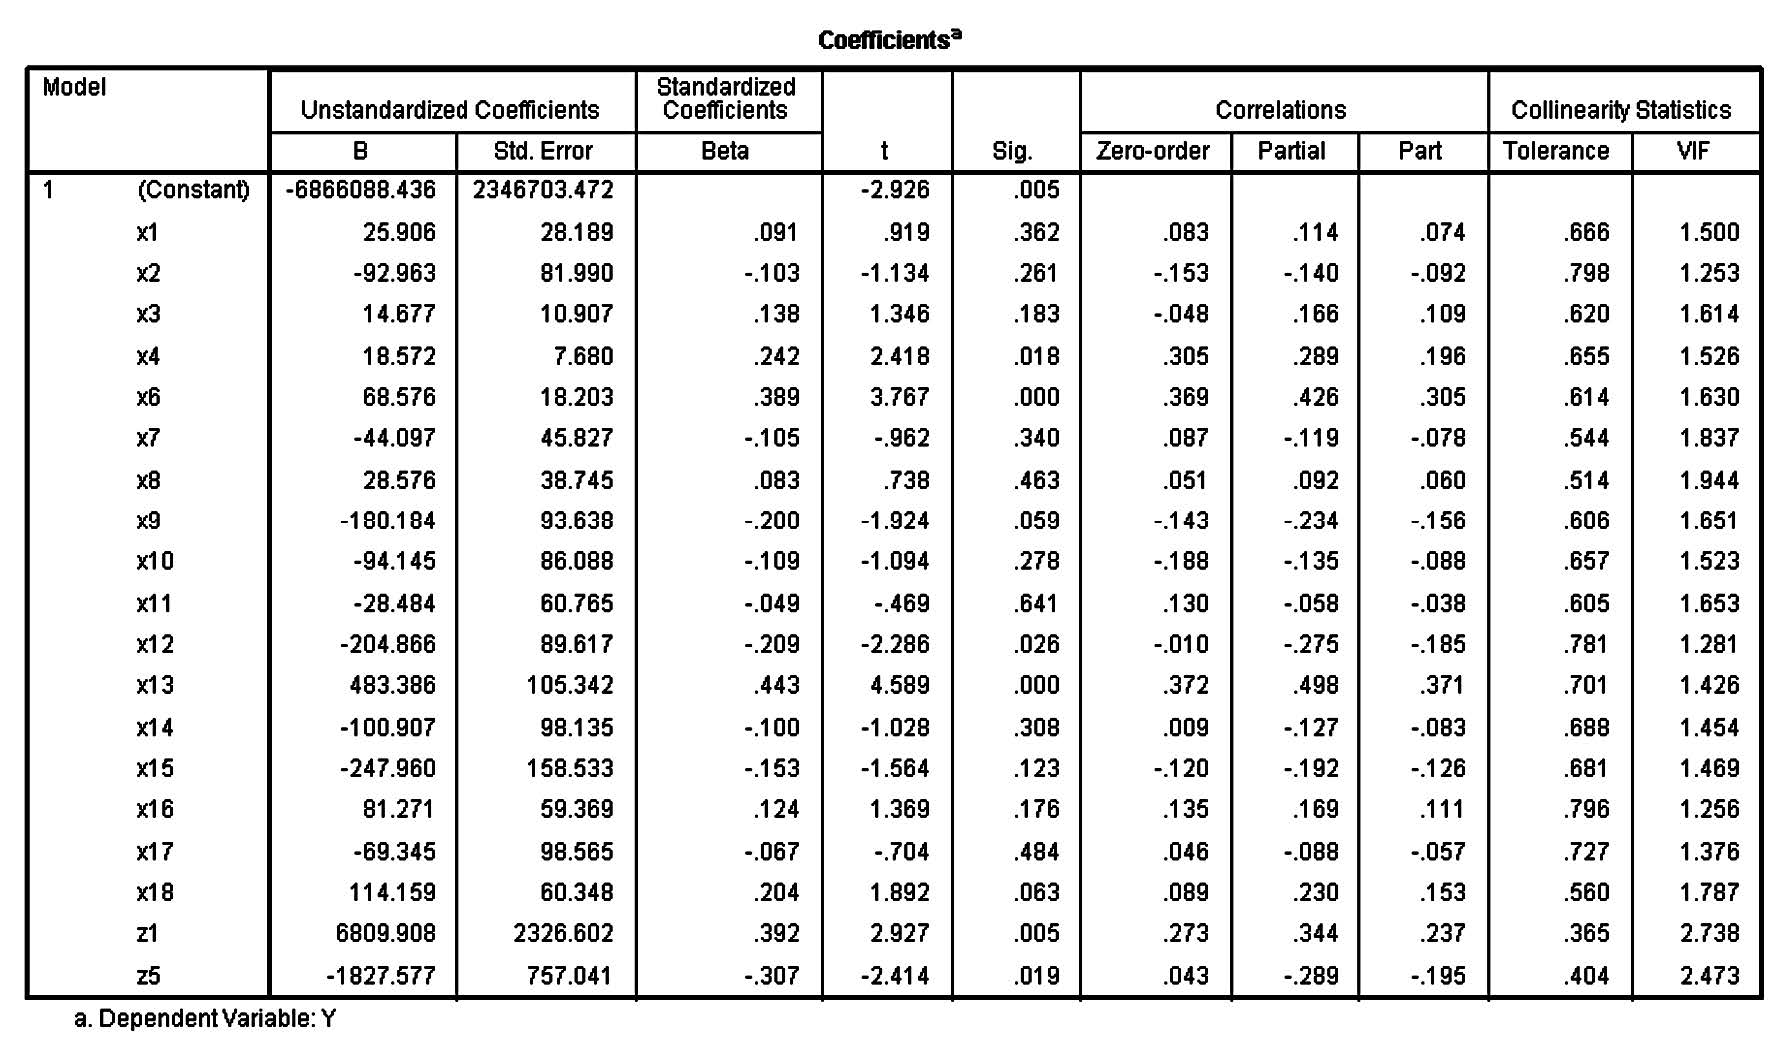
Figure 2. Test of independent factors.
Subsequent of the test results in Table 4, the collected data are prepared for developing the model. Due to the limitations faced in weather data acquisition, forty independence factors from Sopadang et al. (2008) were screened and reduced to twenty-three factors to be the initial input for developing the model (presented in Table 5).
Table 5. Factors for Proposed Model.
Thereafter, the collected qualitative data were transformed to be quantitative data by scoring according to a longan expert. The class of score is presented in Table 6.
Table 6. Score for Qualitative Data.

Model Building, Verification, and Validation
To develop the forecasting model, four selection methods were used and their performance measurements, MAPE, were compared to finally select the practical model. There were 136 data, from which seven data were selected to be the test dataset for the MAPE calculations. The MAPE of all the methods are presented in Table 7.
Table 7. MAPE Results.
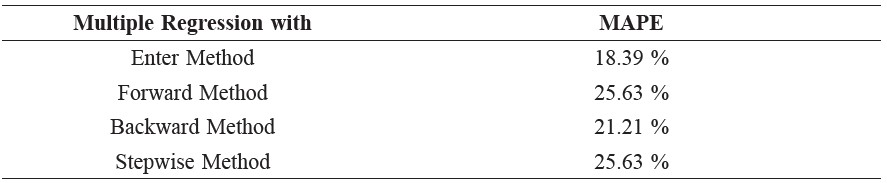
From Table 7, it can be observed that the multiple regression technique with the enter method gave the minimum MAPE, at 18.39%. This value of MAPE can be interpreted as good forecasting, according to Lewis (1982).
Finally, the multiple regression equation for forecasting the quantity of off-season longan supply can be presented as given in Equation (3).
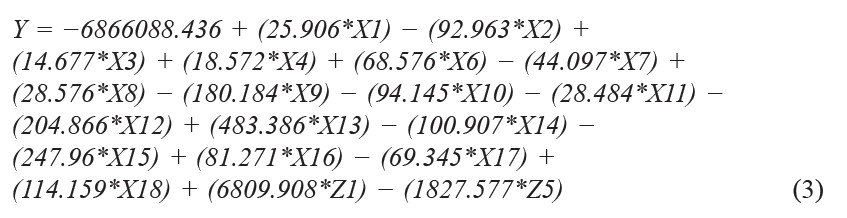
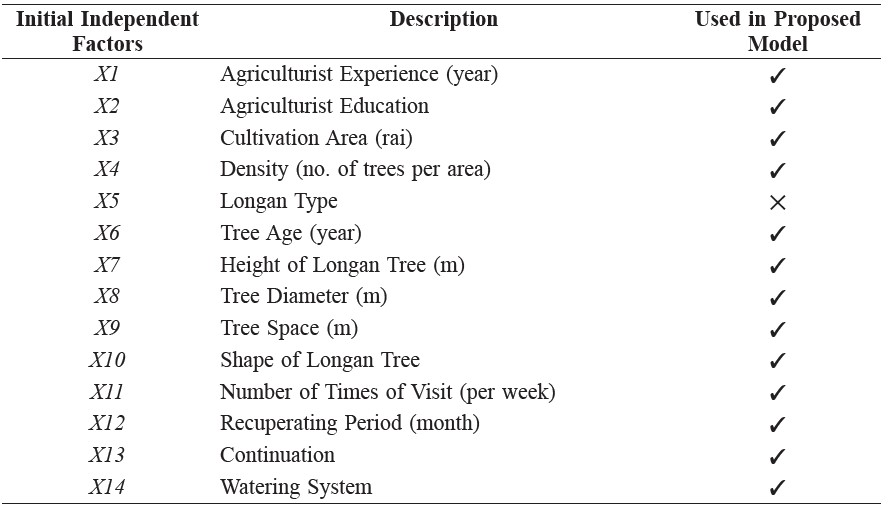
From Equation (3), we can report that some initial independent factors don’t affect to the dependent variable (Y). In Table 8, check sign indicates the affected factors on the other hand cross sign indicates unaffected factors.
Table 8. Independent Factors for Proposed Model.
Discussion
The result of the goodness-of-fit test (Table 4) confirms that the data from the questionnaires are reliable enough to be used in the developing of the forecasting model. The normality test result shows that the collected data are normal distribution. The linearity test is used to confirm the linear relationship between the dependent and the independent variables. The homogeneity of variance test is used only when there is more than one population. For this study, all the collected data were considered as one population, so this test can be ignored. The last test is the multicollinearity test, which is measured from the VIF value. When the VIF values are less than 10, it is ensured that the correlations among the independent variables are not strong. The results from all the tests confirm that the collected data are practical for use in the developing of the forecasting model by using the multiple regression technique. Based on the multiple regression technique, a total of 136 data were collected from agriculturists in four areas of the Chiang Mai province and the Lamphun province of Thailand. The independent factors (X and Z) are presented in Table 8. The only dependent factor is off-season longan yield (Y). From Table 8, it can be observed that the independent factors after the goodness-of-fit was 23, but once the development of the model was complete, there were only 19 factors that were included in the proposed model.The practical model is selected from the minimum value of MAPE. In this study, the multiple regression model with the enter selection method was found to have the minimum value of MAPE, at 18.39%, and this value of MAPE can be interpreted as good forecasting (Lewis, 1982).
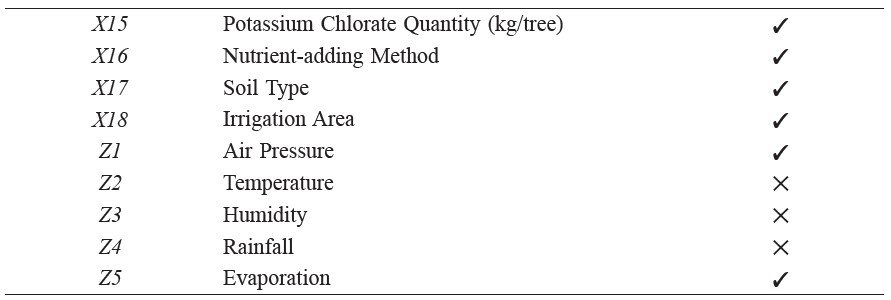
Finally, it can be observed that forty factors from previous research (Sopadang et al., 2008) could be reduced to twenty-three factors and that, finally, only nineteen factors were included in the multiple regression model for forecasting the quantity of supply of off-season longan, as presented in Table 9.
Table 9. Comparison of Factors of ANNs Model and Multiple Regression Model.
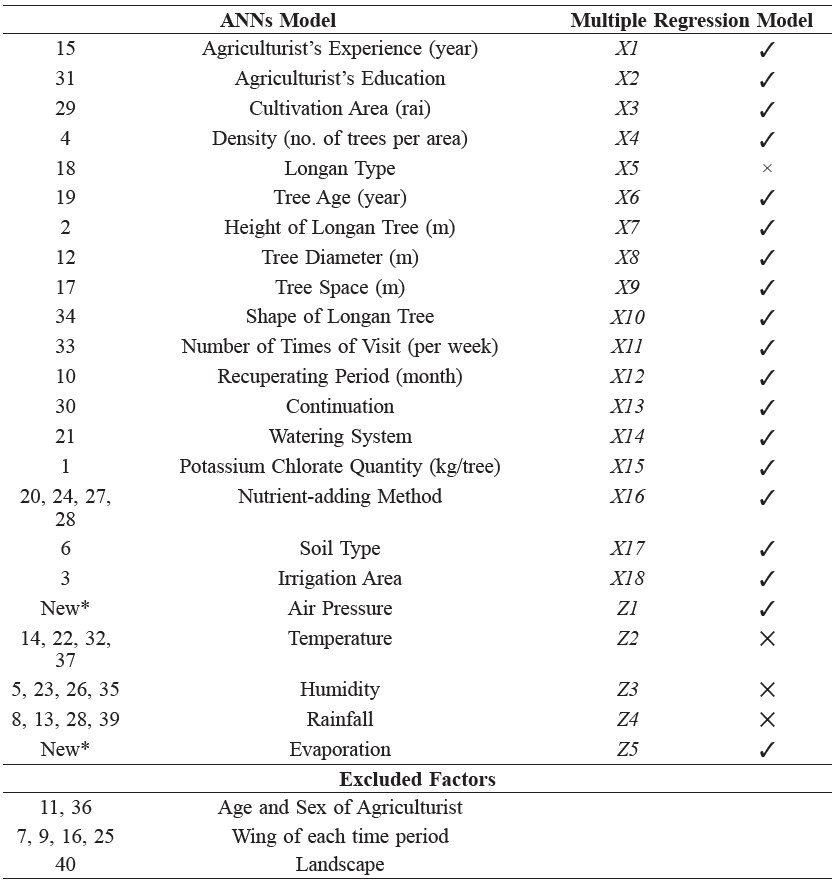
From Table 9, it can be seen that seven factors from the ANNs model have been excluded in the multiple regression model. At the beginning of this research work, forty factors, as discussed in Sopadang et al. (2008), were presented to longan experts, and they discarded the factors of age and sex of the agriculturists because these two factors do not have any effect on the yield of longan. They believe that it is only the experience and the education of the agriculturists that affect the yield of longan.
The group of wind factors is also excluded because the researchers faced limitations in collecting these data, so two factors that have been added instead of these are air pressure and evaporation. Subsequently, the researchers confirmed these factors again with the experts.
The last factor discarded from the proposed model at the beginning step is landscape. As the study areas of Chiang Mai and Lamphun provinces have similar mean sea level (MSL) values, this factor was discarded from the proposed model.
When the multiple regression concept was used to develop the model for forecasting, there were four factors that were excluded, which are longan type, temperature, humidity, and rainfall. As far as the longan type is concerned, the collected data from the agriculturists in the study area show that the agriculturists grow the same type of longan, so during the development of the model based on the multiple regression concepts, this factor was discarded because it does not have any effect on the yield of longan. Similar is the case as far as the remaining factors, namely temperature, humidity, and rainfall, are concerned.
Conclusion
We can conclude that the advantage of proposed regression model in comparison with an ANNs-based forecasting model is that the proposed model based on the multiple regression technique can present a mathematical relationship function between the yield of off-season longan, with the off-season yield as the dependent factor, and all the independent factors. As opposed to this, an ANNs-based model is a black box that cannot present any relationship between these factors because it is a learning-based method.
As far as the application of the proposed model is concerned, the limitation of this model is that the model can be used practically only for forecasting the yield of off-season longan cultivated in the northern region of Thailand due to the reason that the data used in the development of this model have been collected only from this region.
In theory, uncontrollable factors such as the factors related to weather, geography, or environment are excluded from multiple regression models. However, since the previous research (Sopadang et al., 2008) on off-season longan had addressed some uncontrollable factors that influence the yield of off-season longan, in this study, those factors (i.e., temperature, humidity, rainfall, and evaporation) were included as initial independent factors. However, only air pressure (Z1) and evaporation (Z5) remain in the final model.
Acknowledgments
This work was supported by the Higher Education Research Promotion and National Research University Project of Thailand, Office of the Higher Education Commission.
References
Brace, N., R., Kemp, and R. Snelgar. (2009), SPSS for Psychologists, [http://www.palgrave.com]Accessed on October 13, 2012.
Gala, C., V. Luis, G. Herminia, and D. Eugenio. (2004), Forecasting olive (Oleaeuropaea) crop yield based on pollen emission, Field Crops Research,
Vol.86, pp. 43-51. DOI: 10.1016/S0378-4290(03)00170-9
Kasemset, C., K. Leksakul, and A. Sopadang. (2012), The application of full Artificial neural network (FANN) based forecasting model: the case study of off-season longan supply forecasting (in Thai), Research and Development Journal of the Engineering Institute of Thailand, Vol. 23, No. 4, pp. 32-42.
Leksakul, K., and A. Sopadang. (2012), Off-season supply forecasting in Thai longan supply chain with artificial neural network, Chiang Mai University Journal of Natural Sciences (Special Issue on Agricultural & Natural Resources), Vol. 11, No.1, pp.117-122.
Lewis, C.D. (1982), Industrial and business forecasting methods: A practical guide to exponential smoothing and curve fitting, London; Boston: Butterworth Scientific.
Manochai, P., and Research Group (2005), Development of longan agriculturist organization for improving productivity and quality of off-season longan(in Thai), Thailand Research Fund (TRF).
Qian, B., R.D. Jong, R. Warren, A. Chipanshi, and H. Hill. (2009), Statistical spring wheat yield forecasting for the Canadian Prairie Provinces, Agricultural and Forest Meteorology, Vol.149, pp. 1022-1031. doi:10.1016/j.agrformet.2008.12.006
Ramingwong, S., K.Y. Tippayawong, and A. Sopadang. (2011), On the development of i-community to improve production of off-season longan, Australian Journal of Basic and Applied Sciences, Vol. 5, No. 10, pp. 649-654.
Sopadang, A. and Research Group (2008), A study of longan's supply chain management in Thailand(in Thai), Thailand Research Fund (TRF).
Sopadang, A., K.Y. Tippayawong, and W. Chaowarut. (2012), Application of value chain management to longan industry, American Journal of Agricultural and Biological Sciences, Vol. 7, No. 3, pp. 301-311. DOI: 10.3844/ajabssp.2012.301.311
Chompoonoot Kasemset1*, Nisachon Sae-Haew2 and Apichat Sopadang3
1,3 Center of Excellence in Logistics and Supply Chain Management, Faculty of Engineering, Chiang Mai University, Chiang Mai, Thailand
2 Industrial Engineering Department, Faculty of Engineering, Chiang Mai University, Chiang Mai, Thailand
Corresponding author. Email: chompoonoot.kasemset@cmu.ac.th
Total Article Views