 ISSN: 2822-0838 Online

Development of Method for Determination of Lead, Iodine, and Protein Content in Fish Sauce
Somjing Roongjang*, Umaporn Pusod, Prapart Phooviang and Khesorn NantachitPublished Date : 2019-08-28
DOI : 10.12982/CMUJNS.2014.0043
Journal Issues : Number 3, September - December 2014
ABSTRACT
The aim of this investigation was to develop a method for the determination of the lead, iodine, and protein content in fish sauce. For statistical data, five samples of fish sauce that cost 9.0–43.0 Bahts were randomly bought from a supermarket in Chiang Mai Province. Five replicates of each sample were digested and measured for the lead amount, using absorbance by atomic absorption spectroscopy, and each replication was injected six times. The iodine content were measured from the five samples, and each sample was investigated in five replications using the iodimetric method. The protein contents was determined by applying the Kjedahl method using the five samples. The lead determination method was accepted because of the statistical data. Using fish sauce as a seasoning agent is a practice that is safe from lead toxicity because the lead contents were found to be lower than the stipulated Thai Food Act Limit which is 1.0 ppm. The determination method for iodine content needs to be further developed by controlling the pH of the reaction medium to be neutral or to be that of a dilute acid. The protein determination method needs to be investigated for more statistical data. Consumers should also pay better attention to the sample label because it was observed in this investigation that there was a highly priced sample contained low nutritional values of protein besides showing the wrong label.
Keywords: fish sauce, lead, iodine, protein
INTRODUCTION
The principal source of lead (Pb) contamination for humans is food, from both plants and animals, which are received in the following ranges: from 220 to 400 μg/day for adults and from 75 to 120 μg/day for small children. The absorption of ingested inorganic Pb is about 10%, whereas that of organolead compounds (tetraalkyl Pb in gasoline) may be up to 75%, with less than 5% of the absorbed Pb retained (Hayes, 1988). In children, both absorption and retention are higher. In general, absorption is higher through the pulmonary route and lower through the skin than via the gastrointestinal tract. Absorbed inorganic Pb is transported in blood mostly (90%) bound to RBC (membrane as well as hemoglobin) in equilibrium with that in plasma, which, in turn, is in equilibrium with that in soft tissues but not with that in bones (half-life > 20 years) where major Pb accumulation takes place with time. Following organolead exposure, major accumulation takes place in the liver and kidney. The metabolism of tetraalkyl Pb to trialkyl and inorganic Pb, mainly by P-450-dependent oxidative dealkylation in the liver and the subsequent transport of trialkyl Pb to the critical organ, the brain, seems to be responsible for the neurotoxic effects (Mason, Harp & Han, 2014).
The neurotoxicity of organolead compounds appears to be brought about by a change in the chloride/hydroxide distribution across the nerve cell membrane, resulting from the induction of electrically silent anion exchange. Urine is the major excretory route for inorganic Pb, whereas two-thirds of organic Pb is excreted via feces. The biological half-life of organic Pb compounds appears to be only 1-7 days, whereas half-lives as long as 1 year have been estimated in the brain following low level exposure. In addition to neurotoxic effects, Pb is known to affect the hematopoietic, renal, gastrointestinal, and reproductive systems (WHO, 2008).
Renal effects of Pb can be divided into either an acute and reversible tubular dysfunction in children associated with congenital nephritic syndrome (CNS) effects or a chronic irreversible interstitial nephropathy in occupational workers. The effects of Pb on the hematopoietic system ultimately result in anemia from impaired heme synthesis and reduced erythrocyte life span (Shan, Kazi, Afridi & et.al., 2010).
The Joint Food and Agriculture Organization-World Health Organization (FAO/WHO) expert committee on food additives have suggested a tolerable weekly Pb intake from food and drinks of 3 mg/person, with lower limits (e.g., 0.5 mg/kg of food, as in the U.K.) advisable for foods intended for infants and young children. The EPA recommends a limit of 0.05 mg/liter for all drinking water, whereas WHO recommends a level of 0.30 mg/liter (WHO, 2008).
The limit of lead intake as prescribed by the Thai Food Act is 1.0 ppm (Thai food Act, 2000 and 2004) because fish sauce may be macerated in a lead tank. Taking iodinated fish sauce is recommended for preventing goiter (the limit of iodine intake according to the Thai Food Act 2004 is 0.2-0.3 mg%), and the high protein content in the fish sauce demonstrates its high nutritional value (the limit for nitrogen content in fish sauce solution as prescribed by the Thai Food Act 2004 is 0.9 gm%). The objective of this investigation was to develop a suitable method for the determination of lead, iodine, and protein content in fish sauce.
MATERIALS AND METHODS
1. Lead determination
1.1 Sample preparation
Fish sauce samples that cost in the range of 9.0-43.0 bahts were selected randomly to obtain five types of samples, from a supermarket in chiangmai province from march until may 2010. Three bottles of each sample were investigated in five replications and injected into the atomic spectrophotometer six times per replication.
To prepare each sample for lead determination, 10 ml of the sample, 10 ml of sulfuric acid (20% v/v), 4 ml of conc. nitric acid, and 6 ml of conc. perchloric acid were mixed in a 500 ml beaker. The sample was evaporated, and 1 ml of conc. nitric acid was added for each time until the sample solution was colorless and cooled. If the sample solution was found to be turbid, 5 ml of deionized water was added and the solution filtered into a volumetric flask of 100.0 ml. The volume of the sample solution was adjusted with deionized water to a volume of 100.0 ml.
1.2 Calibration curve
1.2.1 Stock standard solution
Lead nitrate was accurately weighed for 0.1599 gm and dissolved in 1 ml of nitric acid (50% v/v), and then adjusted to a volume of 100.0 ml. This stock standard solution was equivalent to 1000 ppm of lead. Five milliliters of the stock standard solution were pipetted to 200.0 ml, and the volume was adjusted to contain 25 ppm of lead concentration.
1.2.2 Working standard
The working standards were prepared for 0.25, 0.5, 0.75, 1.0, and 2.0 ppm of lead by pipetting 1, 2, 3, 4, and 8 ml of the 25.0 ppm lead concentration solution respectively, adding 0.15 ml of nitric acid (50% v/v), and, finally, a, djusting the volume to 100.0 ml.
1.2.3 Determination of % recovery
A volume of 4.0 ml of 25 ppm of lead standard solution was added to a 10.0 ml sample solution. Then the samples were digested using the same procedure for sample preparation as given in section 1.1. The lead concentration in the internal standard was 0.5 ppm. The investigation was repeated five times.
1.3 Determination of lead trace element
The standard solution, the internal standard, and the sample solution were injected into the atomic spectrophotometer, which was equipped with a GBC hollow cathode lead lamp, GBC Avanta V.1.33, a wavelength 217.00 nm, using an oxidizing air-acetylene flame. Six replications of each sample were determined.
2. Iodine determination
2.1 Sample determination
A volume of 10.0 ml of fish sauce sample was added into 250 ml iodine flask. A volume of 20 ml of distilled water and 3 ml of starch solution T.S. (test solution) were also added, in succession. After that, the sample solution was titrated with the standard solution of 0.1021 N sodium thiosulfate. A total of five replications were conducted for each sample.
2.2 % Recovery determination
A volume of 10.0 ml of fish sauce sample and 10.0 ml of 2.44% iodine solution were mixed together in an iodine flask of 250 ml. The further analysis was carried out according to the procedure given in section 1.2 for sample determination.
3. Protein Determination (Applied Kjeldahl Method)
A volume of 20.0 ml of the fish sauce sample and 5.0 ml of conc. hydrochloric acid were poured into 50.0 ml centrifuge tube. The sample solution was centrifuged at the rate of 4000 rpm. The protein in the fish sauce sample was coagulated (precipitated) by the strong acid, and the determination was done by visual estimation and on the basis of their weights.
RESULTS
The method used for determining the lead amount had high linearity (r2 = 0.999), with concentration ranging from 0.25 ppm to 2.00 ppm, a limit of detection of 0.032 ppm, and a limit of quantitation of 0.25 ppm. The amount of lead was very small and was under the permitted limit in food, as recommended by the Thai Food Act, which is 1.0 ppm. The amount of lead was found to be in the range of 0.006–0.177 ppm However this amount within the permitted limits of detection. Thus, it was demonstrated that these fish sauce samples were not macerated in a lead tank.
The method was developed for determining the lead content in this investigation was accepted because the difference between the %RSD of the lead content in sample 3 (internal standard), as show in Table 1, and the %RSD of the lead amount in the calibration curve was 0.9% (Figure 1), and this was because of the small amounts of lead in the sample. Moreover, Table 2-4 reported lead concentration, iodine and protein content from five fish sauce sample are sold in the market at cost per bottle about 9.0-43.0 baths, respectively.
Table 1. Percent Recovery of Lead Amount (AOAC, 2000).
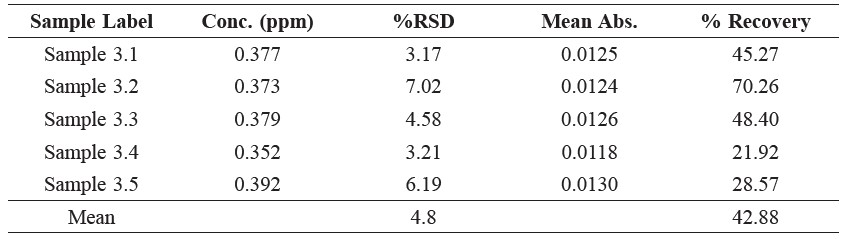
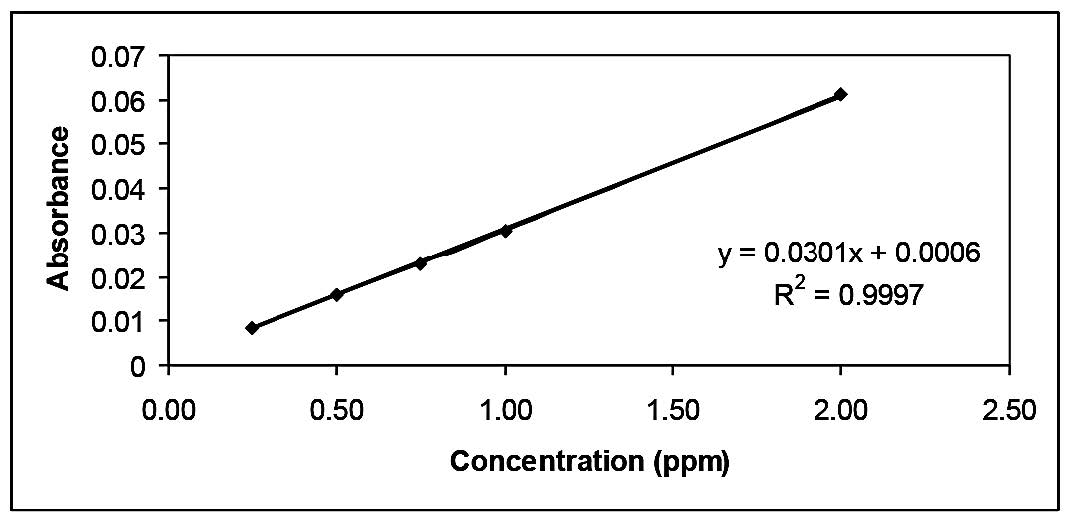
Figure 1. The calibration curve of determination of lead.
Table 2. Lead Concentration (ppm) in Fish Sauce Samples from Five Samples Which Cost 9.0-43.0 Bahts.
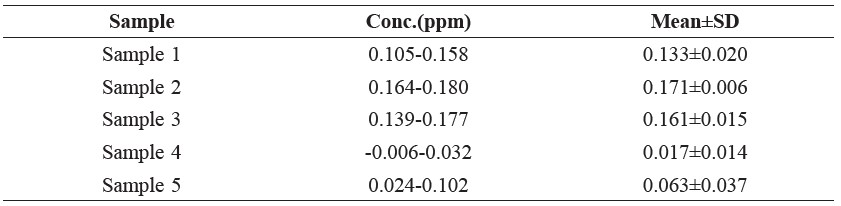
Table 3. Iodine Content in Five Fish Sauce Samples.
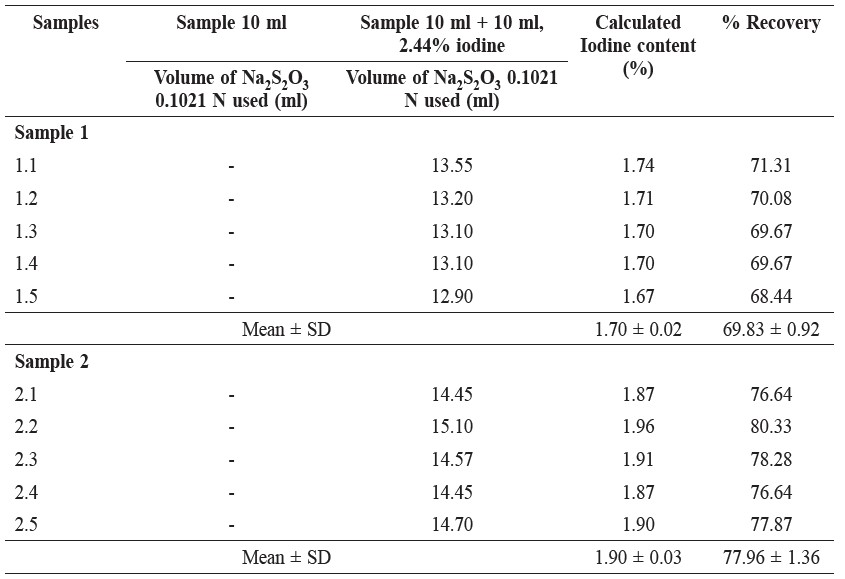
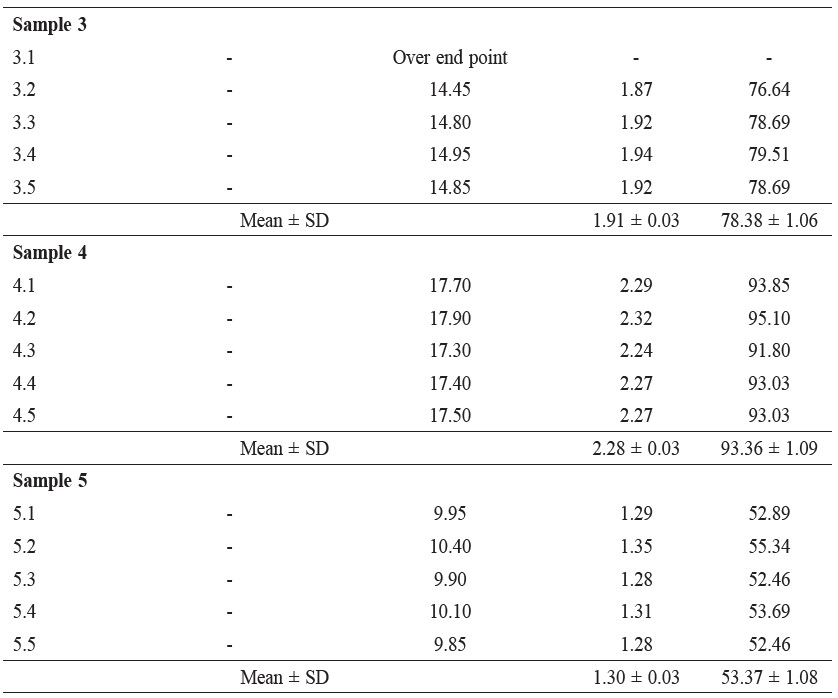
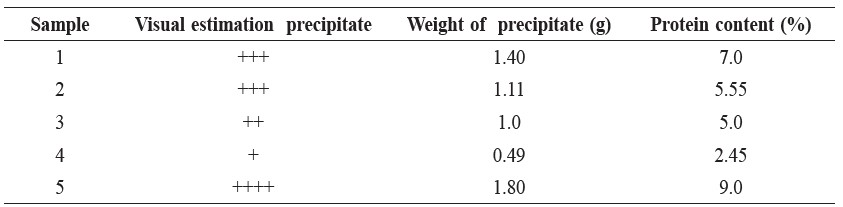
Table 4. Protein Content in Fish Sauce Samples.
DISCUSSION
In our investigation, the iodine content could not be determined because there exists the condition that the medium of the iodine–sodium thiosulfate reaction should be neutral or it should be a dilute acid (Chatten, 1966); however, in our determination, the pH of the sample solution was not controlled, so the percent recoveries were low. Only sample 4 (Table 3) had a percent recovery that was high because the major content of this sample was water, as observed from checking the amount of lead (Table 2) and the amount of protein (Table 4), both of which were low. The amount of iodine was found to vary because of the wrong condition medium of the determination method.
The amount of protein was found to be in the range of 2.45% to 9.0%, which is a large amount; this large quantity of protein might have come from the protein content of the fish sauce and not from glutamic acid because there are no nitrogen atoms in the structure of glutamic acid. This percentage of protein content is over the permissible limit of nitrogen content in fish sauce as prescribed by the Thai Food Act, which is 0.9%. The data in Table 4 demonstrate only the preliminary determination. For the statistical data, each type of the samples should be investigated by making use of five replications.
CONCLUSION
The method developed in this investigation for determining the amount of lead was accepted because of the high linearity of the standard curve (r2 = 0.999) and because the difference between the %RSD of the standard curve and the %RSD of the appropriate internal standard was only 0.9%.
The iodimetric method should be such that the controlled pH of the medium should be neutral or it should be a dilute acid. Fish sauce was the source of iodine, which is useful in preventing goiter, and so, developing a suitable method for its determination is important. Furthermore, the method for the determination of protein should be investigated using more accurate than this method such as Bradford protein assay.
ACKNOWLEDGMENTS
The authors are grateful to the Faculty of Pharmacy, Chiang Mai University, for the support of providing laboratory space and equipment to investigate this project.
REFERENCES
Chatten, L.G. 1966. Pharmaceutical Chemistry, Vol.1.p.154. Marcel Dekker, Inc., New York.
Hayes, A.W. 1988. Principles and Methods of Toxicology. 2nd ed. p.94-96. Roven Press, New York.
Mason, L.H., Harp, J.P., Han, D.Y. Pb neurotoxicity: neuropsychological effects of lead toxicity. Biomed Res Int. 2014: 1-8.
Official Methods of Analysis of the Association of Official Analytical Chemists. 1990. 15th ed., Vol. 1. p.259. AOAc International Suite 400, Virginia.
Official Methods of Analysis of the Association of Official Analytical Chemists. 2000. 17th ed., Vol. 1.p.xix. AOAcInternational Suite 400, Virginia.
Shah, F. Kazi, T.G. Afridi, H.I. Baig, J.A. Khan, S. Kolachi, N.F. Wadhwa, S.K. Shah, A.Q. Environmental exposure of lead and iron deficit anemia in
children age ranged 1-5 years: a cross sectional study. Sci Total Environ. 2010; 408(22): 5325-30.
Thai Food Act 2000 and 2004 from Thai Ministry of Public Health.
World Health Organization, Guidelines for Dringking Water Quality. 2008. 3rd ed., Vol. 1. p.392-394. Geneva.
Somjing Roongjang1*, Umaporn Pusod2, Prapart Phooviang1 and Khesorn Nantachit1
1 Department of Pharmaceutical Sciences, Faculty of Pharmacy, Chiang Mai University, Chiang Mai 50200, Thailand
2 Division of Research and International Relations Affairs, Faculty of Pharmacy, Chiang Mai University, Chiang Mai 50200, Thailand
*Corresponding author. E-mail:somjing@hotmail.com
Total Article Views