 ISSN: 2822-0838 Online

Factors Influencing the Impact Force of the Taekwondo Roundhouse Kick
Sutima Thibordeeand and Orawan Prasartwuth*Published Date : 2019-08-24
DOI : 10.12982/cmujns.2014.0020
Journal Issues : Number 1, January-april 2014
ABSTRACT
The roundhouse kick is a powerful taekwondo move, commonly used in sparring matches. The kick’s power could be derived from the angular position and activation of muscles controlling the ankle joint. The aim of this study was to investigatethe ankle joint angle and activation of the lower leg muscles at different levels of impact force. Twenty Thai,black-belt, male, Taekwondo athletes performed roundhouse kicks with their maximal effort. Ankle joint motion was recorded using an electrogoniometer sensor. Activations of gastrocnemius and tibialis anterior muscles were monitored using surface electromyography. The athletes were divided into two groups based on their maximal impact forces: high (HI; 172.03 ± 19.36 N) and low (LO; 110.14 ± 20.20 N). Comparisons between the two groups showed that the HI group demonstrated significantly less plantarflexion angle and gastrocnemius activation than the LO group (P < 0.05). This indicates that impact force of the roundhouse kick may depend on the ankle joint position and gastrocnemius activation.
Keywords: Anklejoint, Impact force, Muscle activation, Roundhouse kick, Taekwondo
INTRODUCTION
Taekwondo is a martial art that has crossed over into sports, gaining popularity in the process. One of the basic techniques in taekwondo is kicking. The roundhouse kick is one of the most frequently used in competition,since it can be performed rapidly and powerfully(Matsushigue et al., 2009; Roh and Watkinson, 2002). It is performed by lifting the kicking leg in an arc towards the front of the body, followed by extending the knee rapidly until the instep of the kicking foot strikes the target, exerting force. Consequently, as the most distal segment responsible for the impact, the ankle joint plays an important role in controlling the power of the kick.
Previous studies on the kinematics of the roundhouse kick mostly focused on the motion ofthe knee and hip joints (Kong et al., 2000; Kim and Hinrichs, 2006; Ha et al., 2009; Kim et al., 2011; ). Only one study has reported on ankle joint motion. According to this study, the ankle joint plantarflexed at about 45° throughout the kick, for both highly-skilled and less-skilled taekwondo athletes (Ha et al., 2009). However, the contribution of ankle joint motion to the impact force was not discussed.
Since joint motion is directly related to a change in muscle length, it can also affect muscle activation (Nourbakhsh and Kukulka, 2004). A previous study reported that the gastrocnemius muscle showed the greatest electromyographic (EMG) activity during the roundhouse kick (Luk and Hong, 2000). However, the EMG activity of the tibialis anterior, an antagonist muscle, was not studied. Although information on ankle joint angle and gastrocnemius activation has been studied, these were derived from different groups of subjects and reported separately. In addition, the influences on the high impact force have not been completely described. As the power of a kick is a criterion in scoring a competition, it is interesting to investigate distinctions between different levels of impact forces. Therefore, this study analyzed the ankle joint angle and EMG activities ofthe gastrocnemius and tibialis anterior muscles at different impact forces.
MATERIALS AND METHODS
Participants
Twenty Thai, black-belt, male, taekwondo athletes with experience in nationallevel matches were recruited for the study. None of the recruited participants had injuries of the lower extremities that would limit kicking ability. All athletes provided written informed consent as approved by the Institutional Review Board Committee of Faculty of Associated Medical Sciences, Chiang Mai University.
Joint angle
Angular motions of ankle and knee joints were recorded using twin axes electrogoniometer sensors (DataLOG W4X8, Biometrics Ltd, UK). The sensors were attached to the athlete’s skin covering the midline of the joint:at the distal 1/3 of the lower leg and below the lateral malleolus (ankle joint); and at the distal 1/3 of the thigh and proximal 1/3 of the lower leg (knee joint). The signal was stored at 1,000 Hz.
Electromyography
EMG activities of kicking leg muscles (gastrocnemius and tibialis anterior muscles) were recorded using surface electrodes. Prior to placement of the electrodes, the skin was shaved, abraded and cleaned with alcohol. Disposable self-adhesive electrodes (8 mm diameter, Ag/AgCl discs, Red Dot, 3M) were taped over muscle bellies, approximately 2 cm apart and aligned with the direction of the muscle fibers. Signals were pre-amplified (x4000) and sampled at 1,000 Hz using MyoDat software (MIE Medical Research Ltd, UK). Maximal EMG activity (EMGmax) of each muscle was recorded during maximal voluntary contractions.
Impact force
A square-shaped kicking target constructed with polyurethane foam was attached to a force transducer (2 kN; LC 1205-K200, A&D Co Ltd, Japan). The force transducer was calibrated to ensure its accuracy for measuring the impact force. Force signal was recorded at 200-1,000 mV by Powerlab system (ADIstruments
Pty Ltd, Australia).
Procedure
The target height was adjusted to the waist level and located at proper execution distance for each athlete. The attack area was marked at the center of the target, in order to provide visual feedback for the accuracy site of kicks. Prior to the tests, the athletes were allowed to warm-up and familiarize themselves with the setting. The athletes stood in ready-stance with the kicking leg behind. Then, they were instructed to perform as strong a roundhouse kick as possible, while avoiding using their momentum to maximize impact. Five trials were performed with 15 s rest between trials.
Data analysis
Based on the marked changes of ankle and knee joints,the roundhouse kick was divided into three phases: 1) lift-off phase – the first change of ankle joint from slightly dorsiflexion to maximal ankle plantarflexion angle, 2) pre-impact phase – maximal knee flexion angle (pre-impact phase) and 3) impact phase – less plantarflexion angle after maintaining its maximal angle.The transition points of each phase were considered. The start and impact points were firstly determined from angular signals. Then, raw EMG signals were synchronously arranged and band-pass filtered (50 - 400 Hz). The EMG data was calculated as root-mean-square values over 50 msec for each phaseby Chart v5.4 for Windows (ADIstruments Pty Ltd, Australia). The root-mean-square EMG was normalized to the EMGmax of each muscle.The ankle joint angle was also calculated as mean value over these specified ranges.
Of the five trials, the three with the maximum impact forces were selected for data analysis. Based on the impact forces, the athletes were grouped into different levels. Comparison between groups was performed by using Mann-Whitney U test. Level of significance was set at P <0.05.
RESULTS
According to the maximum, minimum, mean and standard deviation of the impact forces, three groups were classified; high level (HI, n=3, 172.03 ± 19.36 N), moderate level (MO, n=11,122.60 ± 9.43 N) and low level (LO, n=6, 87.30 ± 12.66 N). The ankle joint angle and the normalized EMG activities were nonetheless similar for the MO and LO groups in all phases (P>0.05). For example, during impact phase, the MO and LO groups showed plantarflexion angle of 40.3 ± 5.2° and 42.9 ± 7.4°, respectively. For the normalized EMG activities, they showed gastrocnemius activation of 26.99 ± 10.66 %EMGmax and 32.72 ± 13.76 %EMGmax, respectively, and showed tibialis anterior activation of 23.23 ± 15.94 %EMGmax and 32.56 ± 23.17 %EMGmax, respectively. Consequently, the MO and LO groups were merged into one group, retaining the LO group name, to compare with the existing HI group.
The impact force was significantly higher in the HI group (172.03 ± 19.36 N) than the LO group (110.14 ± 20.20 N) (P<0.05). Although the baseline characteristics were not different between groups (age, height and experience were 24.3 ± 5.9 years, 1.72 ± 0.05 m and 11.0 ± 7.6 years for the HI group, and 17.7 ± 4.8 years, 1.70 ± 0.10 m and 7.8 ± 2.3 years for the LO group), the body mass was significantly higher in the HI group (88.7 ± 4.2 kg) than the LO group (61.4 ± 15.6 kg) (P<0.05).
Regarding the ankle joint angle and EMG activities of gastrocnemius muscle, differences were found during the pre-impact and the impact phases between the HI and the LO groups (Figures 1 and 2). However, the EMG activity of tibialis anterior muscle was not different between these groups in any phases (Figure 2). The results showed that during the pre-impact phase, the HI group had significantly less plantarflexion angle and gastrocnemius activation than the LO group (P< 0.05).During the impact phase, the HI group also had significantly less plantarflexion angle than the LO group (P<0.05), but did not show differences in EMG activities.
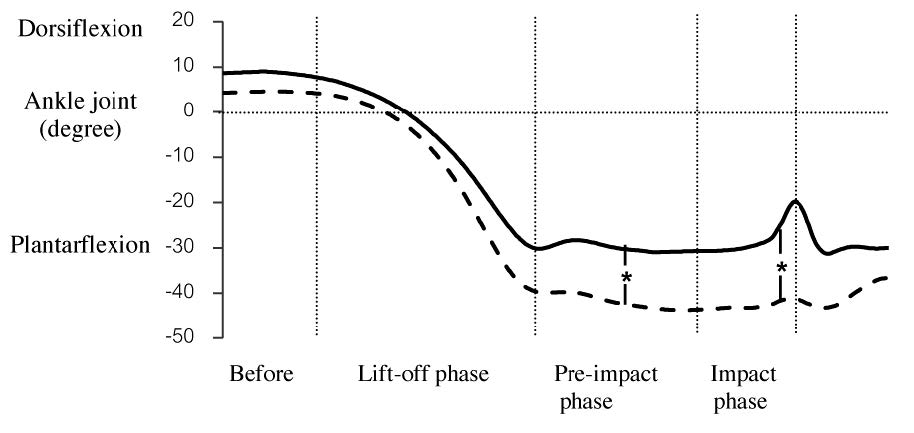
Figure 1. Comparison of ankle joint angle between HI group (solid line) and LO group (dashed line) in each phase of the roundhouse kick. Vertical lines represent the transition points between each phase.
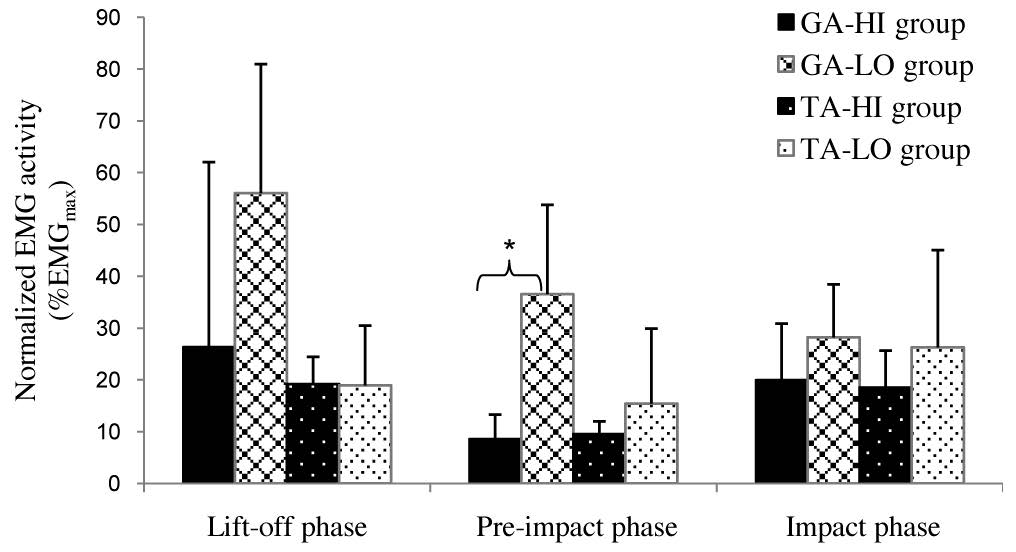
Figure 2. Comparison of normalized EMG activities of gastrocnemius and tibialis anterior muscles between HI group and LO groupfor each phase of roundhouse kick.
Referring to the results shown in Figure 2, the activation pattern of the gastrocnemius muscle in both groups was presented in different ways. For the HI group, gastrocnemius activation was relatively high in thelift-off phase, decreased in the pre-impact phase, and increased again in the impact phase. In contrast, for the LO group, it decreased continuously from lift-offthrough the impact. The pattern of gastrocnemius activation observed in the HI group may, therefore, be a better neural strategy.
DISCUSSION
According to the results, the relatively less plantarflexion angle in the HI group may be the proper position of the ankle joint (~ 30°) for producing a higher impact force. In contrast, the excessive plantarflexion angle found in the LO group (~ 40°) may be related to the shortened length of gastrocnemius muscle, which may lead to the large activation of the gastrocnemius muscle and, therefore, the low impact force. Since difference in ankle joint angle during the impact phase did not correspond with muscle activation, it might be related to changes in the knee joint, which is primarily responsible for accelerating the lower leg while making impact. Thus, future study should determine contribution of knee angle and thigh muscle activation on the generation of impact force.
In summary, during powerful roundhouse kicks, high- and low-impact forces could be differentiated according to differences in the ankle joint angle and normalized EMG activities. The major differences between the Hl and LO groups were less plantarflexion angle and less gastrocnemius activation during the final phases, which may account for the better impact force.
ACKNOWLEDGEMENTS
We would like to thank the Office of the Higher Education Commission, Thailand for funding this research through a Strategic Scholarships for Frontier Research Network grant for the Ph.D. Program Thai Doctoral degree.
REFERENCES
Ha, C. S., M. H. Choi, and B. G. Kim. 2009. The Kinematical Analysis of the Taekwondo Sparring Players' Bandal Chagi in Kinematics. International Journal of Applied Sports Sciences 21, 115-131.
Kim, Y. K., and R. Hinrichs. 2006. Biomechanical classification of Taekwondo kicks. In: Proceedingsof 24th Symposium of International Society of Biomechanics in Sports, Salzburg, Austria.
Kim, Y. K., Y. H. Kim, and S. J. Im. 2011. Inter-joint coordination in producing kicking velocity of Taekwondo kicks. Journal of Sports Science and Medicine 10, 31-38.
Kong, P. W., T. C. Luk, and Y. Hong. 2000. Difference between Taekwondo roundhouse kick executed by the front and back leg-a biomechanical study. In: Proceedingsof 18th Symposium of International Society of Biomechanics in Sports, Hong Kong, China.
Luk, T. C., and Y. Hong. 2000. Comparison of electromyography activity between different types of Taekwondo roundhouse kick. In: Proceedings of 18th Symposium of International Society of Biomechanics in Sports, Hong Kong, China.
Matsushigue, K. A., K. Hartmann, and E. Franchini. 2009. Taekwondo: Physiological responses and match analysis. Journal of Strength and Conditioning Research 23, 1112-1117.
Nourbakhsh, M. R., and C. G. Kukulka. 2004. Relationship between muscle length and moment arm on EMG activity of human triceps surae muscle. Journal of Electromyography and Kinesiology 14, 263-273.
Roh, J. O., and E. J. Watkinson. 2002. Video analysis of blows to the head and face at the 1999 World Taekwondo Championships. Journal of Sports Medicine and Physical Fitness 42, 348-353.
Sutima Thibordeeand and Orawan Prasartwuth*
Department of Physical Therapy, Faculty of Associated Medical Sciences, Chiang Mai University, Chiang Mai 50200, Thailand
*Corresponding author. E-mail: orawan.pr@cmu.ac.th
Total Article Views