 ISSN: 2822-0838 Online

Small Mammal Communities: Diversities, Seasonal and Temporal Distribution in Each Forest Type, University of Phayao Plant Genetic Conservation Area, Thailand
Sitthisak PinmongkholgulPublished Date : 2019-08-25
DOI : 10.12982/CMUJNS.2014.0035
Journal Issues : Number 3, September - December 2014
ABSTRACT
Small mammal communities were studied over 12 months in three dry tropical forest habitats in the University of Phayao Plant Genetic Conservation Area, Phayao Province, Thailand. Traps were set for three days each month, and trapped animals were marked and released. Data were collected on species, age, body mass, and trap location, allowing for the determination of population age structure through time, minimum home-range sizes, biomass, and community diversity indices. Six species of Rodentia and one each of Scandentia, Lagomorpha and Carnivora were recorded in 1,047 captures of 371 individuals over 3,528 trap nights (a 29.7% capture rate). The four most common species caught from all sites were Maxomyssurifer, Tupiaglis, Rattusrattus and Leopoldamyssabanus, with M. surifer the most common species in all forest types. There was significant variation across forest type and season in the age of animals caught, their density, and their mass, but not in community structure or sex ratios. In all forest types, minimum home range sizes were larger in the cold and hot seasons than in the rainy season. The dry dipterocarp forest supported the highest diversity of small mammals. Small-mammal community diversity was positively correlated with forest heterogeneity.
Keywords: Small mammals, Dry dipterocarp, Ecotone, Dry evergreen forests, University of Phayao Plant Genetic Conservation Area.
INTRODUCTION
The composition of small mammal communities in Northern Thailand is not fully understood (Walker and Rabinowitz, 1992), because most studies in Asia have focused on India and Malaysia (Lim, 1970; Rao and Sunquist, 1996; Shanker and Sukuma, 1999; Shanker, 2001; Wells et al., 2004, 2006, 2007). Little is known of the effects that habitat and seasonality have on the dynamics of these communities.
Seasonally dry tropical forest represents 42% of the tropical vegetation worldwide and is characterised by a relatively high number of tree species with small, dry, wind-dispersed seeds (Murphy and Lugo, 1995). This type of forest is widespread throughout Thailand, particularly in regions with 4-6 dry months and no more than 1,200 mm annual rainfall (Ashton, 1990), and it is the dominant forest type in northern and northeastern Thailand (Bunyavejchewin, 1999; Drew et al., 1978; Sukwong, 1982). Seasonally dry tropical forest consists of two main representative types: dry deciduous forest and dry evergreen forest (Stott, 1986). Tropical dry forests are home to a wide variety of mammals. Food productivity in these forests may be very low during the dry season, so the most abundant mammals are typically those that have larger home ranges and can travel a longer distance in search of food (Pontes, 2004; Rickart et al., 2011). Many of these species display extraordinary adaptations to seasonal changes in climate and resource availability (Prins and Reitsma, 1989).
Many tropical small mammal communities are richer in species (and most likely in the number of individuals) than small mammal communities in temperate regions (Golley and Ryszkowski, 1975; Nakagawa et al., 2006). The structure of small mammal communities is broadly determined by habitat structure and heterogeneity (Eduardo and Grelle, 2003; Tews et al., 2004; Cramer and Willig, 2005), and abundance correlates positively with habitat diversity (Taraman et al., 2005). Habitat diversity is a function of both spatial heterogeneity and vertical stratification (August, 1983). Habitat patchiness and seasonality are major influences on the structure and dynamics of small mammal communities in dry tropical forests (Walker and Rabinowitz, 1992). Several habitat variables, including vegetation density, foliage height diversity and soil structure, significantly influence species’ distributions, both among and within habitats (Rosenzweig and Winakur, 1969; Holmes and Dricamer, 2001). Vegetative cover provides refugia and influences the ability of animals to escape from predators. Thus it plays a key role in the spatial organisation of communities (Taraborelli et al., 2003; Corbalán and Ojeda, 2004).
Small mammals are an integral component of forest communities, contributing to energy flow and nutrient cycling and playing vital roles as pollinators, seed predators and seed dispersers in tropical forests (Fleming, 1975; Zhoa et al., 2008). Small mammals also form an important prey base for medium-sized carnivores and raptors (Golley et al., 1975; Hayward and Phillipson, 1979; Emmons 1987).
This paper examines aspects of community structure and composition and the relative abundance of small mammals in dry dipterocarp forest, ecotone forest and dry evergreen forest in the University of Phayao Plant Genetic Conservation Area, Phayao Province, Thailand.
MATERIALS AND METHODS
Study site
The University of Phayao Plant Genetic Conservation Area in Phayao Province, Thailand (Figure 1) is a reserve foreste that covers approximately 5 km2 and ranges in altitude from 250 to 562 m above sea level. Rainfall averages 1,260 mm per year, and the average annual temperature is 26°C. Dry evergreen forest and dry dipterocarp forest are the dominant forest types, representing 70% of the vegetation cover, and they are located in the north and northeastern areas of the reserve. The remaining 30% of the reserve has been reforested, with the dominant species being wattle (Acacia auriculaeformis Cumm.), Ceylon rose (Albiziachinensis Merr.) and pradoo (Pteracarpusmacrocapus Kurz.).
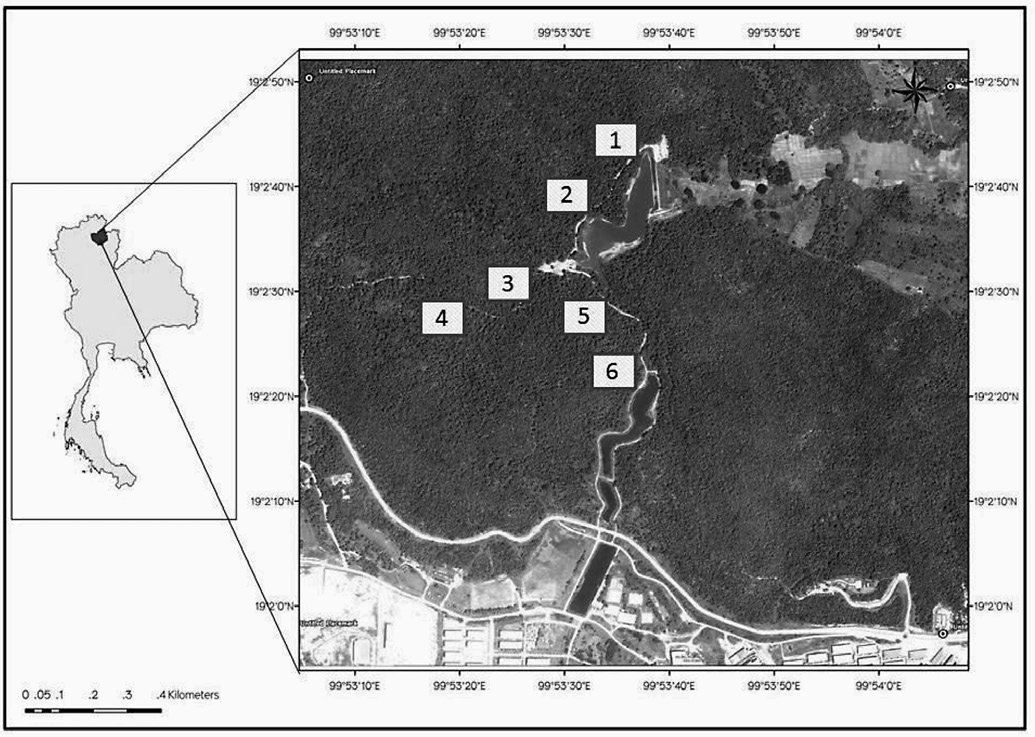
Figure 1. Map of University of Phayao Plant Genetic Conservation Area and the location of trapping sites in each forest type. The small numbered squares are permanent plots; plots 1-2 are in dry dipterocarp forest (DD), plots 3-4 are in ecotone forest (ECO) and plots 5-6 are in dry evergreen forest (DE).
The habitats of the dry evergreen forest fall somewhere between those of tropical rain forests (or moist evergreen forest) and mixed deciduous forests. The forest typically comprises small-to-medium trees with straight stems 4-40 m high. The upper storey (21-40 m high) is dominated by Chan (Shoreasericeiflora) and Kabok (Irvingiamalayana). The middle storey (15-20 m) is dominated by tree species such as Kabaoklak (Hydnocarpusilicifolius), Ohlong (Nenocylonovatum) and Kat lin (Walsuratrichostemon). The lower storey (4-14 m) is dominated by tree species such as Ma fai (Baccaureasapida), Makfak dong (Apodytesdimidiata) and Sanan (Oleasalicifolia). Several pockets of bamboo and seedlings and leafy shrubs of the genera Ardisia, Canthium and Clausena are also found here.
The dry dipterocarp forest is generally open, consisting of uniformly spaced trees forming a three-storey canopy with stem heights ranging from 11-35 m. Dominant tree species in the upper storey (21-35 m) include Teng (Shorea obtuse), Rang (Pentaomosuavis), Krat (Dipterocarpusintricanus) and Phluang (Dipterocarpustuberculatus). Dominant tree species of the middle storey (11-20 m) include Kophae (Quercuskerrii), Kham mokluang (Gardenia sootepensis), Kham moknoi (Gardenia obtusifolia) and Nam thaeng (Randiatomentosa). The ground cover is normally composed of seedlings and grasses, which often include Yak ha (Imperata cylindrical).
Three seasons are recognised locally: a rainy season from May to November; a cold, dry season from mid-November through January; and a hot, dry season from February to April.
Small mammal populations
The population dynamics of small mammals were measured in three different forest habitats: dry dipterocarp forest (DD), ecotone forest (ECO) and dry evergreen forest (DE). The dry dipterocarp forest study plots were situated at approximately 19°2′ 23.329″ N, 99°53′ 36.860″ E on the main road to the reservoir. The area included stands of DD forest and was dominated by Shorea obtuse, Shoreasiamensis and Arundinariapusilla. The ecotone forest study plots were situated at approximately 19°2′ 39.544″ N, 99°53′ 34.004″ E. This area comprised a transition zone from the dry dipterocarp forest to the dry evergreen forest. The area consisted of large trees (Dipterocarpussp.), sparsely distributed amongst small shrubs and short grasses. The dry evergreen forest study plots were located at approximately 19°2′ 30.258″ N, 99°5′ 39.837″ E. This area included stands of DE and was dominated by species such as Afzelisxylocarpa (Kurz) and Dipterocarpusturbinatus Gaertn.f., with a canopy height of 25-30 m.
Trapping grids were positioned randomly within each forest type. Each grid consisted of 49 traps set along seven lines, each with seven traps spaced at 15 m intervals, covering an area of 0.81 ha (Flowerdew et al., 2004). A live-wire trap measuring 32 x 18 x 20 cm was placed at each trapping point (Vieira et al., 2004). The traps were set for three consecutive nights each month from January to December 2011, giving a total of 3,528 trap-nights.
Trapping was conducted during dark phases of the moon (Emmons, 1982) and baited each morning with a mixture of peanut butter and coconut and checked again the following morning between 0800-1200 h. Animals caught were takento a laboratory, where they were anaesthetised with Zoletil®100 (Virbac) (50 mg/kg body weight of Zoletil by intramuscular injection), marked by ear-notching, weighed, measured, sexed and categorised into age classes. Animals that were already marked were recorded as recaptures. For identification, males with testes descended and females with mammary glands prominent were classified as ‘adult’; all other animals not in juvenile pelage were classified as ‘sub-adult’. Individuals of the family Muridae were classified as ‘juvenile’ if they were in juvenile pelage. The animals were then released at the point of capture. For each common species, the total number of individuals captured per 100 trap-nights and assessed trapping success (observed) against season and habitat type was calculated
Small mammal community structure
Determination of population age and sex structure for the four most common species was based on the actual numbers of individuals captured during each trapping period. Sex ratios were examined using Chi-square goodness-of-fit tests (Byers et al., 1984).
Biomass was determined by multiplying the mean adult weight of each species in each habitat with the relative density estimate for that species (individuals/ha) (Grant and Birney, 1979). Seasonal biomass estimates were derived from the average monthly biomass of the population for each species during the rainy (Rainy1: May-July; and Rainy2: August-October), cold (November-January) and hot (February-April) seasons.
Minimum home-range sizes were estimated for animals with multiple captures by connecting the outermost capture sites (minimum convex polygon estimate). In many cases, the number of recaptures was quite small, so these minimum home-range sizes should not be considered true estimates of home range. However, they are presented here as a minimum estimate of the size of the area used by each animal.
Diversity measurements
Species richness and evenness were calculated for the total number of small mammal species trapped in each habitat in each season (Krebs, 1999). Species diversity was determined using the Shannon–Wiener index and Simpson’s index (Magurran, 1988; Burton et al., 1992). These indices were calculated using the estimated abundance of all species for a given sampling period.
Analysis of capture-mark-recapture data
We estimated mammal density for the most common species by simulation and inverse prediction from the capture-recapture data for each habitat in each season using version 4.1 of the programme DENSITY (Efford et al., 2005; http://www.landcareresearch.co.nz/services/software/density/). DENSITY simulated trapping using known parameter values on a 23 factorial design (± 20% of central values of each parameter) with three center points.
The aim of the analysis was to estimate three parameters: D density of population (animals ha-1)
g0 daily probability of capture when the trap is at the center of the home range (day-1)
σ spatial scale (standard deviation of half-normal detection function) (m).
This method matches values of statistics calculated directly from the field data to values of the same statistics calculated with known parameter values (‘matching’) using multivariate linear multiple regression. We used the following statistics as predictors of D, g0 and σ, respectively:
N estimate of closed population size,
p capture probability corresponding to N (day-1) and
RPSV root pooled spatial variance (m)
We used RPSV rather than mean distance between captures, d (Efford, 2004). Therefore, we compared the results for two estimators of N corresponding to different capture-recapture models:
(1) The maximum likelihood estimator for the null model (M0), which assumes that the probability of capturing an animal is constant among different trap-nights (Otis et al., 1978).
(2) The heterogeneity model (Mh), which assumes that each animal has a unique capture probability that remains constant over all trapping occasions (Chao, 1987).
The respective population and density estimates were denoted N0, Nth, D0 and Dth. We chose these models for their contrasting assumptions.
The simulated home-range centers were assumed to follow a Poisson distribution. The simulated population of potentially trappable individuals was considered within the trapping array plus a 100-m buffer, chosen arbitrarily to far exceed the observed mean distance between captures (approximately 30 m). Daily capture probability p was estimated as n/(k/N), where n was the total number of captures and k was the number of sampling nights in each season (k = 3). Simulations spanned ± 20% of the initial parameter values, determined as described in Efford et al. (2004). The precision of density estimates was expressed as CV (estimate) = SE (estimate)/estimate.
Statistical analysis
Analysis of variance (ANOVA) was used to determine the mean species richness and the mean species diversity of the small mammal communities in each season. Small mammal population densities were also compared among habitats and seasons with 95% confidence intervals (CI). In all analyses, the critical value for α was P ≤ 0.05.
RESULTS
Community structure, density and biomass
Data on the distribution and abundance of small mammals were obtained from 3,528 trap-nights over the twelve-month trapping period. The overall trapping success was 29.68%. In total, 371 individuals belonging to nine species in five families were captured. Six species were captured in the dry dipterocarp (DD) forest and ecotone forest (ECO) and seven in the dry evergreen (DE) forest. Trapping success varied greatly among and within sites on a daily and seasonal basis (Table 1). Species captured regularly included the following: Maxomyssurifer, Rattusrattus, Leopoldamyssabanus and Muscervicolor (Muridae); Callosciurusfinlaysoni and Callosciuruserythraeus (Sciuridae); Tupiaglis (Tupaidae); Lepuspeguensis (Lepiridae); and Herpestesjavanicus (Herpestidae). Four species were caught at all sites, and there were species unique to each site. The number of small mammal species trapped was greatest in the DD forest in the hot season, whereas in the ECO and DE forests the number trapped was greatest in the rainy season. The species captured most often were the rodents M. surifer, R. rattus, L. sabanus and the Scandentia T. glis. Less frequently caught species were excluded from any quantitative analysis.
Table 1. Total number of individuals of all species trapped and the trapping rate in the various study areas per 100 trap nights by season.
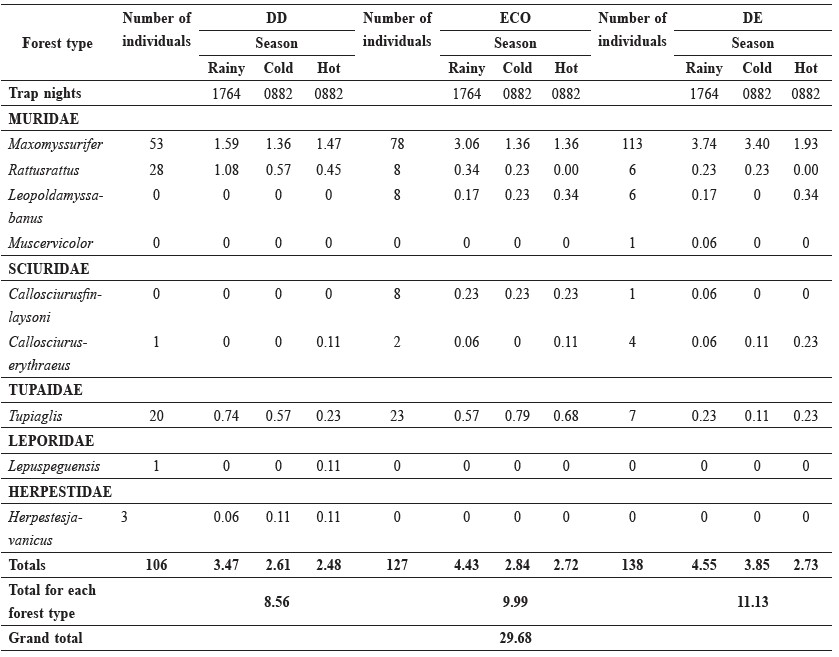
Note: DD = dry dipterocarp forest, ECO = ecotone forest, DE = dry evergreen forest.
Trapping success varied over the study period as shown in Table 1. The DE forest had the greatest trapping success rate at 11.13%, followed by the ECO forest at 9.99% and the DD forest at 8.56%. In all three habitats, the trapping success rates were highest during the rainy season. Of the four most frequently captured species, M. surifer was most often captured during the rainy season in the DE forest, R. rattus was most often captured during the rainy season in the DD forest, Leopoldamyssabanus was most often captured in the hot season in both the ECO and DE forests and T. glis was most often captured in the cold season in the ECO forest.
The seasonal distribution of small mammals showed that the highest number of captures in the ECO forest was in the rainy season, and the lowest number of captures in the DD forest was in the hot season as shown in Table 2.
Table 2. Number of captures (recaptured) and the percentage of recaptures for the total number of small mammals caught in the various forest types over three seasons.
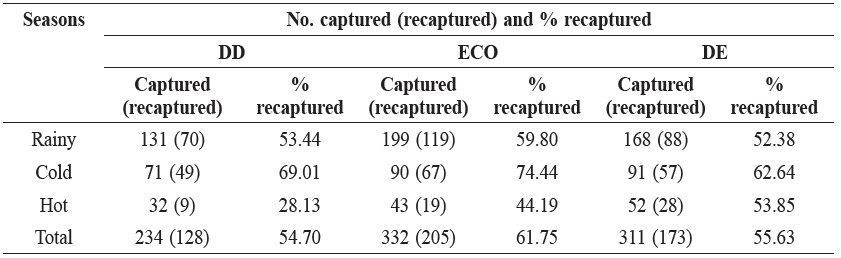
Note: DD = dry dipterocarp forest, ECO = ecotone forest, DE = dry evergreen forest.
The recapture rate data are presented in Table 3. In overall, the percentage of animals recaptured was greatest in the ECO forest in the cold season. R. rattus was the species with the greatest rate of recapture at 93.75% in the DD forest in the cold season, followed by M. surifer at 85.07% in the ECO forest in the cold season, L. sabanus at 78.57% in the ECO and in the DE forests both in the rainy season, and T. glis at 56.00% in the DD forest in the cold season.
M. surifer was the most abundant species captured in all seasons in each habitat type (Table 3). The next most commonly trapped species were T. glis and R. rattus in the DD forest, and T. glis, R. rattus, and L. sabanus in both the ECO and the DE forests. M. surifer, T. glis and R. rattus accounted for over 90% of the total number of caught animals.
Two species of sciurine squirrel, Callosciurusfinlaysoni and Callosciuruserythareus, were captured during the study. They were captured in the ECO and DE forests. Two species of small mammals (M. surifer and T. glis) were captured on every trapping occasion (Table 1).
The three most infrequently caught taxa were Muscervicolor, Lepuspeguensis and Herpestesjavanicus. Only one individual of each was caught (Table 1). M. cervicolor was captured in the rainy season in the DE forest, and L. peguensis and H. javanicuswere captured only during the hot season in the DD forest.
Table 3. Number of captures (recaptured) of nine small mammal species in each forest type and season.
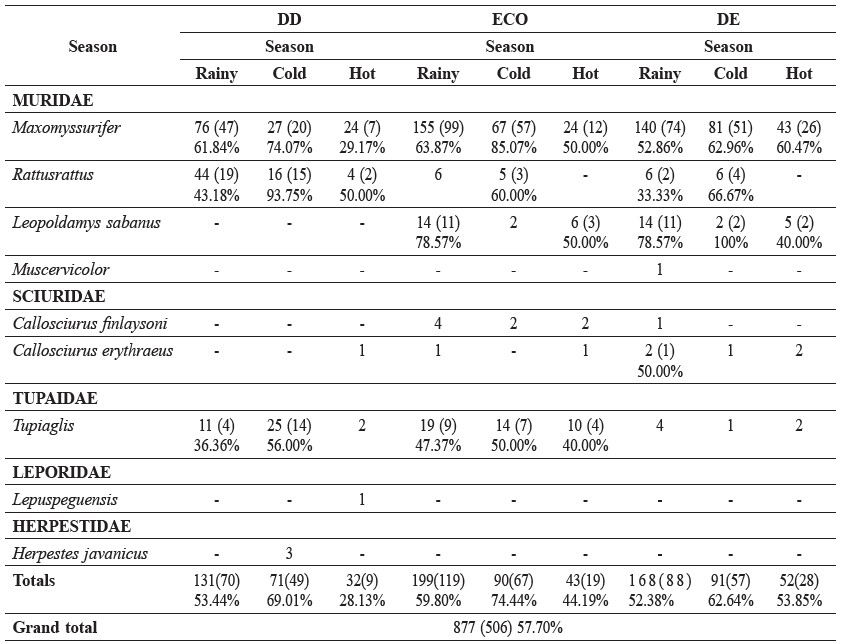
Note: DD = dry dipterocarp forest, ECO = ecotone forest, DE = dry evergreen forest.
The indices of small mammal community structure did not vary significantly among the sites and seasons for any of the calculated indices (Table 4) (P> 0.05 for all ANOVA). Although not statistically significant, the diversity indices were consistently lowest in the DE forest and highest in the cold season in the DD forest. Evenness was highest in the cold season in the ECO forest and lowest in the DE forest. Species richness was equally high in the DD forest, both in the cold and hot season, and lowest in the DE forest in the cold season.
When the overall diversity estimates are considered on an annual rather than seasonal basis, evenness and species richness were highest in the DD forest and lowest in the DE forest (Table 4).
Table 4. Mean diversity, evenness and species richness indices (over 12 months) of small mammal communities in three forest types across seasons.
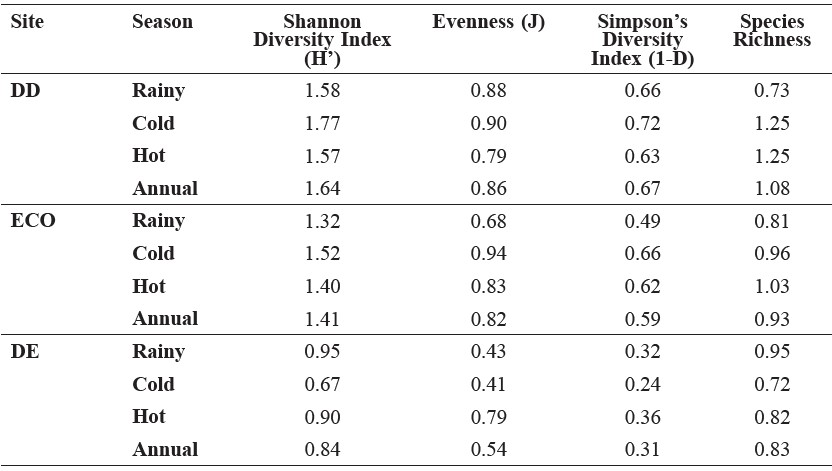
Note: DD = dry dipterocarp forest, ECO = ecotone forest, DE = dry evergreen forest.
Sex and age structure
The sex ratios did not differ significantly from 1:1 at any site for the four most commonly caught species and for L. sabanus (all P> 0.1). In contrast, sex ratios did differ significantly (P < 0.05) for R. rattus at the ECO site, where more males were caught than females, and for M. surifer, of which more males were caught than females in all habitat types. Departure from a 1:1 sex ratio also existed for T. glis at the DD and ECO sites, where more females were caught, and at the DE site, where more males were caught (Figure 2).
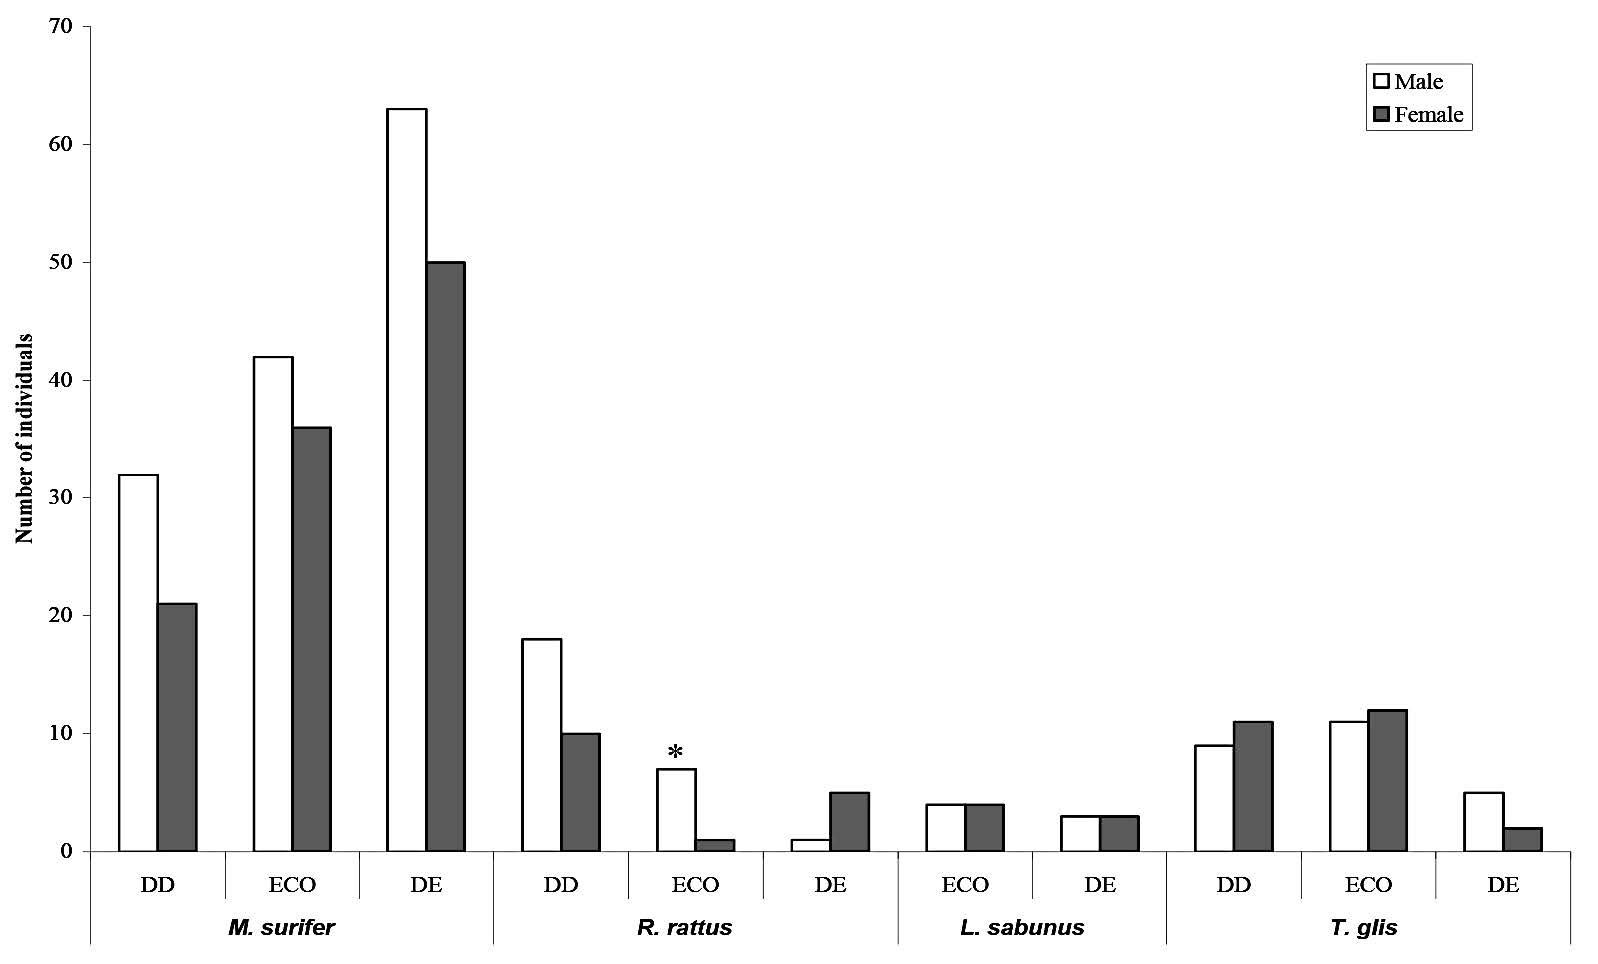
Figure 2. Total number of individuals of each of the most abundant species of small mammals trapped on the grid during the entire study period. Males are indicated by white shading and females by grey shading. DD = dry dipterocarp forest, ECO = ecotone forest, DE = dry evergreen forest.
The population age structure varied considerably across season and forest type (Figs. 3-6). The ratios of adults, sub-adults and juveniles varied by season for the four most common species. For M. surifer, more adults than sub-adults were caught in the hot season, and few juveniles were caught in any season. The population age structure of R. rattus varied by season, with only juveniles being caught in the rainy season in the DE forest, and more sub-adults than adults caught in the cold season in the ECO forest. For both L. sabanus and T. glis, more adults than sub-adults were caught in all seasons, and no juveniles were caught in any season. Most juveniles of both M. surifer and R. rattus were captured during the cold and hot seasons, indicating that their reproductive period begins approximately in the rainy season.
The density and biomass of the four most frequently captured species varied seasonally at each site. The density of M. surifer ranged from 2.95-19.58 individuals/ha across habitats and seasons. Their density was greatest in the cold season in the DE forest and lowest during the second rainy season at the DD site. The density of T. glis ranged from 0.37-14.46 individuals/ha; it was greatest during the second rainy season in the DD forest and lowest during the second rainy season in the ECO forest. The density of R. rattus ranged from 3.49-9.36 individuals/ha, but was calculated only in the two rainy seasons and the cold season. L. sabanus was captured infrequently, so it was excluded from density analysis.
The biomass of the four most frequently captured species ranged from 125 to 345 g/ha across seasons. The biomass of both M. surifer and R. rattus was greatest during the rainy season and lowest during the cold and hot seasons for all habitat types, whereas the biomass of T. glis and L. sabanus varied by season and habitat.
Although some sub-adults and juveniles were captured during the study, these individuals were not included in biomass estimates and would not have contributed substantially to overall biomass. The biomass values report underestimated the true biomass of adults of the four most frequently recaptured species, because the proportion of adults in each sampling occasion was uniformly high in all habitats.
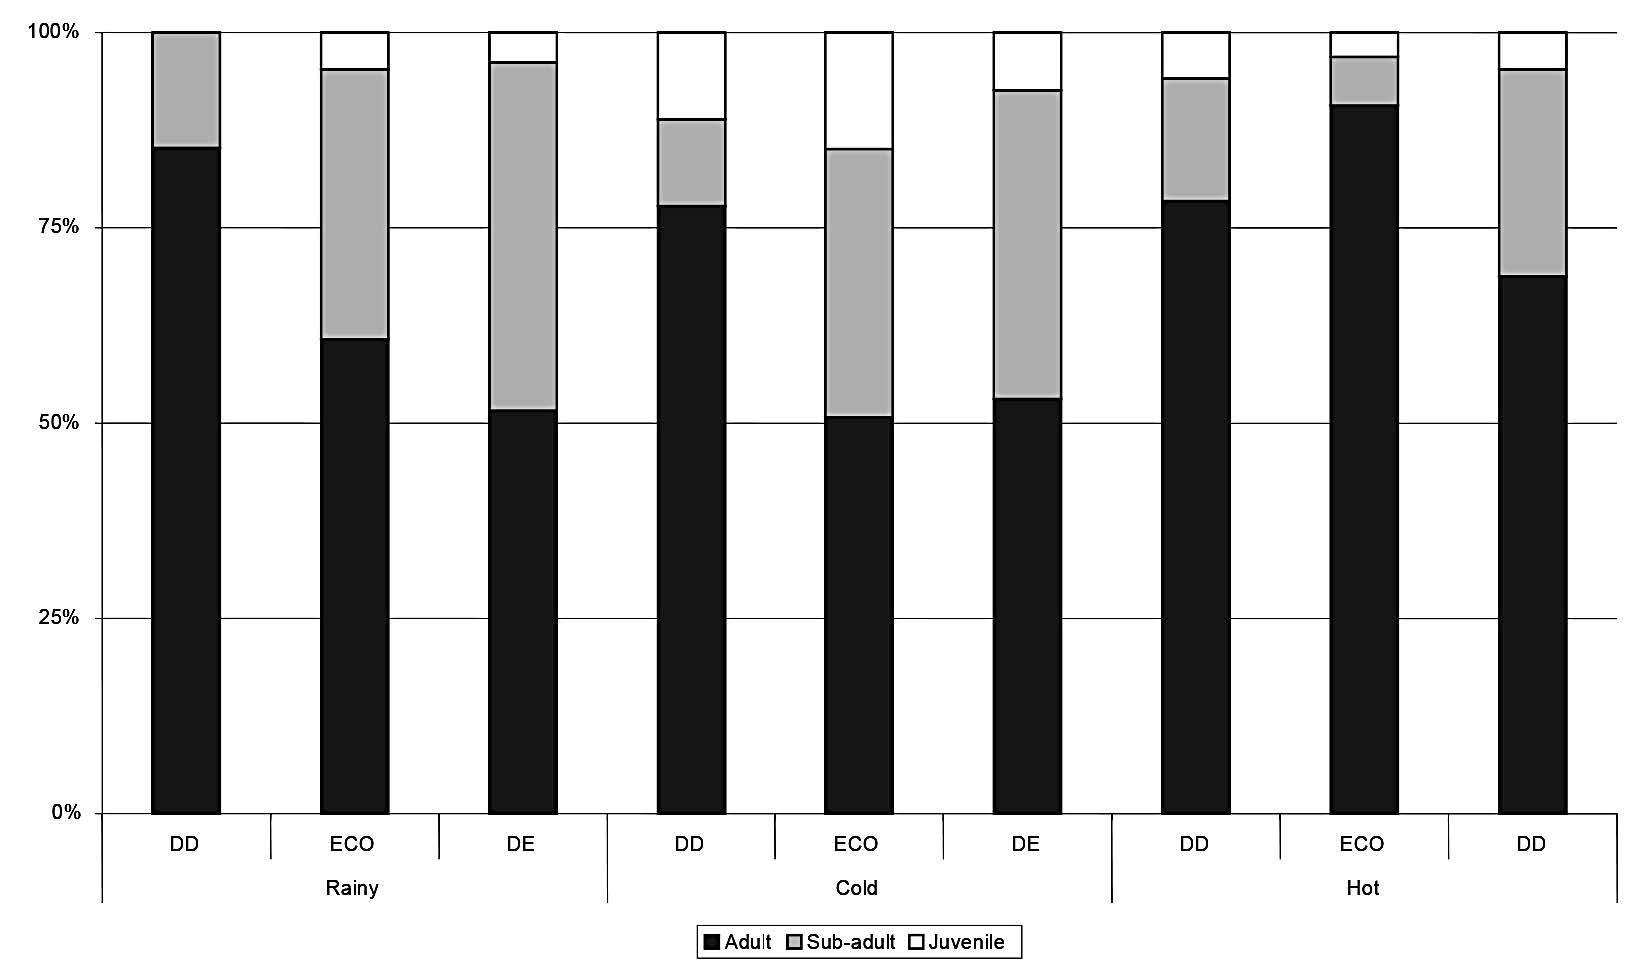
Figure 3. Proportions of adult, sub-adult and juvenile Maxomyssurifer captured in each season in each forest type. DD = dry dipterocarp forest; ECO = ecotone forest; DD = dry evergreen forest.
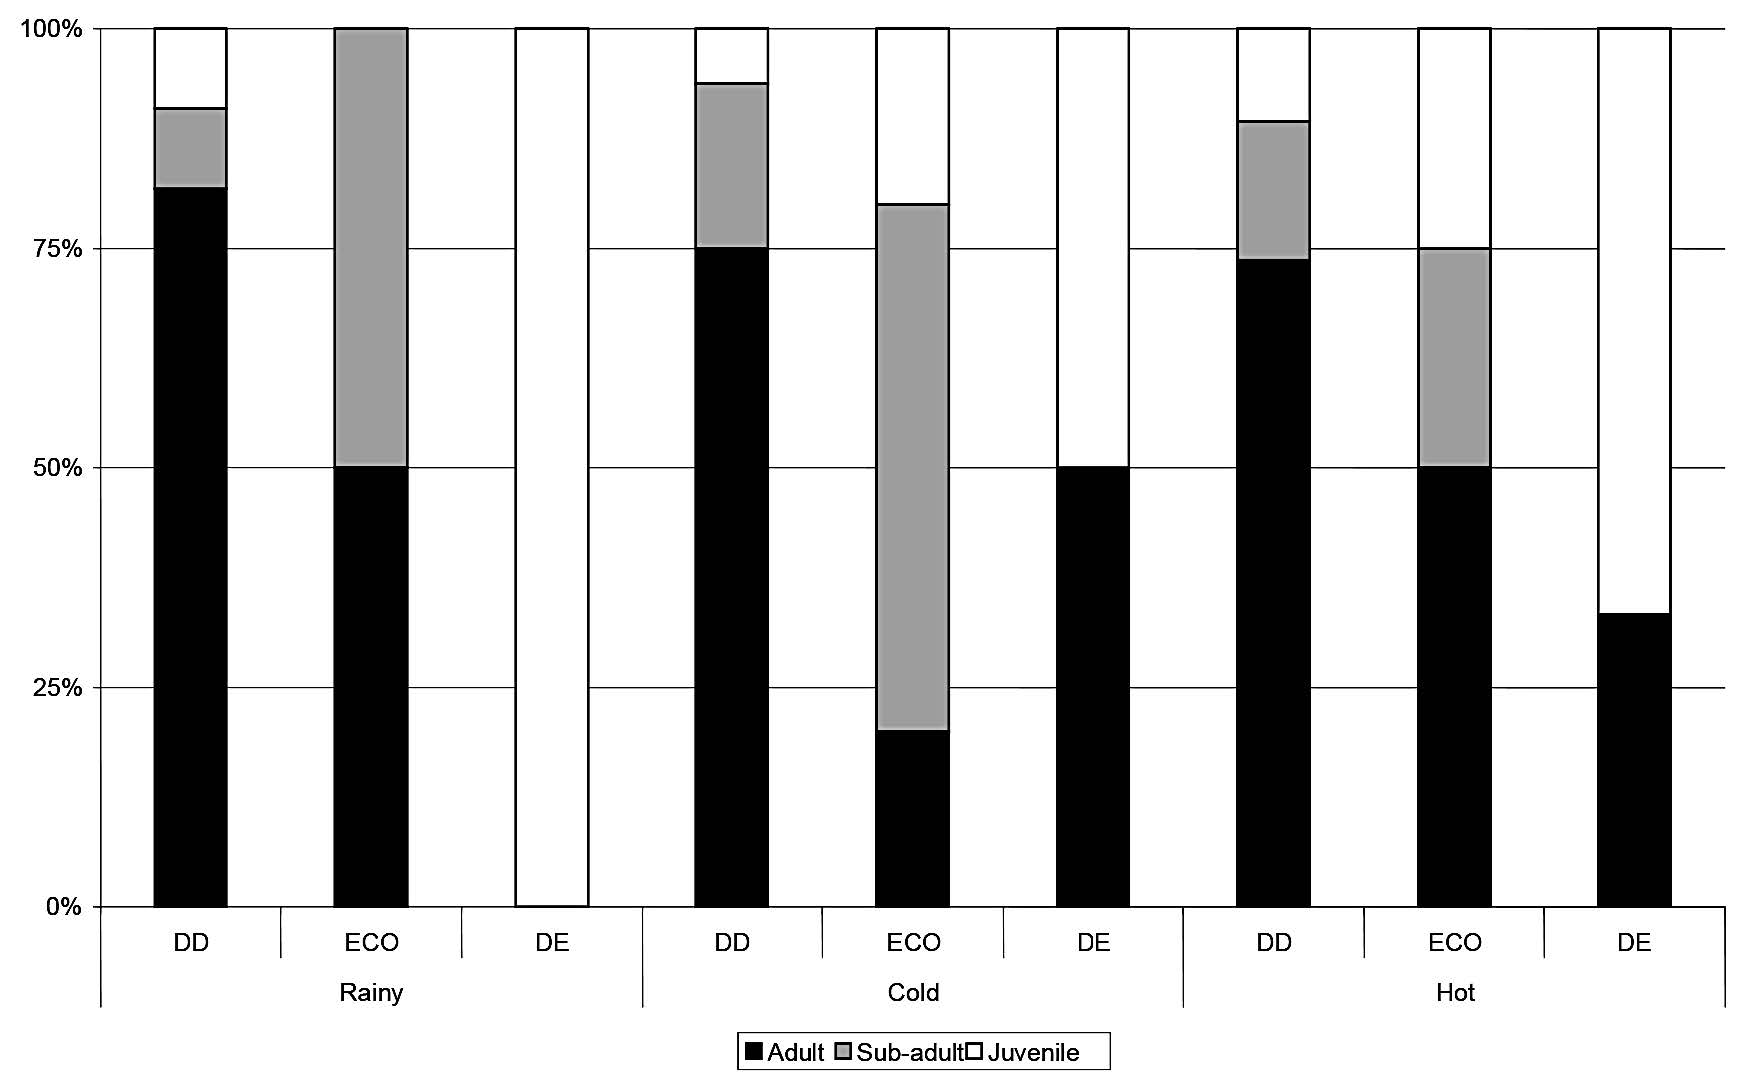
Figure 4. Proportions of adult, sub-adult and juvenile Rattusrattus captured in each season in each forest type. DD = dry dipterocarp forest; ECO = ecotone forest; DD = dry evergreen forest.'
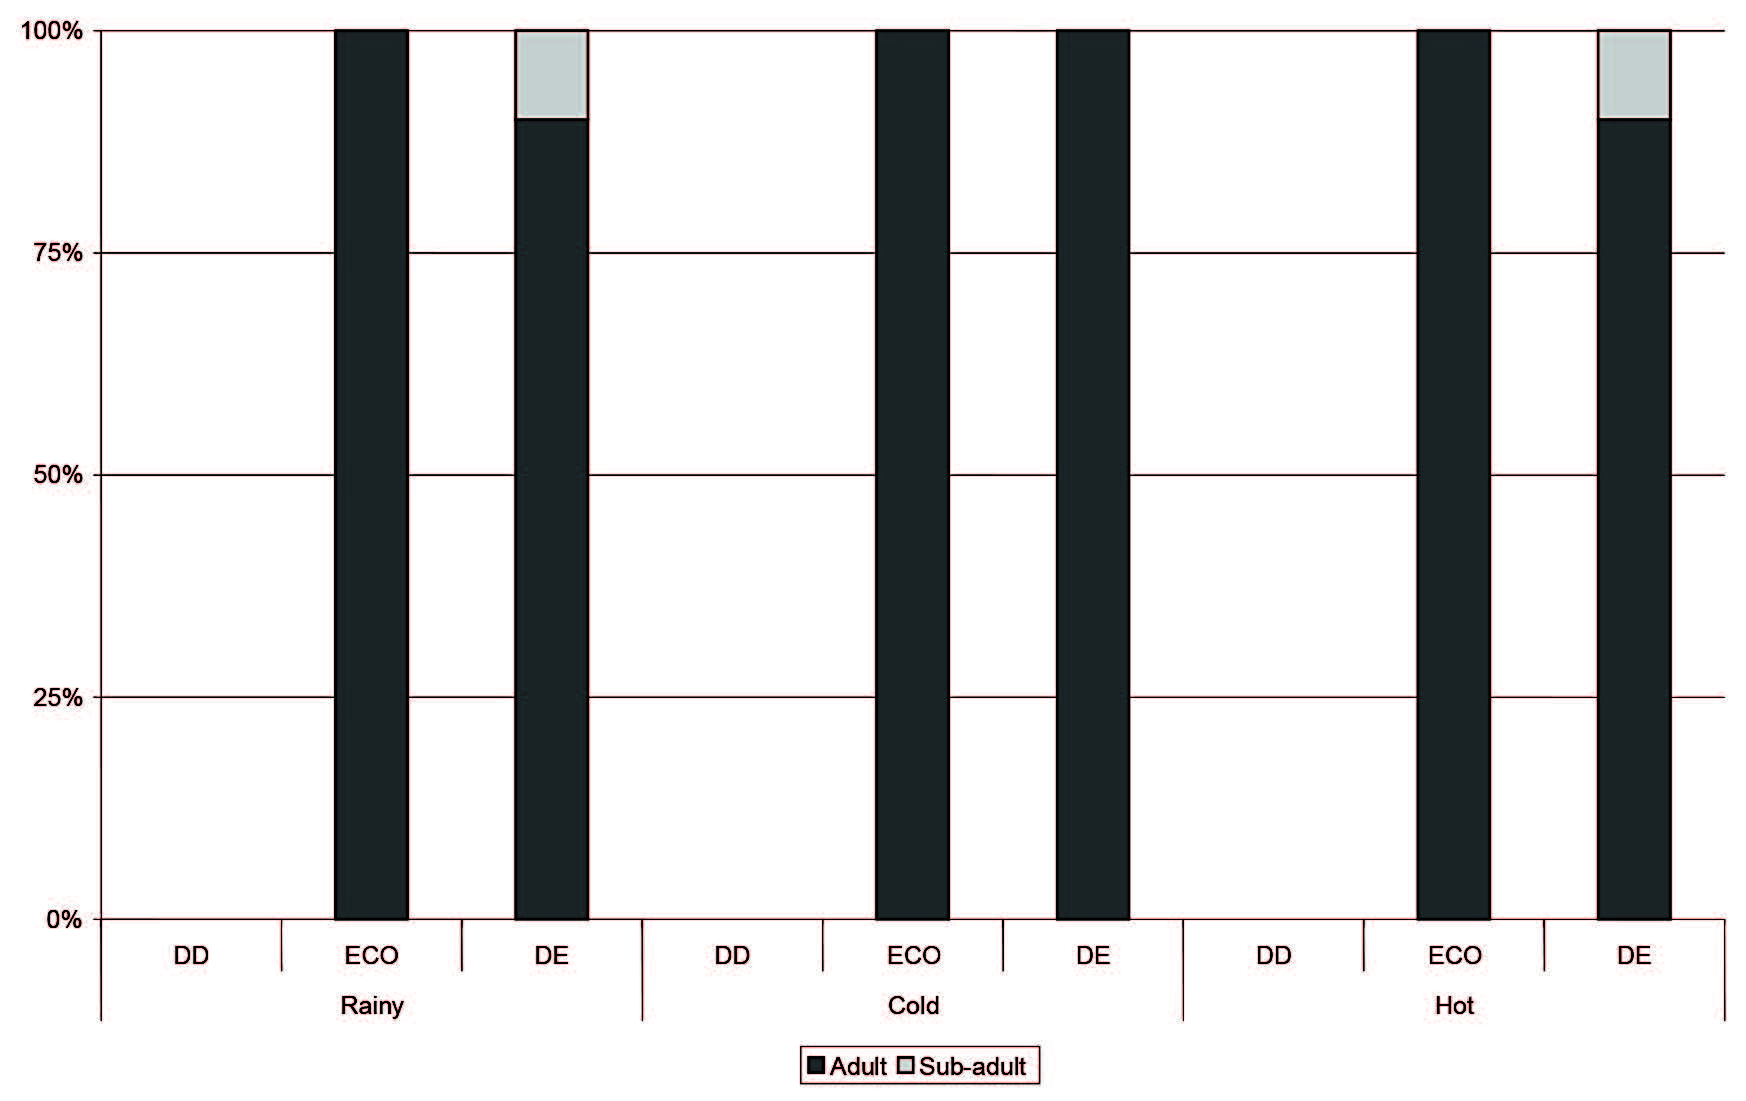
Figure 5. Proportions of adult, sub-adult and juvenile Leopoldamyssabanus captured in each season in each forest type. DD = dry dipterocarp forest; ECO = ecotone forest; DD = dry evergreen forest.
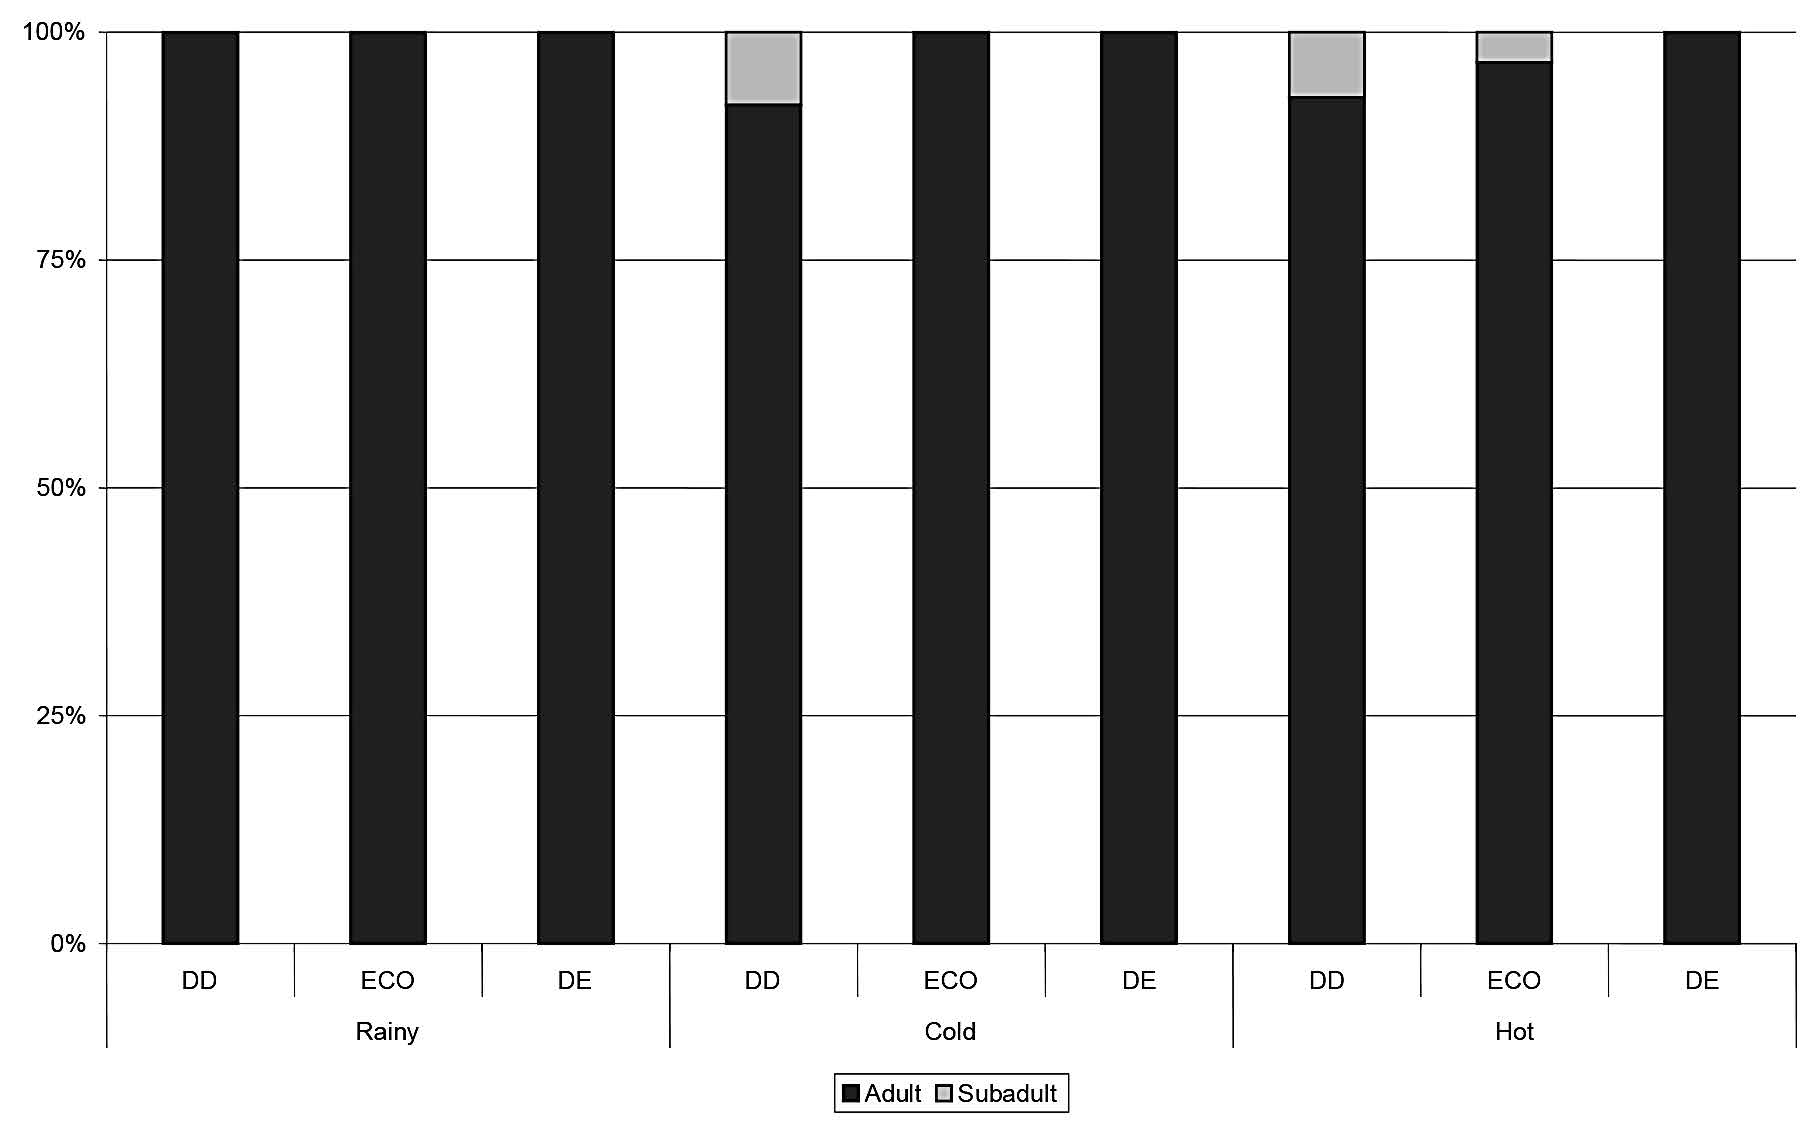
Figure 6. Proportions of adult, sub-adult and juvenile Tupiaglis captured in each season in each habitat type. DD = dry dipterocarp forest; ECO = ecotone forest; DD = dry evergreen forest.
Minimum home range size
For most of the small mammal species caught, the minimum home range estimates were largest during the dry season, including the cold and hot seasons (Table 5). The only exception was M. surifer in the DD forest, which exhibited the largest minimum home-range size during the rainy seasons (Rainy season 1, mean = 0.06 ha; rainy season 2, mean = 0.11 ha) and the smallest minimum homerange size in the hot season (mean = 0.03 ha). The largest minimum home-range size recorded for the four most commonly caught species was 0.39 ha (mean) for T. glis in the ECO forest.
Table 5. Minimum home range size (ha), density and biomass for the four most abundant species of small mammals.
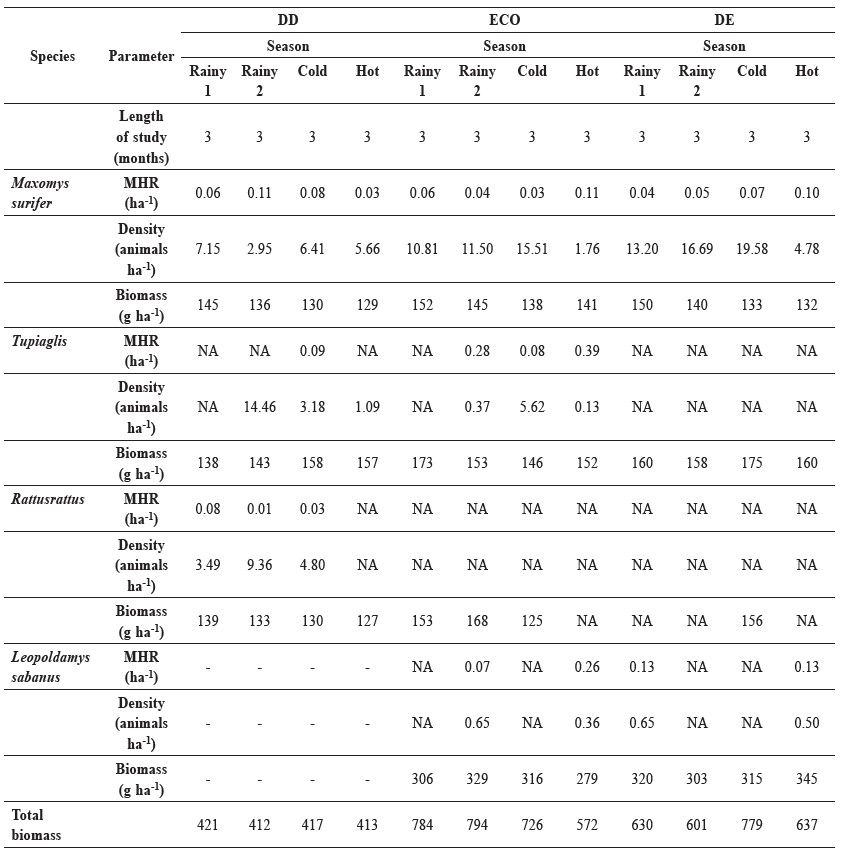
Note: DD = dry dipterocarp forest; ECO = ecotone forest; DD = dry evergreen forest.
Estimated parameters of small mammal populations
Small-mammal density and close population size could be estimated only for four species in each season and habitat type. Individual heterogeneity was detected by the maximum likelihood estimates of densities (D) obtained from two capture-recapture models: the null model (M0) and the heterogeneity model (Mh) (Chao, 1987). Both models gave very similar results. The population size estimates obtained using the heterogeneity model (Mh) were 19.6 ha-1 (95% CI 64.0-102.1) for M. surifer in the cold season in the DE forest and 9.4 ha-1 (95% CI 16.1-66.0) for R. rattus in the second rainy season in the DD forest.
An insufficient number of captures and recaptures were obtained for T. glis and L. sabanus to allow for site-specific density analysis. The estimated scale of movements (σ) (Table 6) for M. surifer was shortest (13.6±1.6 m) in the cold season in the ECO forest and longest (29.1±1.0 m) in the second rainy season in the DD forest. For R. rattus, the estimated scale of movements was shortest (9.6±2.9 m) in the rainy season and longest (14.9±4.7 m) in the hot season in the DD forest. For L. sabanus, the estimated scale was shortest (18.8±5.9 m) in the rainy season and longest (38.4±22.7 m) in the hot season in the ECO forest.
Table 6. The estimated scale of movementsof small mammals by captures and recaptures method.
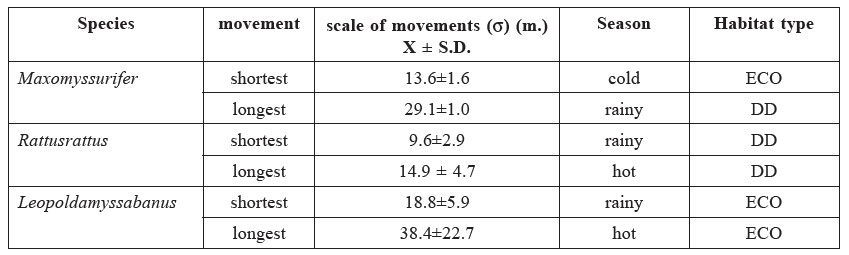
Note: DD = dry dipterocarp forest; ECO = ecotone forest; DD = dry evergreen forest.
DISCUSSION
Small mammal communities
The dry tropical forests studied here contained nine species of small mammals: six in the dry dipterocarp and ecotone forest and seven in the dry evergreen forest. M. surifer, R. rattus, L. sabanus and the Scandentia T. glis were the most frequently captured species. Walker and Rabinowitz (1992) obtained similar results; M. surifer, T. glis, M. berdmorei and L. sabanus were the most common species captured in their study in central Thailand. The murid rodents M. surifer and L. sabanus are very abundant (Langham, 1983; Kemper and Bell, 1985; Walker and Rabinowitz, 1992; Nakagawa et al., 2006) and widespread in the larger stands of rain forest in Malaysia. M. surifer is considered the most abundant species of terrestrial rodent (or terrestrial forest-dwelling rodent) in Southeast Asia (Wells et al., 2004).
L. sabanus was found only in the ecotone and dry evergreen forest. The medium-sized (approximately 2-3 kg) small mammal species L. peguensis and H. javanicus were found in dry dipterocarp forest, indicating that they were relatively common in the study area; however, because of their restricted habitat preference, they were most likely rare or absent in the other forest types (Rabinowitz and Walker, 1991).
Estimating the population densities of tropical dry-forest small mammals has been especially problematic because particular types of traps favour different species. Large wire mesh traps, for example, may be unreliable for species weighing <40 g, such as M. cervicolor (Emmons, 1984). Furthermore, traps were placed only on the ground in this study, so few arboreal species were likely to be caught (Walker and Rabinowitz, 1992). Only two arboreal species, C. finlaysoni and C. erythraeus (Sciuridae), were caught in this study. Several species, including M. cervicolor, C. finlaysoni, C. erythraeus, L. peguensis and H. javanicus, were caught too infrequently to allow determination of their population age structure, density, biomass or minimum home range size.
Dry dipterocarp forest habitats supported the highest species diversity, evenness and species richness, especially in the cold season. However, the species diversity indices were generally higher in the wetter semi-evergreen and moist deciduous forests, consistent with results from India (Chandrasekhar-Rao and Sunquist, 1996). In contrast, Venkataraman et al. (2005) reported that the small-mammal population composition was similar between moist and dry deciduous tropical forests in southern India. The dry evergreen forest in this study had a low species diversity index despite having a complex vegetation structure, possibly as a result of competitive exclusion (Chandrasekar-Rao and Sunquist, 1996). The dominant species of small mammals caught here (six species of rodents and one insectivore) are extremely adaptable and aggressive, which is consistent with this explanation (Chandrasekar-Rao and Sunquist, 1996).
The ecotone forest supported the greatest biomass of small mammals. This finding is consistent with Walker and Rabinowitz’s (1992) results showing that dry evergreen/mixed deciduous forests have a greater biomass of small mammals than dry dipterocarp forest and dry evergreen forest. The gradient of habitat diversity in the ecotone forest is more similar to that of open forest than to that of rain forest, especially when considering the relative homogeneity between the dry dipterocarp forest and the dry evergreen forest with its constant closed canopy and ground vegetation.
The small-mammal diversity indices steadily declined across the transition from the dry dipterocarp forest to the dry evergreen forest, whereas biomass underwent a steady increase in the ecotone forest. The productivity theory ofdiversity suggests that diversity should increase with productivity (Connell and Orias, 1964). However, many studies have found that diversity is highest at intermediate level of productivity (see reviews by Rosenzweig and Abramsky, 1993). In this study, it seems likely that the assumed higher productivity of the ecotone forest is correlated with a higher small-mammal biomass. Small mammal species assemblage structure at the ecotone highlights the close relationship between species and vegetation structure (Williams and Marsh 1998).
The dry evergreen forest supported the highest density of small mammals. Unfortunately, we only obtained sufficient recapture data for one species (M. surifer) to calculate the individual species density in all three habitats. The recapture frequency may well have been influenced by differences in diet specificity and food availability for the other, less widely captured species (Shanker, 2001).There was also a considerable difference in terms of biomass and density in the dry dipterocarp forest. The lower density and biomass of M. surifer in dry dipterocarp forest compared to dry evergreen and ecotone forest could be a product of seasonal perturbations that create a relatively resource-poor habitat (Walker and Rabinowitz, 1992). Moreover, variation in soil fertility has been reported as a factor in the lower productivity of dry dipterocarp forest and is correlated with densities of small mammals in the Amazon (Emmons, 1984).
Most species of small mammals exhibited the largest minimum home range size in the dry season, regardless of habitat. The home range size of M. surifer found here is smaller than that reported by Walker and Rabinowitz (1992); their data indicate that M. surifer has a largest minimum home range size of 0.8 ha in the rainy season and 0.6 ha in the hot season. Most studies of home range size in small rodents have focused on the relationship between spatial patterns and social structure, especially during the breeding season, because densities tend to be high during breeding seasons when males cover larger ranges than females (Ostfeld, 1985; Priotto et al., 2002). Another study suggested that food abundance and population density could influence home range size (Taitt and Krebs, 1981). In that study, food supply was lowest in the dry season and corresponded with an expanded home range size of small mammals as they foraged further in search of food. In addition, animals often migrate to new foraging sites in summer and winter, and the size of home ranges may also vary with sex and age (Burt, 1943).
Much of the seasonal variation in population age structure and the rare occurrence of juveniles were most likely due to breeding-associated patterns of food abundance that may act directly or indirectly to initiate breeding activity. Intra-population variation in age at sexual maturity can occur both between the sexes and among individuals of the same sex (Nicolas and Colyn, 2003). Thus, age structure fluctuates seasonally (Feliciano, 2002; Martins et al. 2006).
Small mammal densities varied with both season and habitat in each species. Of the four most common species, M. surifer had the highest density, especially in the rainy season and cold season. In these seasons, the densities were similar to those reported by Walker and Rabinowitz (1992). Few studies have calculated small mammal density in other parts of Southeast Asia. Rodent densities can vary greatly in tropical evergreen forests, ranging from approximately 0.5 to 25 rodents/ha (Mares and Ernest, 1995). Other studies have found less variation, but the range of densities is similar, for example 4.1-4.9/ha in Malaysia (Harison, 1969) and 0.7-4.9/ha in Venezuela (August, 1984). High densities were found in the Brazilian gallery forest; they ranged from 32 to 53/ha (Nitikman and Mares, 1987). In southern India, Chandrasekar-Rao and Sunquist (1996) reported mean densities of 15 rodents/ha. Other studies have found much lower densities of rodents in mid- and low-elevation evergreen forests, with densities of rodents in deciduous forest in Venezuela generally averaging <1.0 animal/ha (August, 1984).
Data from the dry tropical forest in the University of Phayao Plant Genetic Conservation Area in Northern Thailand suggest that small-mammal species diversity, age structure, biomass and density are related to the heterogeneity of thehabitat and its characteristic vegetation and food resources. Demographic variables were influenced by habitat type, while community structure varied by habitat and season. Long-term studies at other locations, as well as precise information on resource abundance and the ecology of tropical small mammals, including microhabitat preferences, home-range size, and factors affecting community structure, are needed to clarify the drivers of small-mammal community composition and structure in dry tropical forest.
ACKNOWLEDGMENTS
The author thanks the field assistants and volunteer data collectors, as well as the University of Phayao for providing laboratory support for identifying animal species. This work was supported by the Office of the National Research Council of Thailand (NRCT).
REFERNCES
Ashton, P.S. 1990. Thailand: Biodiversity centre for the tropics of Indo-Burma. Journal of the Science Society of Thailand 16: 107-116.
August, P.V. 1983. The role of habitat complexity and heterogeneity in structuring tropical mammal communities. Ecology 64: 1495-1507.
August, P.V. 1984. Population ecology of small mammals in the llanos of Venezuela, in: Martin, R.E., Chapman B.R. (Eds.). Contributions in mammalogy in honor of Robert L. Packard.Special Publications, Museum of Texas Tech University, Texas. pp. 71-104.
Bunyavejchewin, S. 1999. Structure and dynamics in seasonal dry evergreen forest in northeastern Thailand.Journal of Vegetation Science 10: 787-792.
Burt, W.H. 1943. Territoriality and Home Range Concepts as Applied to Mammals. Journal of Mammalogy 24: 346-352.
Burton, P.J., A.E. Balisky, L.P. Coward, S.G. Cumming, and D.D. Kneeshaw. 1992. The value of managing for biodiversity.The Forestry Chronicle 68: 225-237.
Byers, C.R., R.K. Steinhorst, and P.R. Kraus-man. 1984. Clarification of a technique for analysis of utilization-availability data.Journal of Wildlife Management 48: 1050-1053.
Chandrasekae-Rao, A., and M.E. Sunquist. 1996. Ecology of small mammals in tropical forest habitats of southern India.Journal of Tropical Ecology 12: 561-571.
Chao, A. 1987.Estimating the population size for capture-recapture data with unequal catchability. Biometrics 43: 783-791.
Connell, J.H., and E. Orias. 1964. The ecological regulation of species diversity. TheAmerican Naturalist 98: 399-414.
Corbalán, V., and R. Ojeda. 2004.Spatial and temporal organization of small mammal communities in the Monte desert, Argentina. Mammalia 68: 5-14.
Cramerm, J., and M.R. Willig. 2005. Habitat heterogeneity, species diversity and null models.Oikos 108: 209-218. DOI: 10.1111/j.0030-1299.2005.12944.x
Drew, W.B., S. Aksornkoae, and W. Kaitpraneet. 1978. An assessment of productivity in successional stages from abandoned swidden (rai) to dry evergreen forest in northeastern Thailand. Forest Research Bulletin No. 56, Kasetsart University, Bangkok.
Eduardo, C., and V. Grelle. 2003. Forest structure and vertical stratification of small mammals in a secondary Atlantic Forest, southeastern Brazil.Studies on Neotropical Fauna and Environment 38: 81-85.
Efford, M.G. 2004. Density estimation in live-trapping studies.Oikos 106: 598-610. DOI: 10.1111/j.0030-1299.2004.13043.x
Efford, M.G., D.K. Dawson, and C.S. Robbins. 2004. DENSITY: software for analysis capture-recapture data from passive detector arrays. Animal Biodiversity and Conservation 27: 217-218.
Efford, M.G., B. Warburton, M.C. Coleman, and R.J. Barker. 2005. A field test of two methods for density estimation. Wildlife Society Bulletin 33: 731-738.
Emmons, L.H. 1982. Ecology of Proechimys (Rodentia, Echimyidae) in Southeastern Peru.Journal of Tropical Ecology 23: 280-290.
Emmons, L.H. 1984. Geographic variation in densities and diversities of non flying mammals Amazonia. Briotropica 16: 210-222.
Emmons, L.H. 1987. Comparative feeding ecology of felids in a neotropical rainforest. Behavioral Ecology and Sociobiology 20: 271-283.
Feliciano, B.R., F.A.S. Fernandez, D.D. Freitas, and M.S.L. Figueiredo. 2002. Population dynamics of small rodents in a grassland between fragment of Atlantic Forest in southeastern Brazil. Mammalian Biology 67: 304-314.
Fleming, T.H. 1975. The role of small mammals in tropical ecosystems, in: Golly, F.B., Petrusewicz, K., Ryszkowski, L. (Eds.). Small mammals:their productivity and population dynamics. Cambridge University Press, Cambridge. pp. 269-298.
Flowerdew, J.R., R.F. Shore, S.M.C. Poulton, and T.H. Sparks. 2004. Live trapping to monitor small mammals in Britain.Mammal Review 34: 31-50. DOI: 10.1046/j.0305-1838.2003.00025.x
Golley, F.B., and L. Ryszkowski. 1975. Small mammals: their productivity and population dynamics. Cambridge University Press, Cambridge.
Grant, W.E., and E.C. Birney. 1979.Small mammal community structure in North American grasslands. Journal of Mammalogy 60: 23-36.
Harison, J.L. 1969. The abundance and population density of mammals in Malayan lowland forest.Malayan Nature Journal 22: 174-178.
Hayward, G.F., and J. Phillipson. 1979. Community structure and functional role of small mammals in ecosystems, in: Stoddart, M. D. (Ed.). Ecology of Small Mammals.Chapman & Hall. London, pp. 135-212.
Holmes, S.S., and L.C. Dricamer. 2001. Impact of forest patch characteristics on small mammal communities: a multivariate approach. Biological Conservation 99: 293-305. DOI: 10.1016/S0006-3207(00)00195-6
Kemper, C., and D. Bell. 1985. Small mammals and habitat structure in lowland rain forest of Peninsular Malaysia. Journal of Tropical Ecology 1: 5-22.
Krebs, C.J. 1999. Ecology Methodology, second ed. Benjamin Cummings. California.
Langham, N. 1983. Distribution and ecology of small mammals in three rain forest localities of peninsular Malaysia with particular references to Kedah Peak.Biotropica15:199-206.
Lim, B.L. 1970. Distribution, relative abundance, food habits and parasite patterns of giant rats (Rattus) in West Malaysia.Journal of Mammalogy 51: 730-740.
Magurran, A.E. 1988. Ecological diversity and its measurement. Princeton University Press. California.
Mares, M.A., and K.A. Ernest. 1995. Population and community ecology of small mammals in a Gallery Forest of Central Brazil. Journal of Mammalogy 76: 750-768.
Martins, E.G., V. Bonato, C. Queiroz da-Silva, and S. Furtado dos-Reis. 2006. Seasonality in reproduction, age structure and density of the gracile mouse opossum Gracilinanusmicrotarsus (Marsupialia: Didelphidae) in a Brazilian cerrado. Journal of Tropical Ecology 22: 461-468. DOI: 10.1017/S0266467406003269
Murphy, P., and A.E. Lugo. 1995. Dry forests of Central America and the Caribbean, in: Bullock, S.H., Mooney, H.A. & E. Medina (Eds.). Seasonally dry tropical forests. Cambridge University Press. Cambridge. pp. 146-194
Nakagawa, M., H. Miguchi, and T. Nakashizuka. 2006. The effects of various forest uses on small mammal communities in Sarawak, Malaysia.Forest Ecology and Management 231: 55-62. DOI: 10.1016/j.foreco.2006.05.006
Nicolas, V., and M. Colyn. 2003. Seasonal variation in population and community structure of small rodent in tropical forest of Gabon.Canadian Journal of Zoology 81:1034-1046. DOI: 10.1139/z03-092
Nitikman, L.Z., and M.A. Mares. 1987. Ecology of small mammals in a gallery forest of central Brazil.Annals of Carnegie Museum 56: 75-95.
Ostfeld, R.S. 1985. Limiting resources and territoriality in microtine rodents.The American Naturalist 126: 1-15.
Otis, D.L., K.P. Burnham, G.C. White, and D.R. Anderson. 1978. Statistical inference from capture data on closed animal populations. Journal of the American Statistical Association 76, 498.
Pontes, A.R.M. 2004. Ecology of a community of mammals in a seasonally dry forest in Roraima, Brazilain Amazon.Mammalian Biology 69: 319-336.
Prins, H.H.T., and J.M. Reitsma. 1989. Mammalian biomass in an African equatorial rain forest.Journal of Animal Ecology 58: 851-861.
Priotto, J.W., A.R. Steinmann, and J.J. Polop. 2002. Factors affecting home range size and overlap in Calomysvenustus (Muridae: Sigmodontinae) in Argentine agroecosystems. Mammalian Biology 67: 97-104.
Rabinowitz, A.R., and S. Walher. 1991. The carnivore community in a dry tropical forest mosaic in HuaiKhakhaeng Wildlife Sanctuary, Thailand. Journal of Tropical Ecology 7: 37-47.
Rao, C., and A. Sunquist. 1996. Ecology of small mammals in tropical forest habitats of southern India.Journal of Tropical Ecology 12: 561-571.
Rickarta, E.A., L.R. Heaney, D.S. Balete, and B.R. Tabaranza. 2011. Small mammal diversity along an elevational gradient in northern Luzon, Philippines Mammalian Biology 76:12-21. DOI: 10.1016/j.mambio.2010.01.006.
Rosenzweig, M.L., and Z. Abramsky. 1993. How are diversity and productivity related?, in; Ricklefs, R. E., Schluter, D. (Eds.). Species diversity in ecological communities: historical and regional perspective. University of Chicago Press. Chicago. pp 52-65.
Rosenzweig, M.L., and J. Winakur. 1969. Population ecology of desert rodent communities: habitats and environmental complexity. Ecology 50: 558-572.
Shanker, K. 2001.The role of competition and habitat in structuring small mammal communities in a tropic montane ecosystem in southern India. Journal of Zoology (London) 253: 15-24. DOI: 10.1017/S0952836901000024
Shanker, K., and R. Sukumar. 1999. Synchrony in small mammal populations of montane forest patches India. Journal of Tropical Ecology 68: 50-59. DOI: 10.1046/j.1365-2656.1999.00263.x
Stott, P. 1986. The spatial pattern of dry season fires in the savannah forests of Thailand. Journal of. Biogeography 13: 345-358.
Sukwong, S. 1982. Analysis of the dry dipterocarp forest vegetation in Thailand. Journal of the National Research Council of Thailand 14: 55-65.
Taitt, M.J., and C.J. Krebs. 1981. The effect of extra food on small rodent populations: II.Voles (Microtustownsendii). Journal of Animal Ecology 50: 125-138.
Taraborelli, P.A., V. Corbaln, and S. Giannoni. 2003. Locomotion and escape modes in rodents of the Monte desert (Argentina). Ethology 109: 475-485. DOI: 10.1046/j.1439-0310.2003.00884.x
Taraman, V., K. Shanker, and R. Sukumar. 2005. Small mammal: communities of tropical forest habitat in Mudumalai Wildlife Sanctuary, southern India. Mammalia 69: 3-4.
Tews, J., U. Brose, V. Grimm, K. Tielborger, M.C. Wichmann, M. Schwager, and F. Jeltsch. 2004. Animal species diversity driven by habitat heterogeneity/diversity: the importance of keystone structures. Journal of Biogeography 31: 79-92.
Vieira, M.V., C.E.V. Grelle, and R. Gentile. 2004. Differential trappability of small mammals in three habitats of southeastern Brazil. Brazilian Journal of Biology 64: 895-900.
Venkataraman, M., K. Shanker, and R. Sukumar. 2005. Small mammal communities of tropical forest habitats in Mudumalai Wildlife Sanctuary, southern India. Mammalia 69: 349-358.
Walker, S., and A. Rabinowitz. 1992. The small-mammal community of a drytropical forest in central Thailand.Journal of Tropical Ecology 8: 57-71.
Wells, K., E.K.V. Kalko, M.B. Lakim, and M. Pfeiffer. 2007. Effects of rain forest logging on species richness and assemblage composition of small mammals in Southeast Asia.Journal of Biogeography 34: 1087-1099. DOI: 10.1111/j.1365-2699.2006.01677.x
Wells, K., M. Pfeiffer, M.B. Lakim, and E.K.V. Kalko. 2006. Trajectories and habitat partitioning of small mammals in logged and unlogged rain forests on Borneo. Journal of Animal Ecology 75: 1212-1223.
Wells, K., M. Pfeiffer, M.B. Lakim, and K.E. Linsenmair. 2004. Use of arboreal and terrestrial space by a small mammal community in a tropical rain forest in Borneo, Malaysia. Journal of Biogeography. Journal of Biogeography 31: 641-652.
Williams, S.E., and H. Marsh. 1998. Changes in small mammal assemblage structure across a rain/open forest ecotone. Journal of Tropical Ecology 14: 187-198. DOI: 10.1017/S0266467498000157
Zhou, Y.B., L. Zhang, Y. Kaneko, C. Newman, and X.M. Wang. 2008. Frugivory and seed dispersal by a small carnivore, the Chinese ferret-badger, Melogalemoschata, in a fragmented subtropical forest of central China. Forest Ecology and Management 255: 1595-1603. DOI: 10.1016/j.foreco.2007.11.018
Sitthisak Pinmongkholgul*
Division of Biology, School of Science, University of Phayao, Phayao 56000, Thailand
*Corresponding author. E-mail: Sitthisak.pi@up.ac.th
Total Article Views