
FreshWater Fish Diversity at Greater Noakhali, Bangladesh
M.Shahadat Hossain*, Subrata Sarker, M.Ziaur Rahaman and M.Mizanur RahmanPublished Date : 2019-08-25
DOI : 10.12982/CMUJNS.2014.0032
Journal Issues : Number 2,May-August-2014
Abstract
This study assessed the spatial-temporal diversity of fish at greater Noakhali, an aquatic ecosystem that supports the most diverse fish communities in Bangladesh. Fish samples were collected from eight locations from July 2010 to June 2011 and diversity analyzed using PAST software. Findings showed that greater Noakhali is the habitat for 128 fish species. For the whole sampling area, the Shannon diversity index, evenness, Margalef richness and dominance index values were 4.501, 0.889, 15.763 and 0.012, respectively. Oreochromis mossambicus, Mastacembelus armatus and Tenualosa toli were the major contributory species in temporal terms and Tenualosa ilisha, Somileptes gongota and Mystus vittatus in spatial terms.
Keywords: Freshwater, Fish biodiversity, Noakhali, Bangladesh
Introduction
The extensive freshwater resources in Bangladesh (5,433,900 ha, covering 37% of the country) are the third most bio-diverse aquatic fishery in Asia, after China and India, with about 800 species in fresh, brackish and marine waters (Hussain and Mazid, 2001). This species diversity has been attributed to the diverse aquatic ecosystems that are scattered across the country in the form of rivers, ponds, ditches, lakes, beels/haors/baors (saucer shaped water bodies with monsoon expansion and winter contraction), floodplains and canals. Total fish production from the inland/freshwater area in 2003-04 was 914,752 MT, representing 78.3% of total fisheries production, accounting for 4.92% of GDP, 23% of the gross value added to agricultural products, more than 11% of export earnings, and employment for over 2 million people (DoF, 2005). Although fish provide 63% of Bangladesh’s animal protein intake, fisheries production is not keeping pace with population growth (Hussain, 2010). To address this issue, the fisheries sector needs to maximize fish production in parallel with conserving its biological diversity.
Fisheries populations are very dynamic, both temporally and spatially (Chowdhury et al., 2010). Greater Noakhali possesses an extensive aquatic ecosystem, which supports multitudes of species of plants, fish, prawn and other organisms. Of these, fish are the most important element and the major source of dietary protein for the rural poor. This sector also generates employment opportunities that form the lifeline for the rural economy. Only a few years back, greater Noakhali contained a huge number of fish. However, over-exploitation, habitat alteration and indiscriminate use of agro-chemicals has led to drastic declines in their numbers, threatening people’s livelihood. Considering the lack of baseline information on the fish species of greater Noakhali, this study explores the existing fish faunal composition, including their temporal and spatial diversity, of greater Noakhali.
Study area
This study was conducted at greater Noakhali (Figure 1), located at the central coastal zone of Bangladesh between latitude 22°30′ and 23°15′ N and longitude 89°45′ and 91°30′ E. The Noakhali River and small Feni River join many canals, tributaries, creeks and stream corridors. The tidal range at the Noakhali coast is large, ranging from 0.48 m at neap tide to 3.79 m at spring tide (Das and Hossain, 2005). Average temperatures vary between 12°C during December-February to 34°C during April-June. The monsoon or rainy season (June-October) is characterized by southeast monsoon winds with high rainfall, humidity and cloud cover. The greater Noakhali possesses different types of aquatic ecosystems, supporting a multitude of aquatic flora and fauna (Hossain, 2009).
Fisheries in this area support livelihood options for a significant proportion of the rural population, who primarily grow rice and fish, and to a lesser extent are engaged in fisheries aquaculture (Hossain and Das, 2010). The fishermen of the Noakhali coast fish for goby from early November to late March and for Bombay duck with estuarine set bag net and small-engine boats at the Meghna estuary from mid November to late March (Hossain, 2011). From late May to early November, they fish Hilsha. Besides fishing in rivers and estuaries, fishermen also use seine nets in local ponds along with hand nets, push nets, lift nets and traps in ponds, canals, rivers, creeks and flood plains.
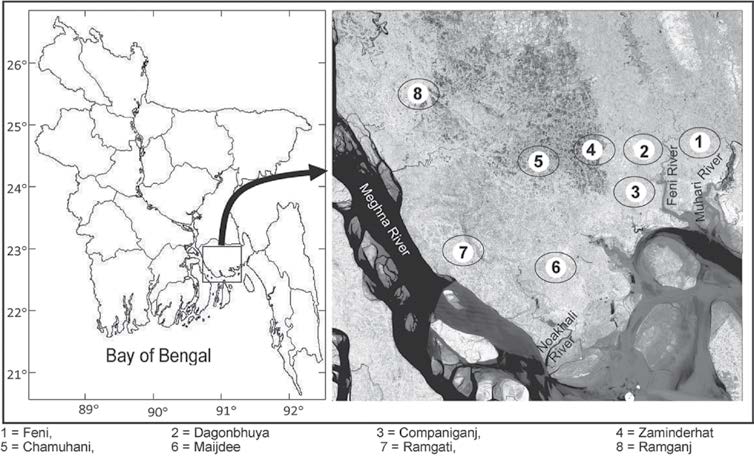
Figure 1. Geographical location of greater Noakhali, Bangladesh.
Materials and methods
Data collection
To collect fish species specimens, the study area is divided into eight sampling stations: Feni (sampling station #1, hereafter St 1), Dagonbhuya (St 2), Companiganj (St 3), Zaminderhat (St 4), Chamuhani (St 5), Maijdee (St 6), Ramgati (St 7) and Ramjanj (St 8). Fish samples were collected from July-October 2011 through extensive field visits. The fish were collected with seine nets, hand nets, push nets, lift nets, traps and hooks. Generally, fishermen throw away non-target fish, whether alive or dead, that they catch as a byproduct. Local fishermen were requested to keep all fish, target and non-target, for our research purposes. Samples were collected through personal visits to fishing and landing centers as well as fish markets in the area. Fishermen, fish traders and fish farmers were consulted for sampling purposes. Samples were collected, photographed and refrigerated. Chemicals were not added to preserve the fish. The samples were then transferred to the lab for taxonomic identification. The specimens were identified using the keys of Hamilton, 1822; Bhuiyan, 1964; Fischer & Whitehead, 1974; Shafi & Quddus, 1982; Rahman, 1989; Talwar & Jhingran, 1991; Bhuiyan et al., 1992; DeBruin et al., 1995; Siddiqui et al., 2007 and Hossain et al., 2007.
Data analysis
In the first stage of data analysis, the diversity of the fish assemblage was quantified and compared statistically. Paleontological Statistics (PAST) version 2.15, a software package for paleontological data analysis written by P.D. Ryan, D.A.T. Harper and J.S. Whalley, was used to run the analysis. PAST has grown into a comprehensive statistics package that is used not only by paleontologists, but also in many fields of life science, earth science, and even engineering and economics. Species diversity was assessed using four different indices: Shannon–Wiener, richness, evenness and dominance indices in both the spatial and temporal spectrum. The pre-monsoon, monsoon and post-monsoon diversity indices were calculated from the spatial raw data by combining the fish communities of all study sites. All indices –Shannon-Weiner, Margalef, evenness and dominance – were calculated from the raw data for each temporal assemblage of fish. Shannon-Weiner diversity index (Shannon, 1949; Shannon & Weaver, 1963; Ramos et al., 2006) considers both the number of species and the distribution of individuals among species. Shannon-Weiner diversity was calculated by the following formula:

Where, S is the total number of species and Pi is the relative cover of ith species.
Margalef index (d) (Margalef, 1968) measured species richness according to the following formula:
d = (S-1)/log N
Where S is total species and N is total individuals.
Buzas and Gibson's evenness (Harper, 1999) was measured by the following formula:
E= eH/S
The dominance index (Harper, 1999) determines whether particular fisheries species dominate in a particular aquatic system. It is a useful index of resource monopolization by a superior competitor, particularly in communities that have been invaded by exotic species. This index was determined by the following formula:
Where ni is number of individuals of species i.
One-way analysis of variance (ANOVA) was used for diversity indices to calculate any difference among the months and stations. In the event of significance, a post-hoc Tukey HSD test determined which means were significantly different at a 0.05 level of probability (Spjotvoll & Stoline, 1973). Similarity percentages analysis (SIMPER) (Clarke, 1993) determined the percentage of similarity among months and stations. In addition, SIMPER also estimated the percentage of major contributing species, for both months and stations. Hierarchical clustering (Clarke & Warwick, 1994) produced a dendrogram for investigating similarities among months and stations.
Results
Species abundance and distribution
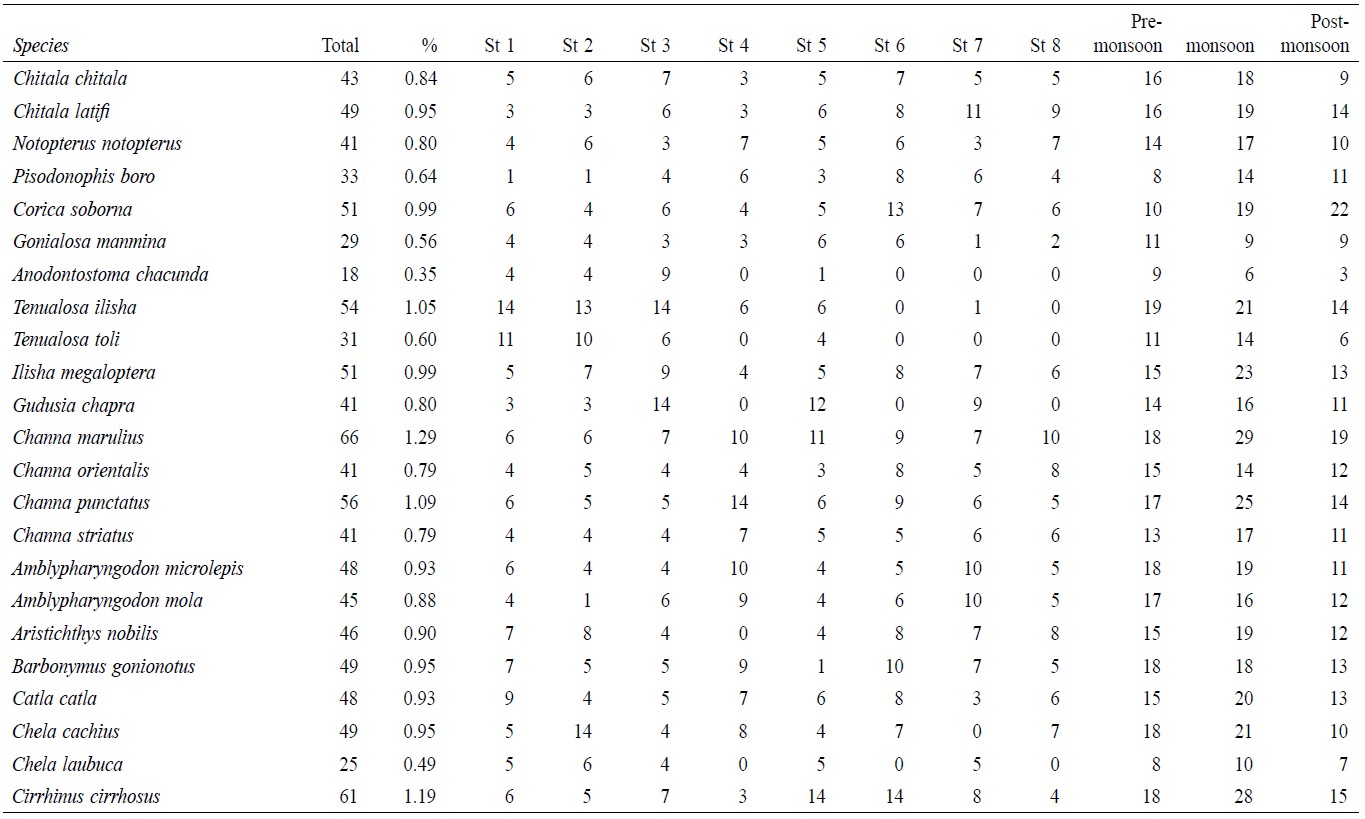
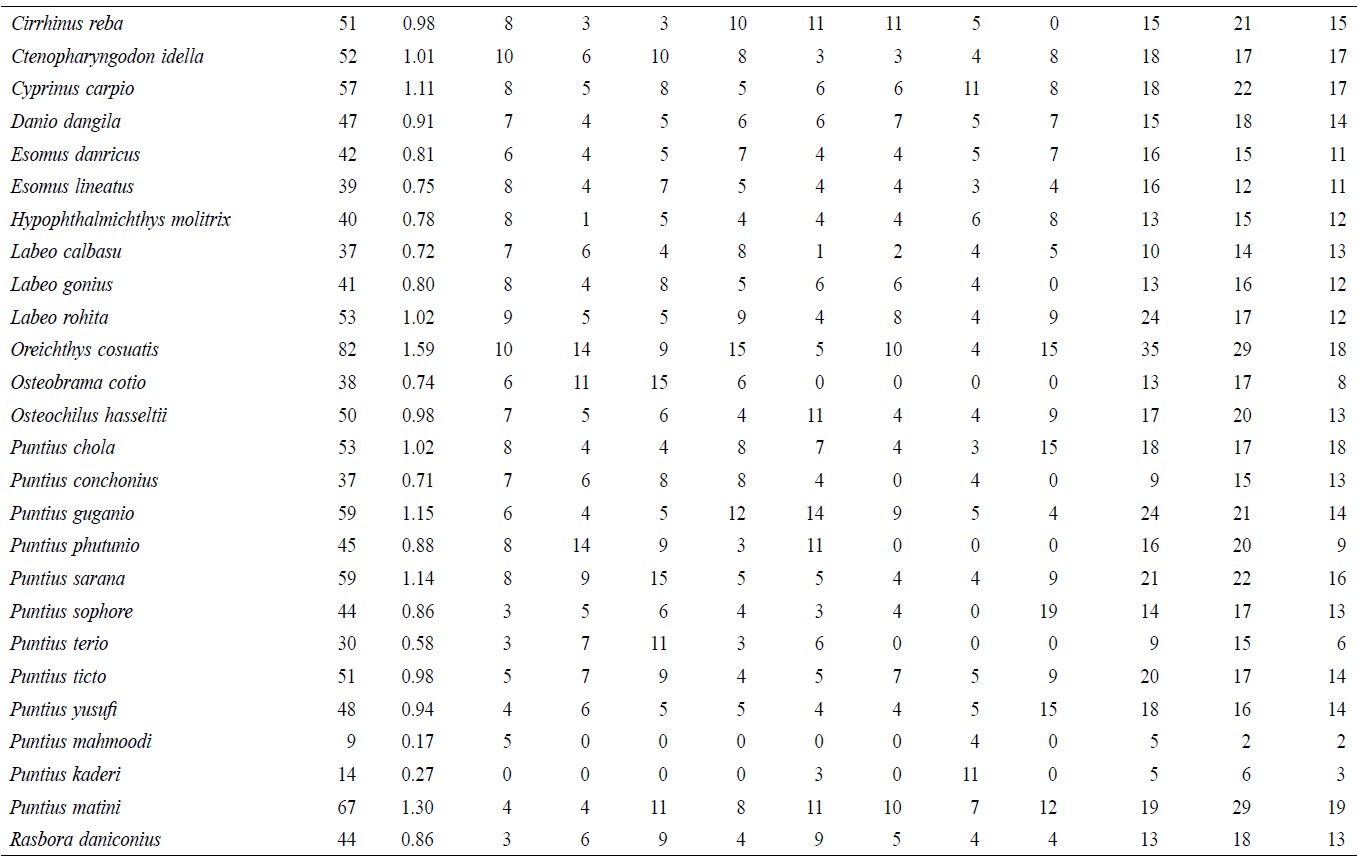
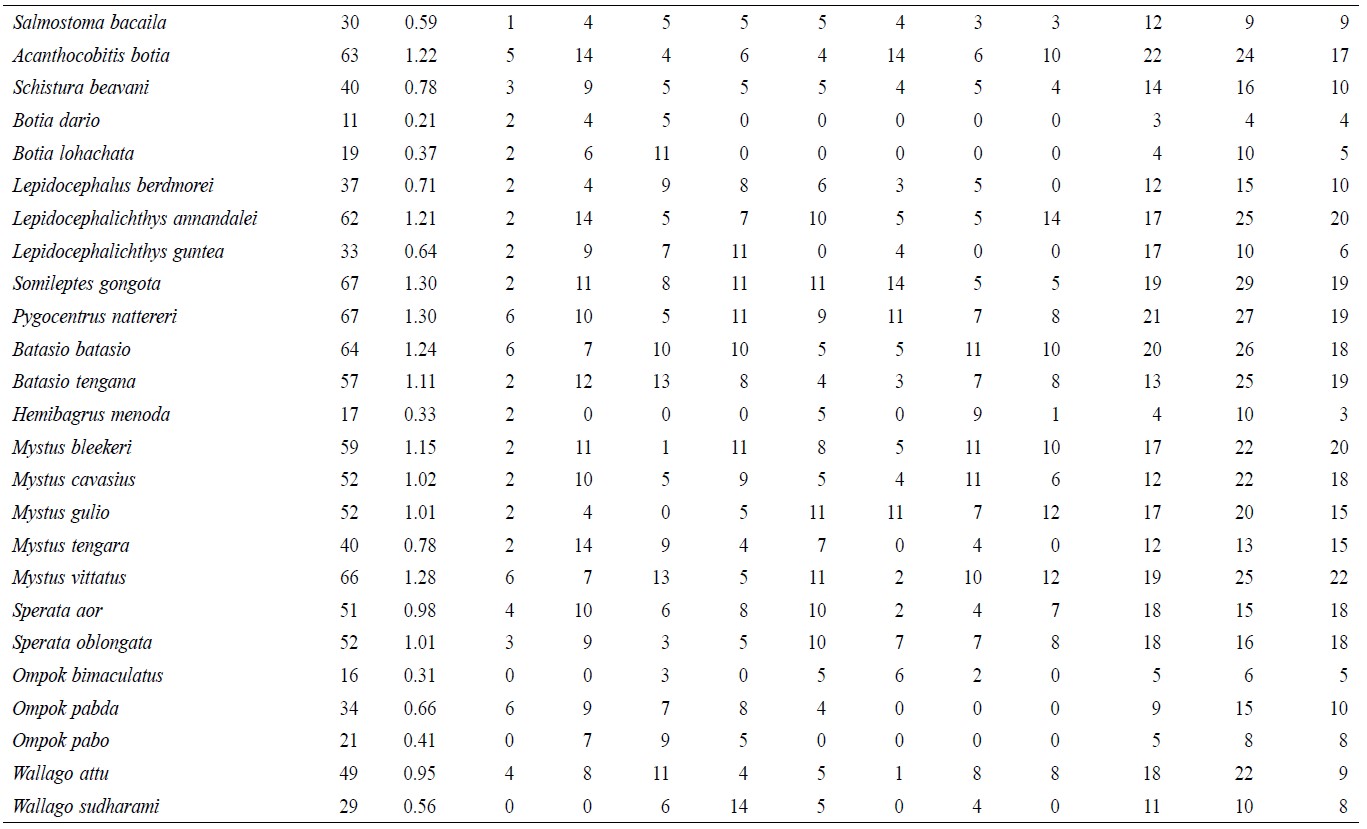
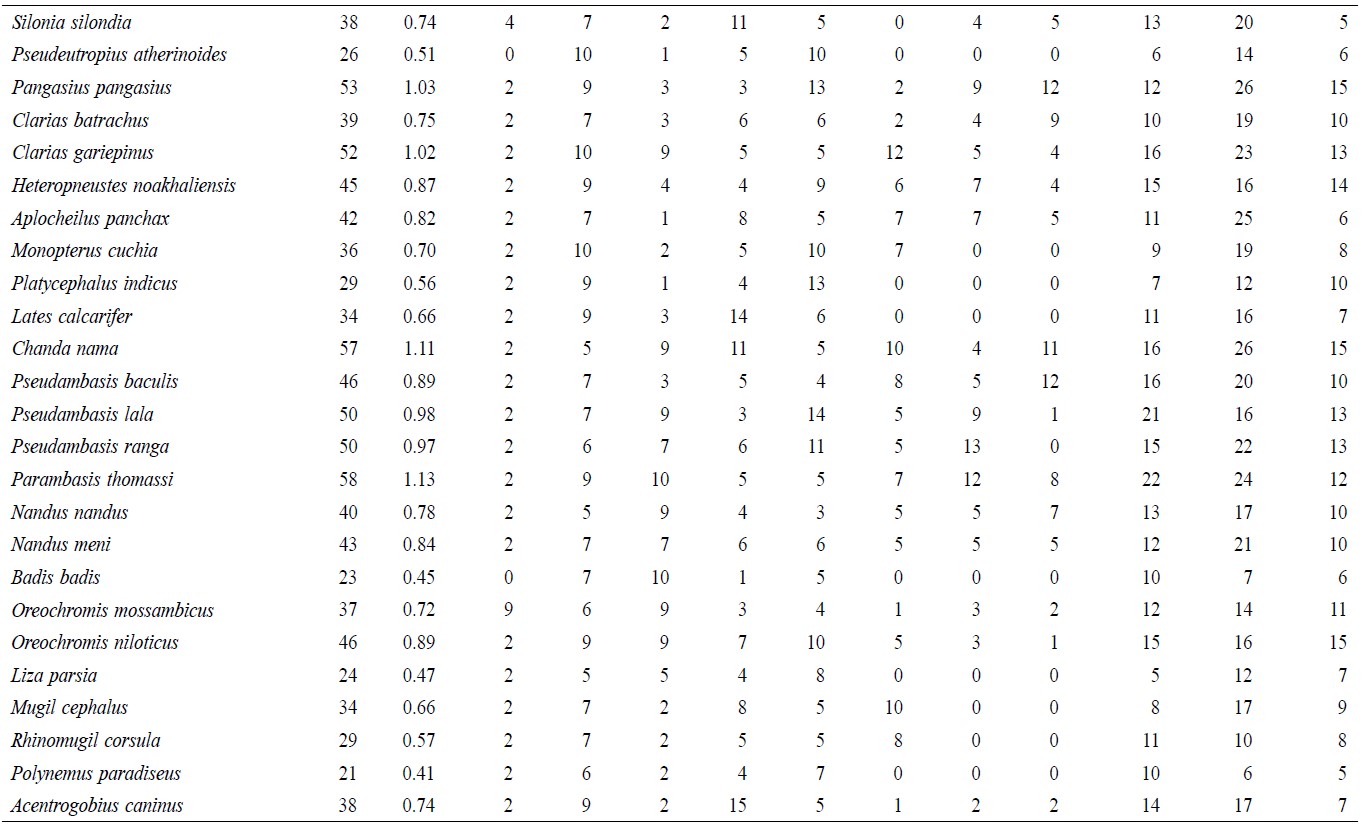
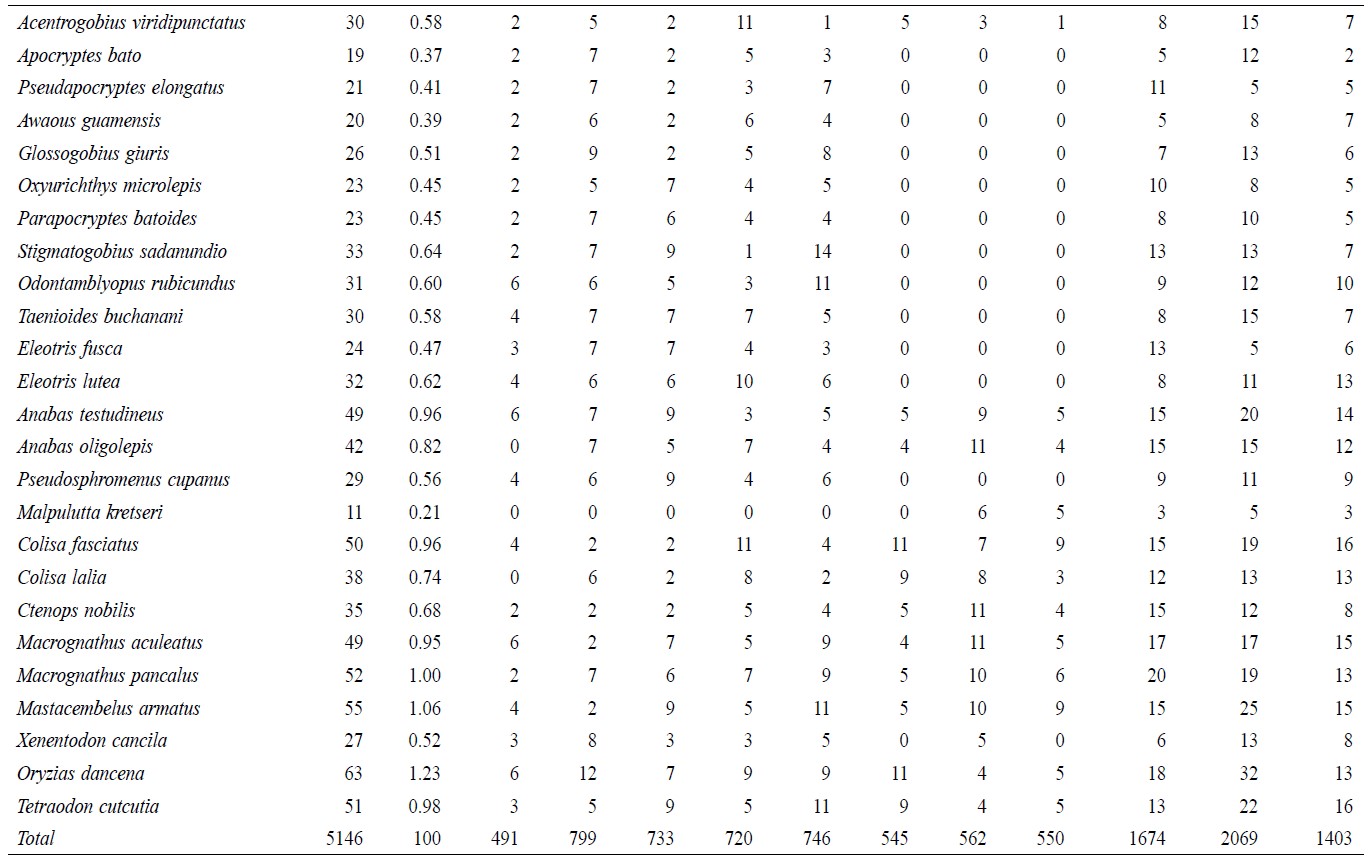
A total of 5,146 individual specimens were enumerated, comprising 128 species of finfish (Table 1). Oreichthys cosuatis represented the most individuals counted (82, or 1.6% of total individuals) and Puntius mahmoodi the least (9, or 0.17%). St 2 had the most individuals (799, 15.5%) counted throughout the study period and St 1 the least (491, 9.5%). Seasonal variation in abundance was significant in all sampling zones. The monsoon season recorded the highest number of individuals (2,069, 40.2%) and post-monsoon the least (1,403, 27.3%).
Table 1. Temporal and spatial fish species abundance and distribution in Noakhali, Bangladesh.
Diversity status
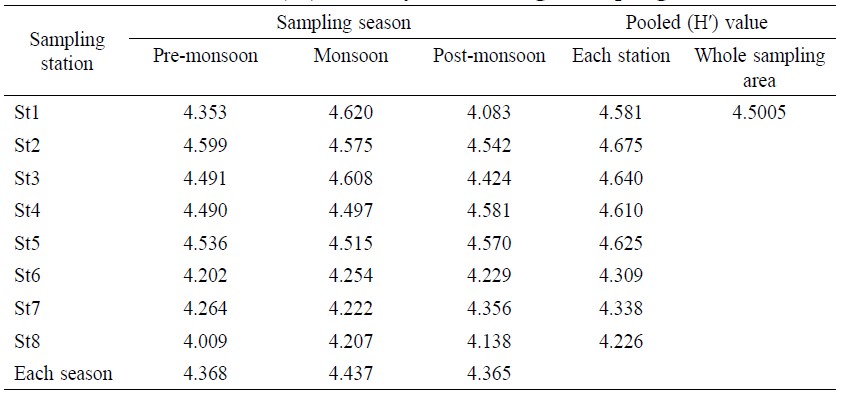
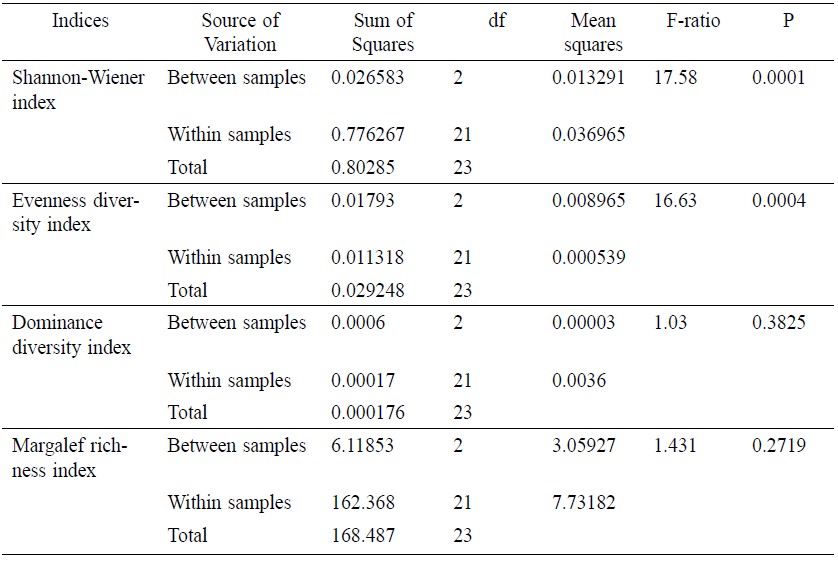
After polling whole samples (48), total H′ value was 4.5005 (Table 2). The maximum H′ value by station was 4.675 at St 2 and the minimum was 4.226 at St 8. In terms of temporal distribution, the maximum H′ value by season was 4.62 during monsoon at St 1 and the minimum was 4.009 during pre-monsoon at St 8. The average H′ value was 4.368 for pre-monsoon, 4.437 for monsoon and 4.365 for post-monsoon. Significant difference (Table 6) was observed between samples and within samples (F=17.58 and P=0.001).
Table 2. Shannon-Weiner (H′) diversity value in eight sampling stations.
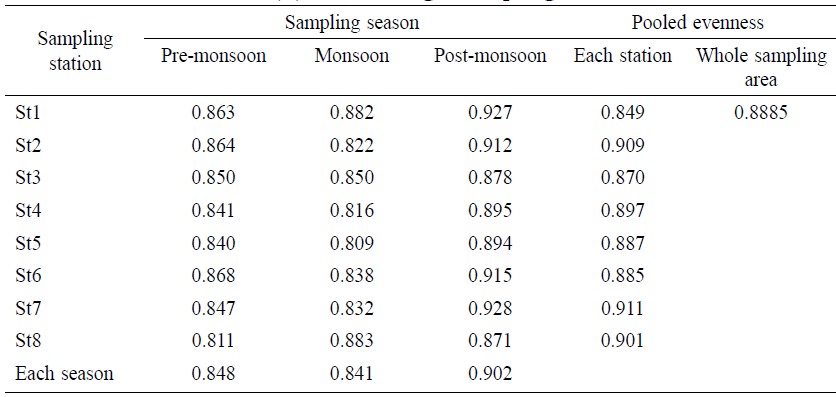
Total evenness value for the whole sampling area was 0.888 (Table 3). The maximum evenness value by station was 0.911 at St 7 and the minimum was 0.849 at St 1. In terms of temporal distribution, the maximum evenness value was 0.928 during post monsoon at St 7 and the minimum was 0.811 during pre monsoon at St 8. The average evenness value was 0.848 for pre-monsoon, 0.841 for monsoon and 0.902 for post-monsoon. Similar to H′ value, significant difference was also observed (Table 6) between and within the samples for evenness value (F=16.63 and P=0.0004).
Table 3. Evenness index (E) value in eight sampling stations.
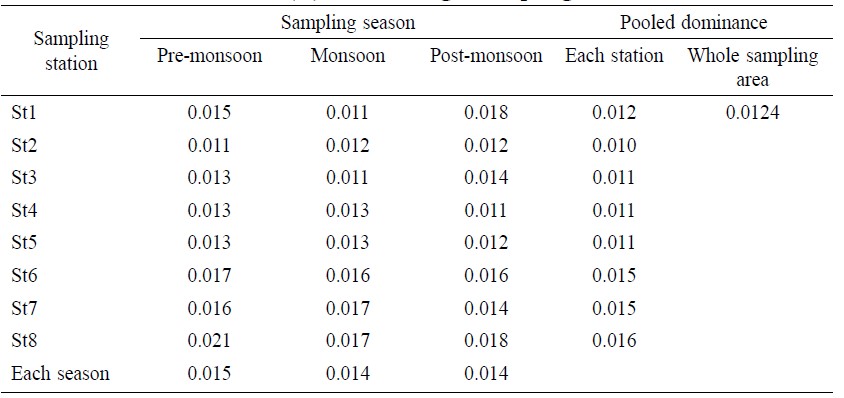
Total dominance index value for the whole sampling area was 0.0124 (Table 4). The maximum dominance index value by station was 0.016 at St 8 and the minimum was 0.010 at St 2. In terms of temporal distribution, the maximum dominance index value was 0.018 during post-monsoon at St 1 and the minimum was 0.011 during monsoon at St 1. The average dominance index value was 0.015 for pre-monsoon, 0.014 for monsoon and 0.014 for post-monsoon. No significant difference (Table 6) was found between and within samples for dominance index value (F=1.03 and P=0.3825).
Table 4. Dominance index (D) value in eight sampling stations.
Total Margalef richness value for the whole sampling area was 15.763 (Table 5). The maximum Margalef richness value by station was 18.40 at St 1 and the minimum was 11.96 at St 8. In terms of temporal distribution, the maximum Margalef richness value was 20.96 during monsoon at St 1 and the minimum was 13.09 during pre-monsoon at St 8. The average Margalef richness value was 17.464 for pre-monsoon, 18.139 for monsoon and 16.904 for post- monsoon. No significant difference (Table 6) was found between and within samples for Margalef richness value (F=1.431 and P=0.2719).
Table 5. Margalef richness (d) value in eight sampling stations.
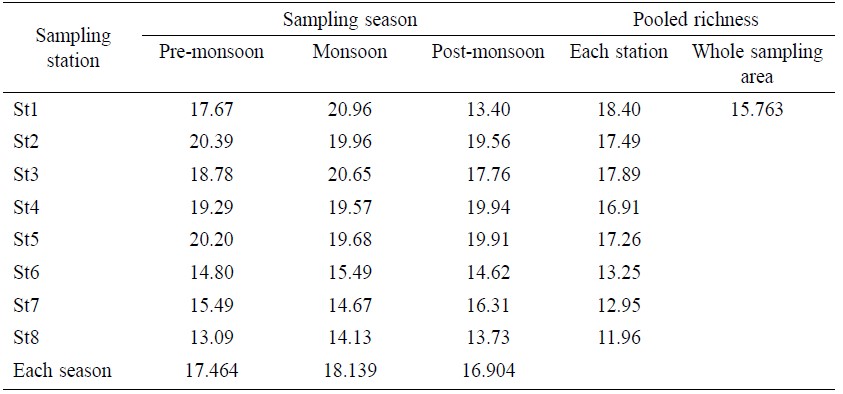
Table 6. Factorial analysis of variance for fisheries diversity indices.
Spatial and temporal relation of fisheries bio-diversity
According to SIMPER (Table 7), 60.9% similarity was found among the seasons and the major contributing species were Oreochromis mossambicus (2.5%), Mastacembelus armatus (2.5%), Tenualosa toil (2.5%), Oryzias dancena (2.0%), Chanda nama (2.0%) and Ctenopharyngodon idella (2.0%). Among the stations, 56.01% similarity was observed and the major contributing species were Tenualosa ilisha (1.4%), Somileptes gongota (1.2%), Mystus vittatus (1.2%), Puntius phutunio (1.2%), Pangasius pangasius (1.2%) and Gudusia chapra (1.2%). At the similarity level, 45% separation, either for month or station, was identified by cluster analysis (Figure 2).
The cluster analysis represents two groups of fish that divided the fish community structure into two major groups between 0.48 and 0.54 similarity levels. The first cluster consists of: St 1 with monsoon; St 2 with pre-monsoon, monsoon and post-monsoon; St 3 with pre- monsoon, monsoon and post-monsoon; St 4 with pre-monsoon, monsoon and post-monsoon; St 5 with pre-monsoon, monsoon and post-monsoon; St 6 with pre-monsoon, monsoon and post-monsoon; St 7 with pre-monsoon, monsoon and post-monsoon; and St 8 with pre-monsoon, monsoon and post-monsoon seasons. The second cluster consists of St 1 with pre-monsoon and post-monsoon seasons.
Table 7. Average similarity and discriminating fish species in all stations and seasons.
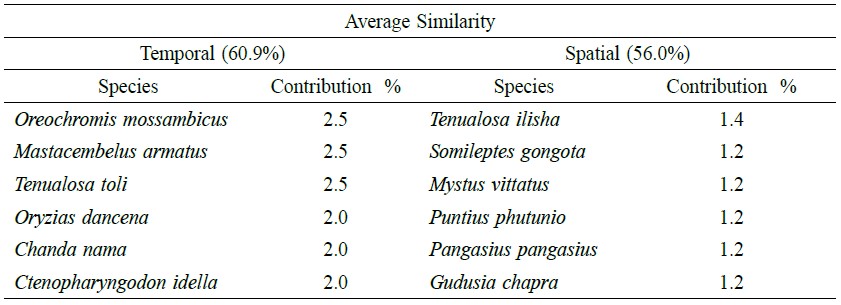
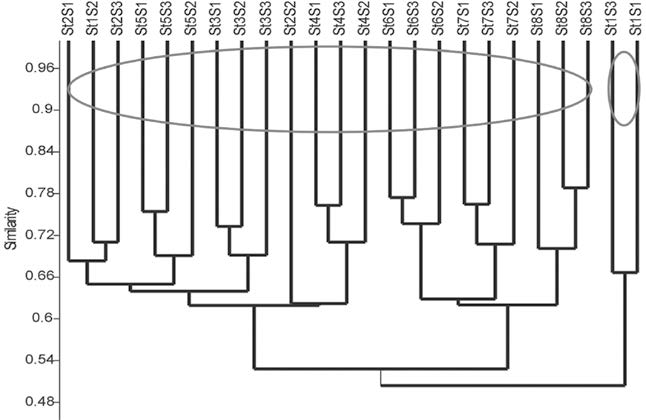
Figure 2. Spatial and temporal cluster of fish assemblage based on Bray-Curtis similarity matrix.
Discussion
This study recorded 128 species of freshwater fishes from the greater Noakhali District. The following species contributed more than 1% of the total composition: Tenualosa ilisha, Channa marulius, Channa punctatus, Cirrhinus cirrhosus, Ctenopharyngodon idella, Cyprinus carpio, Labeo rohita, Oreichthys cosuatis, Puntius chola, Puntius guganio, Puntius sarana, Puntius matini, Acanthocobitis botia, Lepidocephalichthys annandalei, Somileptes gongota, Pygocentrus nattereri, Batasio batasio, Batasio tengana, Mystus bleekeri, Mystus cavasius, Mystus gulio, Mystus vittatus, Sperata oblongata, Pangasius pangasius, Clarias gariepinus, Chanda nama, Parambasis thomassi, Macrognathus pancalus, Mastacembelus armatus and Oryzias dancena.
Rahman (2005) identified 265 freshwater fish species in Bangladesh. From our survey, Noakhali represents 48% of the country’s total fish species (Table 8). Mymensingh and Rajshai, regions with similar environmental characteristics as Noakhali, also have a similar number of species, 139 and 133, respectively, and
share considerable species overlap with Noakhali.
Table 8. Studies on freshwater fish species of Bangladesh in the past 50 years.

Variation in species composition was observed at different locations in the Noakhali study area due to the different environmental characteristics of the aquatic ecosystem. The number of order, families and species of fish represented in greater Noakhali is a rich and diverse resource, providing a significant contribution to both the national economy and protein demand for Bangladesh.
However, human interaction is continuously reducing the water body of the area. This, coupled with increased fishing pressure, is reducing fisheries diversity in greater Noakhali. St 2 has the highest number of individuals (803). This is an area that is subject to relatively low human interference and thus is under-fished and retains an optimum environmental condition. In contrast, St 1, which is subject to extreme human interference, had the lowest number of individuals (491).
Major dominant species were observed in the present study area, similar to several studies that reported the dominance of the resident species (Doha, 1973; Bhuiyan et al., 1992; Rahman, 2005 and Chandra, 2009).
A biodiversity index seeks to characterize the diversity of a sample or community by a single number (Magurran, 1988). The concept of “species diversity” involves two components: the number of species or richness and the distribution of individuals among species. However, the formal treatment of the concept and its measurement is complex (Williamson, 1973). The Shannon-Wiener diversity index considers the richness and proportion of each species, while the evenness and dominance indices represent the relative number of individuals in the sample and the fraction of common species, respectively. The biodiversity index values (H') obtained from the present study are not high according to the Shannon-Weaver biodiversity index values and they do not show differences among the stations, either. According to Keskin and Ünsal (1998), lower species biodiversity can reflect the high selectivity effect of fishing gear. This study ignored the fishing gear effect. The maximum Shannon diversity index was during the monsoon at St 1 and the minimum during the pre-monsoon at St 8. In each case, the high Shannon diversity index value indicates low individuals and low diversity involved with a high number of individuals. The main causes of the differences occurring in the biodiversity indexes are seasonal variations in nutrients of the sea grass beds, affecting the coexistence of many fish species (Huh and Kitting, 1985); atmospheric air currents and environmental conditions (Keskin and Unsal, 1998); and seasonal fish migrations (Ryer and Orth, 1987). The maximum evenness value was at St 7 and the minimum at St 1. In terms of temporal distribution, maximum evenness value was during the post-monsoon at St 7 and the minimum during pre-monsoon at St 8. A number of fish species reproduce in the monsoon water bodies of Bangladesh, which may be the reason why the number of individuals increased during and after the monsoon period, as new individuals joined the fish stocks. In addition to this, ecological conditions also have an effect on the distribution of the fish species. The maximum dominance index value was at St 8 and the minimum at St 2. In terms of temporal distribution, the maximum dominance index value was during the post-monsoon and the minimum during the monsoon. If we compare the temporal variation of dominance status among the all sampling zones and months, it did not fluctuate much. The maximum Margalef richness value was at St 1 and the minimum at St 8. In terms of temporal distribution, maximum Margalef richness value was during the monsoon and the minimum during the pre-monsoon.
In terms of the spatial and temporal assemblage structure of fish, this study found two major groups using cluster analysis. Group 1 and 2 showed 45% similarity with each other. This study also found virtually the same similarity of the fish assemblage among the stations and months. The major contributing species for both stations and months are also similar, although their percentage contribution differs from each other. The fluctuating hydrological and meteorological parameters of seasonality are the primary factor affecting this similarity and dissimilarity (Whitfield, 1989; Loneragan & Potter, 1990; Young & Potter, 2003). Seasonality also affects the spawning activity of fish, which ultimately influences the catch composition (McErlean et al., 1973).
References
Bhuiyan, A.L. 1964. Fishes of Dacca. Asiatic Society of Pakistan, Dacca. 148 pp.
Bhuiyan, A.S., M.N. Islam, and M.T. Hossain. 1992. A checklist of the fishes of Rajshahi. Rajshahi Univ. Studies, Part-B (20): 287-306
Chandra, K. J. 2009. Availability of fish fauna in some selected districts in Bangladesh. Bang. J. Anim. Sci., 38(1&2): 151-163
Chowdhury, M.S.N., M.S. Hossain, S.R. Chowdhury, and N.G. Das. 2010. Fisheries Species Composition and Water Quality of the Naaf River Estuary. Bangladesh Journal of Marine Sciences and Fisheries, 1 (1): 1-20.
Clarke K.R. 1993. Non-parametric multivariate analyses of changes in community structure. Australian Journal of Ecology 18:11743.
Clarke K.R., and R.M. Warwick. 1994. Change in Marine Communities. An Approach to Statistical Analysis and Interpretation. Plymouth: Natural Environment Research Council. 144 pages.
Das, N.G., and M.S. Hossain. 2005. Livelihood and resource assessment for aquaculture development in waterlogged paddy lands: Remote sensing, GIS and participatory approach. DOF/GNAEP/Chittagong University, Bangladesh, 122p.
DeBruin, G.H.P., B.C. Russell, and A. Bogusch. 1995. FAO Species Identification Field Guide for Fishery Purposes. The Marine Fishery Resources of Sri Lanka. Rome: Food and Agricultural Organisation. 400 pages.
Doha, S. 1973. Fishes of the districts of Mymensingh and Tangail. Bangladesh J. Zool. 1: 1-10.
DoF, 2005. Fish Fortnight Souvenir 2005. Department of Fisheries (DoF), Ministry of Fisheries and Livestock, Dhaka, Bangladesh. 152 p.
Fischer, W., and P.J.P. Whitehead. 1974. FAO Species Identification Sheets for Fishery Purposes. Eastern Indian Ocean (fishing area 57) and Western Central Pacific (fishing area 71). Vols. 14. Rome: FAO.
Hamilton, F. 1822. An Account of the Fishes Found in the River Ganges and its Branches. Archibald Constable and Company, Edinburgh. 405. pp.
Harper, D.A.T. (ed.). 1999. Numerical Palaeobiology. John Wiley & Sons.
Hossain, M.S., N.G. Das, and M.S.N. Chowdhury. 2007. Fisheries Management of the Naaf River. Coastal and Ocean Research Group of Bangladesh, 257pp.
Hossain, M.S. 2009. Floodplain aquaculture in Begumgonj: New horizon for rural livelihoods in Bangladesh, Aquaculture Asia XIV (3): 7-10
Hossain, M.S., and N.G. Das. 2010. GIS-based multi-criteria evaluation to land suitability modelling for giant prawn (Macrobrachium rosenbergii) farming in Companigonj Upazila of Noakhali, Bangladesh. Computers and Electronics in Agriculture, 70 (1): 172-186. 10.1016/j.compag.2009.10.003
Hossain, M.S. 2011. Fisheries for society: Way to poverty alleviation and nutritional security at Noakhali coast, Fisheries and Aquaculture News, 1: 25-28.
Huh, S.H., and C.L. Kitting. 1985. Trophic relationships among concentrated populations of small fishes in seagrass meadows. J. Exp. Mar. Biol. Ecol. 92: 29-43.
Hussain, M.G., and M.A. Mazid. 2001. Genetic inprovement and conservation of carp species in Bangladesh. Bangladesh Fisheries Research Institute and International Center for Living Aquatic Resources Management.
Hussain, M.G. 2010. Freshwater fishes of Bangladesh: Fisheries, biodiversity and habitat, Aquatic Ecosystem Health & Management, 13(1): 85-93. 10.1080/14634980903578233
Keskin, Ç., and N. Ünsal. 1998. The Fish Fauna of Gökçeada Island, NE Aegean Sea, Turkey. Ital. J. Zoo., 65: 299-302.
Loneragan, N.R, and I.C. Potter. 1990. Factors influencing community structure and distribution of different life-cycle categories of fishes in shallow waters of a large Australian estuary. Marine Biology 16:25-37. 10.1007/BF2114671
McErlean, A.J., S.G. O’Connor, J.A. Mihursky, and C.I. Gibson. 1973. Abundance, diversity and seasonal patterns of estuarine fish populations. Estuarine, Coastal and Marine Science 1:1936.
Magurran, A.E. 1988. Ecological diversity and its measurement. Princeton University Press, Princeton.
Margalef, R. 1968. Perspectives in Ecological Theory. Chicago, IL: University of Chicago Press. 111 pages.
Rahman, A.K.A. 1989. Freshwater Fishes of Bangladesh. 1st ed. Zoological Society of Bangladesh, Dhaka. 364 pp.
Rahman, A.K.A. 2005. Freshwater Fishes of Bangladesh. 2nd ed. Zoological Society of Bangladesh, Dhaka. 394 pp.
Ramos, S., R.K. Cowen, P. Re, A.A. Bordalo. 2006. Temporal and spatial distribution of larval fish assemblages in the Lima estuary (Portugal). Estuarine, Coastal and Shelf Science, 66: 303-314. 10.1016/j.ecss.2005.09.012
Ryer, C.H., and R.J. Orth. 1987. Feeding Ecology of the Northern Pipefish, Syngnathus fuscus, in a Seagrass Community of the Lower Chesapeake Bay. Estuaries, 10(4): 330-336. 10.1007/BF02689864
Shafi, M., and M.M.A. Quddus. 1982. Fisheries resources of Bay of Bengal (Bonggoposagarer Matshaya Sampad, In Bengali). Bangla Academy, Dhaka.
Shannon, C.E. 1949. Communication in the presence of noise. Proceedings of the Institute of Radio Engineers 37:1021. 10.1109/PROC.1984.12998
Shannon, C.E., and W. Weaver. 1963. The Mathematical Theory of Communications. Urbana, IL: University of Illinois Press. 125 pages.
Siddiqui, K.U., M.A. Islam, S.M.H. Kabir, M. Ahmad, A.T.A. Ahmed, A.K.A. Rahman, E.U. Haque, Z.U. Ahmed, Z.N.T. Begum, M.A. Hasan, M. Khondker, and M.M. Rahman, (eds.). 2007. Encyclopedia of Flora and Fauna of Bangladesh. Vol. 23. Freshwater Fishes. Asiatic Society of Bangladesh, Dhaka 300 pp.
Spjotvoll, E., and M.R. Stoline. 1973. An extension of the T-method of multiple comparisons to include the cases with unequal sample sizes. Journal of the American Statistical Association 68:97678.
Talwar, P.K., and A.G. Jhingran. 1991. Inland fishes of India and adjacent countries. Vol.1&2, Oxford & IBH Publishing Company Pvt. Ltd, New Delhi, pp.1-1158.
Whitfield, A.K. 1989. Ichthyoplankton in a Douthern African surf zone: Nursery area for the postlarvae of estuarine associated fish species? Estuarine, Coastal and Shelf Science 29:533-547.
Williamson, M. 1973. Species diversity in ecological communities. In: Bartlett MS, Horns RW (eds), The mathematical theory of the dynamics of biological populations. Academic, London, pp 325-336.
Young, G.C., and I.C. Potter. 2003. Do the characteristics of the ichthyoplankton in an artificial and a natural entrance channel of a large estuary differ? Estuarine, Coastal and Shelf Science, 56:765-779. 10.1016/S0272-7714(02)00300-1
M. Shahadat Hossain1*, Subrata Sarker1, M. Ziaur Rahaman1 and M. Mizanur Rahman2
1 Institute of Marine Sciences and Fisheries, University of Chittagong, Chittagong -4331, Bangladesh
2 IUCN (International Union for Conservation of Nature), Bangladesh Country Office, Dhaka-1213, Bangladesh
*Corresponding author. E-mail: hossainms@yahoo.com
Total Article Views

