 ISSN: 2822-0838 Online

Quality Control of Mango Fruit during Postharvest by Near Infrared Spectroscopy
Parichat Theanjumpol*, Guy Self, Ronnarit Rittiron, Tanachai Pankasemsuk and Vicha SardsudPublished Date : 2019-08-25
DOI : 10.12982/CMUJNS.2014.0028
Journal Issues : Number 2,May-August-2014
ABSTRACT
Near infrared spectroscopy (NIRS) is a prominent technique for non-destructive fruit quality assessment. This research applied NIRS to control mango quality during postharvest management, harvesting, cold storage and shelf storage. Mango fruits cv. Nam Dok Mai Si Thong were harvested in three stages of fruit maturity; 100, 110 and 120 days after fruit set (DAFS). Mangoes were then divided into three groups. The first group was used to measure the quality at harvest. Mango fruits were measured using short wavelength spectra (700-1100 nm) by NIRsystem 6500 with a fiber optic probe. Physical (color and firmness) and chemical properties (total soluble solids (TSS), tiratable acidity (TA) and dry matter (DM)) were analyzed by conventional methods. The partial least square regression (PLSR) was used to develop the calibration model using The Unscrambler® version 9.8 (CAMO, Oslo, Norway). The means of the data were compared using the least significant difference (LSD). The second group was used to measure quality after cold storage, and was comprised of mango fruits at two harvesting stages (100 and 110 DAFS). Fruits from each stage were stored in cold conditions (13°C, 80-90%RH) for 21 days before the spectra were measured using the NIRsystem 6500. The physical and chemical properties were analyzed. PLSR model development and study of variance followed the same procedure as with the first group. For the third group, mango fruits at two harvesting stages, 100 and 110 DAFS, were stored in cold conditions (13°C, 80-90%RH) for 21 days, after which all samples were kept in the same chamber at 22°C for an additional 4 and 7 days. Spectral data measuring, physical and chemical properties, the PLSR model development and analysis of variance followed the same method as in the first and second groups to evaluate quality after cold storage and shelf storage. The color, firmness, TSS, TA, DM and TSS/TA of mango fruit changed, depending on postharvest management. The PLSR models for TSS, TA and DM obtained preferable results in terms of coefficient of determination (R2), standard error of calibration (SEC), standard error of prediction (SEP) and the average of difference between actual value and the NIRS predicted value (bias). The best results were for the PLSR model of DM, which had ratio of standard deviation of reference data in validation set to SEP (RPD) of 3.24. Therefore, NIRS can be applied to control the quality of mango fruit during postharvest management.
Keywords: Mango, Postharvest, Near infrared spectroscopy
INTRODUCTION
Mango is a popular fruit in Asia, Europe and America. Several varieties of mango are available in world markets, including the Kensington, Keitt, Kent, Irwin and Nam Dok Mai. All markets require fruit of high quality, with a long shelf life. Mango fruit quality depends up on many factors, particularly postharvest management (Haidar and Demisse, 1999). These can be divided into three main steps: harvesting, cold storage and shelf storage at the point of sale. Quality changes during postharvest management are the major problems for mango exportation to other continents. Moreover, quality during one stage affects the subsequent stages. Therefore, postharvest management should reduce physical and chemical changes in color, texture, carbohydrates and acidity (Mukherjee, 1997; Nakasone and Paull, 1998; Saranwong et al., 2004 and Tefera et al., 2007). Moreover, the quality has to be evaluated throughout the entire process.
Usually, mango fruit quality is assessed by traditional destructive techniques, which are time-consuming and costly. Therefore, this research focuses on the potential for utilizing new nondestructive techniques. The quality of each fruit should be determined in accordance with consumer needs. Then near infrared spectroscopy (NIRS) was used to assess the postharvest quality of mango fruit. NIRS has been widely used in quality evaluation of many agricultural products such as peaches, apples, melons, citrus and kiwi fruit (Iwamoto et al., 1995). It has the advantages of providing a nondestructive, low-cost, rapid, repeatable and chemical-free analysis. It is very simple to use and can be performed by unskilled personnel (Osborne, 1986 and Osborne et al., 1993).
MATERIALS AND METHODS
Mango fruits cv. Nam Dok Mai Si Thong from orchards in Phrao, Chiang Mai, Thailand were used in this research. This study included three steps of postharvest management: harvesting, cold storage and shelf storage at the point of sale. Mango fruit were harvested in three stages of fruit maturity: 100, 110 and 120 days after fruit set (DAFS). The harvested fruits were divided into three treatment groups.
The first group was used to measure mango quality at the harvesting stage. One hundred mango fruits at each stage were completely protected from wetting with clear plastic sheets before dipping in a low temperature bath (EYELA, Japan) for 20 minutes at 25°C (Figure 1). Then mangoes were measured using the NIRsystem 6500 (Foss NIRsystem, Silver Spring, USA) at a wavelength range of 700-1100 nm using a fiber optic probe (Figure 2). Physical (color and firmness) and chemical properties (total soluble solids (TSS), tiratable acidity (TA) and dry matter (DM)) were then analyzed. Peel and flesh color were measured by colorimeter (ColorQuest XE, Hunterlab, USA). Firmness of mango flesh was measured by a texture analyzer (TAXtplus, Stable Micro systems, UK) with 2 mm diameter. The maximum value was recorded by the probe while passing through the flesh in force unit, Newton (N). TSS was determined by digital refractometer (PAL-1, ANTAGO, Japan) and TA was titrated with standard sodium hydroxide (0.1 N NaOH) to the end point at pH 8.2 using an autotitrator (Titroline easy, Schott, Germany). Then DM was determined by putting the sample into a vacuum oven (VD53, Binder, USA) and calculated by comparing the weight difference before and after drying. Also, the partial least square regression (PLSR) was used to develop the calibration model in conjunction with The Unscrambler® version 9.8 (CAMO, Oslo, Norway) to evaluate mango fruit quality at harvest, the samples were divided into two sets for calibration and validation. The means of data were compared using the least significant difference test (LSD).
The second group included mango fruits from two harvesting stages (100 and 110 DAFS) and was used to study the effects of cold storage on quality. A total of 200 fruits (100 fruit per harvesting stage) were used. Each mango fruit was stored in a cold room (13°C, 80-90%RH) for 21 days. Samples were dipped into the low temperature bath to equalize the temperature of whole fruit at 25°C and then the spectra were measured using the NIRsystem 6500. The physical and chemical properties were analyzed using the same method as the first group. To study the quality change during cold storage, The Unscrambler® version 9.8 was used to develop a PLSR model for evaluating mango fruit quality during cold storage. The means of data were compared using LSD.
The third group was used to assess the effects of the shelf-life period on mango fruit quality. A total of 400 mango fruits at two harvesting stages, 100 and 110 DAFS (200 fruit per stage), were stored in the cold (13°C, 80-90%RH) for 21 days. Then all fruit samples were kept in the same chamber at 22°C for an additional 4 and 7 days to simulate the shelf-life period, followed by dipping in a low-temperature bath. Mango fruit spectral data were measured using the NIRsystem 6500 (wavelength 700-1100 nm) and physical and chemical properties were analyzed. PLSR was also used to develop the calibration models to evaluate quality after cold storage and shelf-life period following the methodology of the first two groups. Data means were also compared by using LSD.
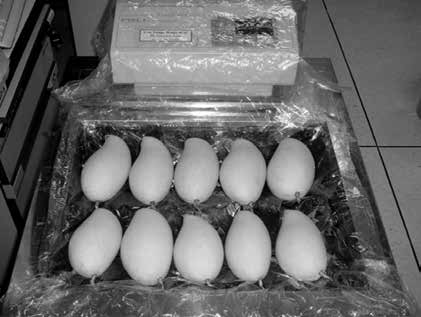
Figure 1. Mango fruit with the temperature controlled at 25°C by dipping in a low-temperature bath.
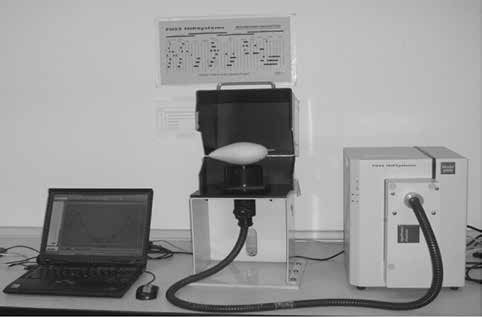
Figure 2. NIRSystem 6500 with a fiber optic probe was used to measure the spectrum of mango fruit.
RESULTS
Mango fruit spectrum
The original spectra of mango fruit showed a clear peak at 980 nm. The absorbance of water molecules in mango fruit decreased when the harvest time increased. For harvest times of DAFS absorbance was 1.21, 1.18 and 1.15, respectively (Figure 3). After the fruit were stored at 13°C for 21 days and kept at 22°C for 4 and 7 days, the absorbance value decreased. They were 1.02, 0.94, 1.06 and 1.08, respectively. To reduce the effect of overlapping peak and baseline shift, the second derivative technique was used to transform the spectral data, lowering the peak of the original spectra at 980 nm to 962 nm (Figure 4).
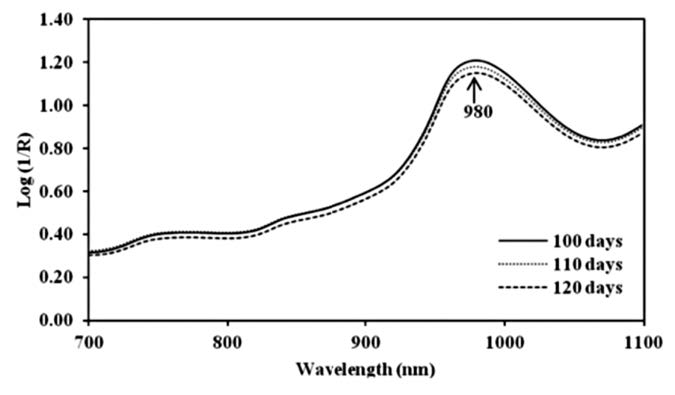
Figure 3. Means original spectra of mango fruit harvested at 100, 110 and 120 DAFS.
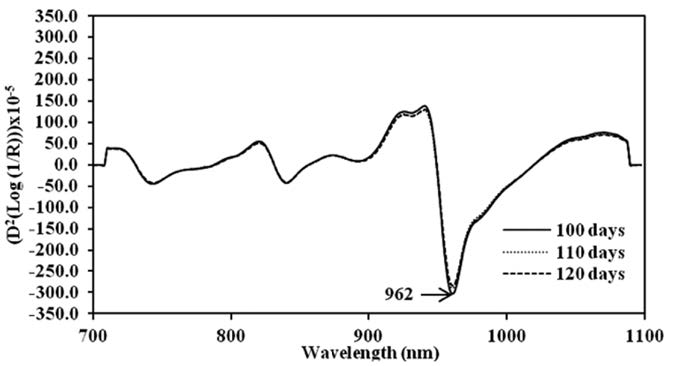
Figure 4. Means second derivative spectra of mango fruit harvested at 100, 110 and 120 DAFS.
Color and firmness of mango fruit
Peel and flesh color of mango fruit at three harvesting times (100, 110 and 120 DAFS) were characterized in terms of L*, C* and h° and were measured with a color meter based on the CIELAB color system, with L* varying from 100 (perfect white) to zero (black). C*(croma) and h°(hue angle) values are calculated based on a* and b* value according to the following equations: C* = [(a*)2+(b*)2]0.5 and h° = tan-1[a*/b*]. C* describes the length of the color vector and h° determines the position of the vector (Jesus Ornelas-Paz et al., 2008). The changes of peel and flesh color of mango fruit during postharvest management (Figure 5 and 6) were significantly different at P<0.05 (Table not shown). L* and h° slightly decreased, while C* slightly increased.
Firmness of mango flesh measured at three harvesting times was 67.41, 66.26 and 48.05 N, respectively. The result showed that firmness rapidly decreased when stored at 13 °C for 21 days and kept at 22°C for an additional 4 and 7 days. There were significant differences at P<0.05 (Figure 7).
Chemical properties of mango fruits were measured at 100, 110 and 120 DAFS. Total soluble solids (TSS) were 14.05%, 13.00% and 18.56%; titratable acidity (TA) were 2.06%, 1.80% and 1.23%; dry matter (DM) were 21.03%, 22.63% and 24.28%; and the ratios of TSS and TA (TSS/TA) were 7.01, 7.63 and 16.49, respectively. They also changed after cold storage and shelf storage. All values were significantly different at P<0.05 (Table not shown). TSS greatly increased during cold storage (80-90%RH) and lowered to 17-18% after shelf storage. Meanwhile, TA decreased after cold and shelf storage. DM slightly changed after cold and shelf storage (Figure 8).
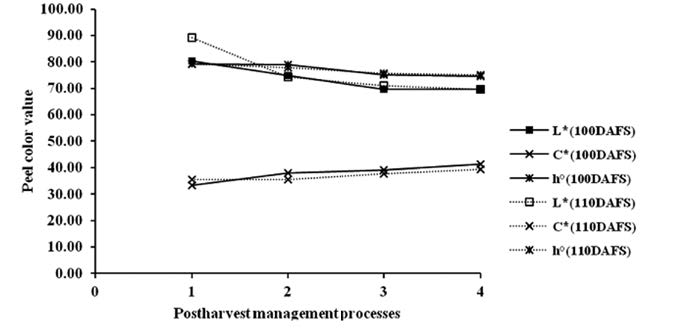
Figure 5. Changes of peel color values (L*, C*, h°) of mango fruit harvested at 100 and 110 DAFS (1), stored at 13°C for 21 days (2) and kept at 22°C for 4 (3) and 7 days (4).
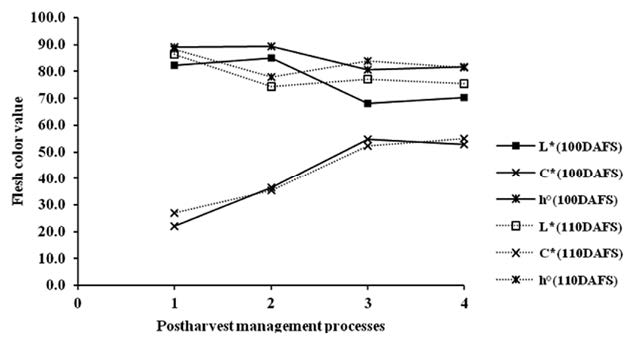
Figure 6. Changes of flesh color values (L*,C*, h°) of mango fruit harvested at 100 and 110 DAFS (1), stored at 13°C for 21 days (2) and kept at 22°C for 4 (3) and 7 days (4).
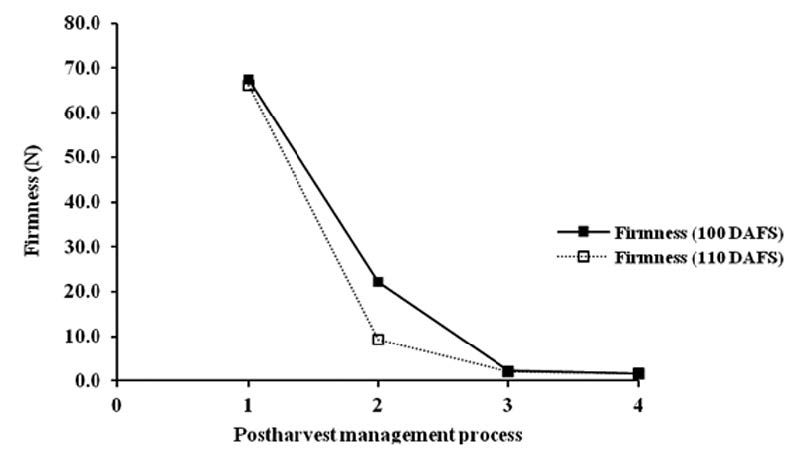
Figure 7. Changes of firmness of mango fruit harvested at 100 and 110 DAFS (1), stored at 13°C for 21 days (2) and kept at 22°C for 4 (3) and 7 days (4).
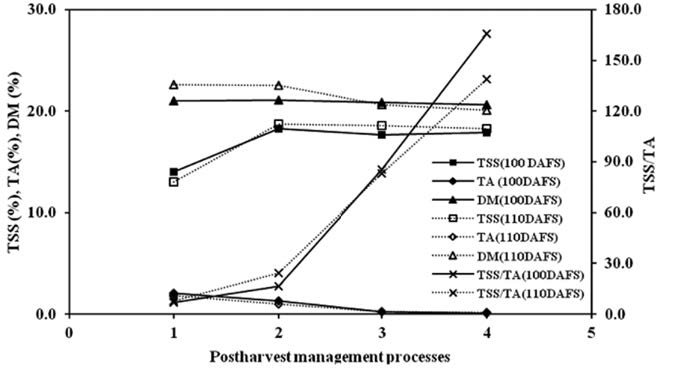
Figure 8. Changes of TSS, TA, DM and TSS/TA of mango fruit harvested at 100 and 110 DAFS (1), stored at 13°C for 21 days (2) and kept at 22°C for 4 (3) and 7 days (4).
Calibration models
The spectral data of mango fruit were treated by various mathematical methods such as Savitzky-Golay smoothing, standard normal variate (SNV), multiplicative scatter correction (MSC) and Savitzky-Golay second derivative before they were used to develop the PLSR calibration models for TSS, TA and DM at each process of postharvest management. The wavelength range was selected using the same wavelength range of PLSR models of puree mixtures of six substances: glucose and sucrose (900-1000 nm), citric acid and malic acid (800-1000 nm), starch (900-1000 nm) and cellulose (800-1000 nm) from previous studies. PLSR model of TSS at harvest was developed using the treated spectral data with Savitzky-Golay second derivative (10 nm average for left and right sides) in the 800-1000 nm wavelength range. The coefficient of determination (R2), standard error of calibration (SEC), standard error of prediction (SEP), the average of the difference between actual value and NIR predicted value (bias) and ratio of standard deviation of reference data in validation set to SEP (RPD) were 0.87, 1.04%, 1.06%, 0.07% and 2.60, respectively. Before the PLSR model for TSS at cold storage was developed, the spectral data were treated by the MSC and Savitzky-Golay second derivative (10 nm average for left and right sides), obtaining an R2 of 0.84, SEC of 0.73%, SEP of 0.79%, bias of 0.12% and an RPD of 2.24. To develop the PLSR model for TSS after shelf storage, the spectra were treated by Savitzky-Golay smoothing and second derivative (20 nm average for left and right sides) of the entire process. R2, SEC, SEP, bias and RPD were 0.84, 0.51%, 0.56%, -0.02% and 2.36, respectively. The best model was developed using the treated spectral data with only the Savitzky-Golay second derivative (10 nm average for left and right sides) of the entire process, obtaining an R2 of 0.87, SEC of 0.92%, SEP of 0.94%, bias of 0.02% and RPD of 2.69 (Table 1).
PLSR models of TA at harvest, cold storage, shelf storage and the entire process were developed following the same step as the model for TSS. The results at harvest were an R2 of 0.77, SEC of 0.22%, SEP of 0.23%, bias of 0.04% and RPD of 1.96. The results at cold storage were 0.74, 0.22%, 0.19%, 0.02% and 1.98, respectively. The results at shelf storage were 0.58, 0.04%, 0.04%, 0% and 1.66, respectively, and for the entire process 0.84, 0.29%, 0.28%, 0% and 2.66, respectively (Table1).
To develop the PLSR model for DM, the spectra of mango fruit at each postharvest process were treated using the same mathematical methods. The result of R2, SEC, SEP, bias and RPD at harvest were 0.83, 0.83%w/w, 0.86%w/w, 0.19%w/w and 2.29. The results at cold storage were 0.85, 0.60%w/w, 0.73%w/w, 0.22%w/w and 3.88, respectively. The results at shelf storage were 0.94, 0.59%w/w, 0.66%w/w, 0.07%w/w and 3.98, respectively, and for the whole process were 0.89, 0.83%w/w, 0.86%w/w, 0.11%w/w and 3.24, respectively (Table 1).
The scatter plot of chemical analysis data of mango fruit, TSS and DM, in both calibration and validation sets, for the entire process showed a high correlation between actual values (conventional analysis method) and predicted values, with the exception of TA (Figures 9, 10 and 11). Meanwhile, the regression coefficient plot exhibited the highest value at various wavelengths, which affected the PLSR model. The results also showed that TSS and DM gave high values at the same wavelengths: 816, 904, 944 and 976 nm, whereas TA had peaks at 778, 888, 956 and 986nm (Figure 12).
Table 1. PLSR calibration results of TSS, TA and DM of mango fruit at harvest, cold storage (13°C, 21 days), shelf storage (22°C, 4 and 7 days) and the entire process.
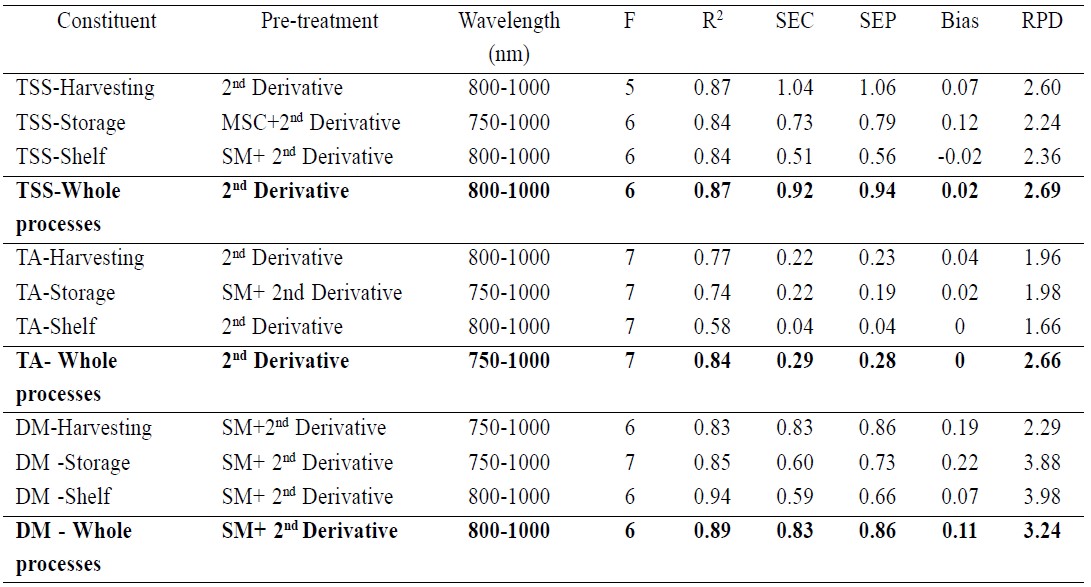
Note: TSS: total soluble solids (%); TA: titratable acidity (%); DM: dry matter (%w/w); SM: smoothing; 2nd Derivative: second derivative; F: number of factors used in the calibration equation; R2: coefficient of determination; SEC: standard error of calibration; SEP: standard error of prediction; Bias: average of the difference between actual value and NIR predicted value; RPD: ratio of standard deviation of reference data in validation set to SEP.
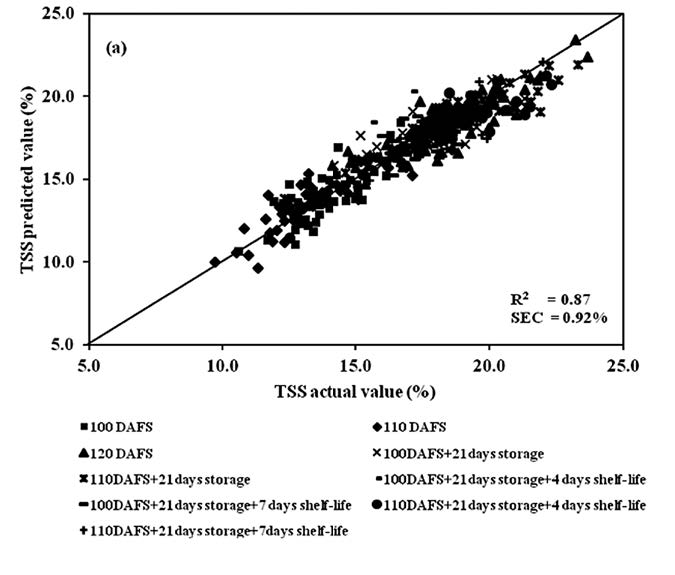
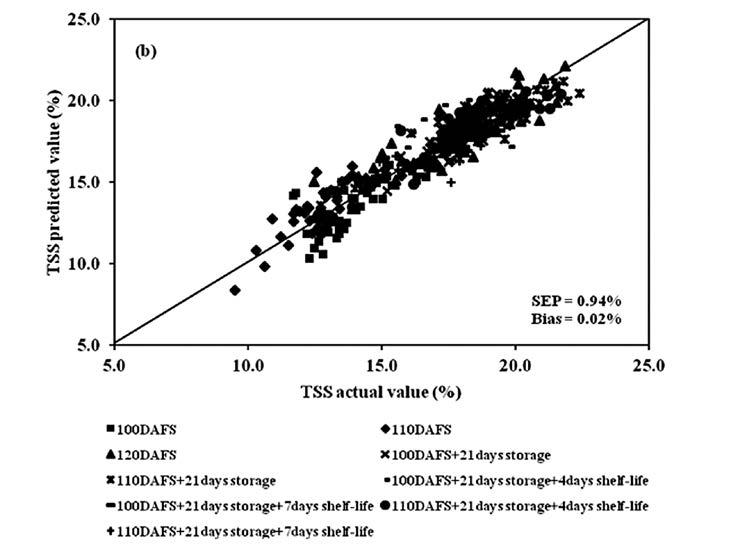
Figure 9. Scatter plot of PLSR calibration results for mango fruit TSS in the whole process of postharvest management (harvesting, cold storage and shelf storage): (a) calibration set and (b) validation set.
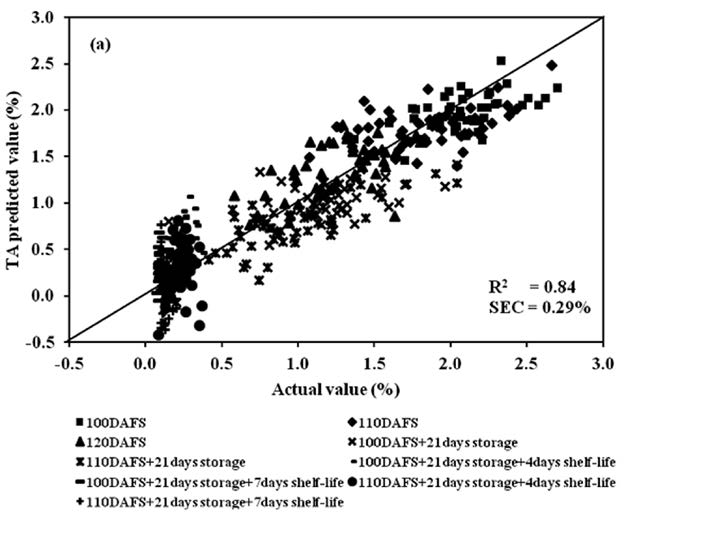
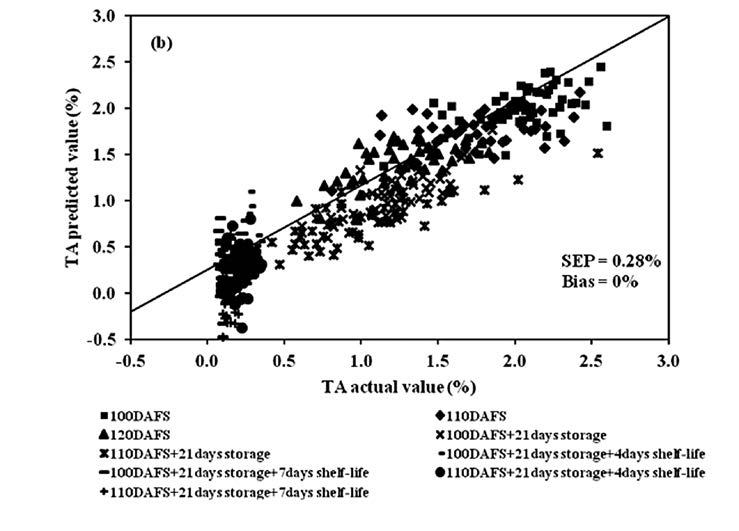
Figure 10. Scatter plot of PLSR calibration results of mango fruit TA for the entire postharvest process (harvest, cold storage and shelf storage): (a) calibration set and (b) validation set.
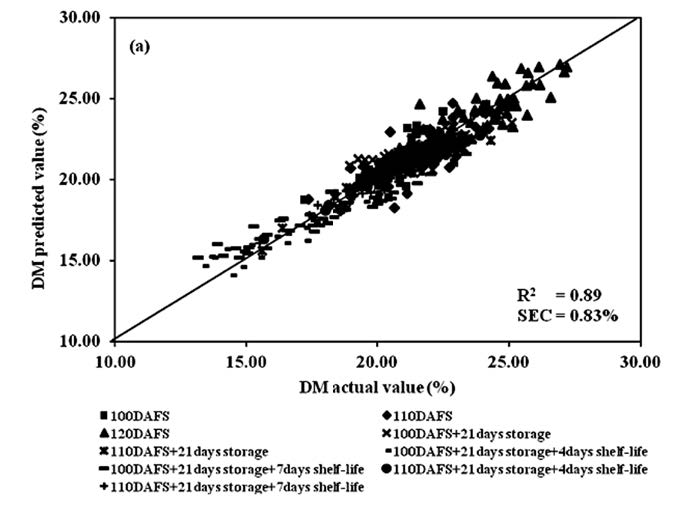
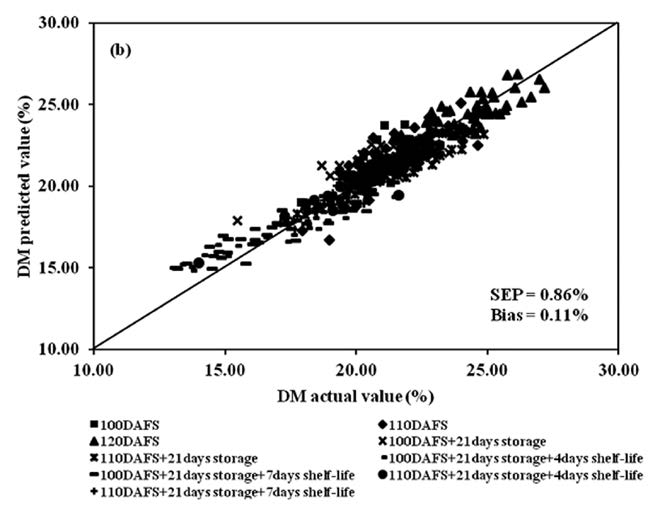
Figure 11. Scatter plot of PLSR calibration results of mango fruit DM for the whole process of postharvest management (harvesting, cold storage and shelf storage): (a) calibration set and (b) validation set.
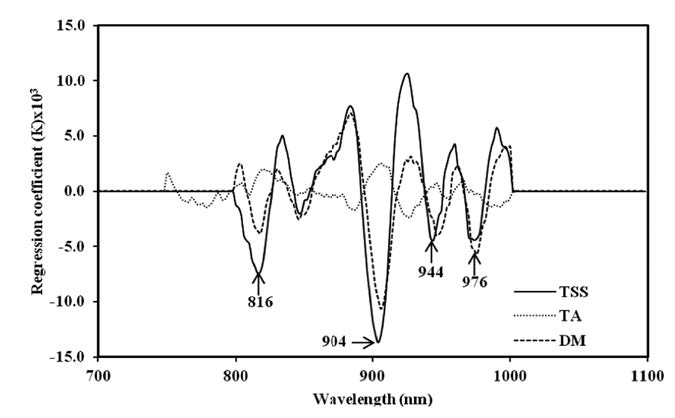
Figure 12. Regression coefficient plot of PLSR calibration models of TSS, TA and DM of mango fruit in the whole process of postharvest management (harvesting, cold storage and shelf storage).
DISCUSSION
Only a clear peak at 980 nm was found on the original spectra of mango fruit from the three harvest times. Mango fruit during cold and shelf storage showed a water absorption band at 978 nm (Saranwong et al., 2003; Theanjumpol et al., 2010). Since it is the main component of mango fruit and the molecule can absorb many wavelength regions in NIRS, such as 770 and 970 nm, this can interfere with the absorption band of other chemical components (Mosenin, 1984). Meanwhile, the absorbance at the water band decreased during the whole process, since weight loss of fruit occured during cold storage. Similar to Tefera et al. (2007), the physiological weight loss of mango fruit occured during storage at a temperature range of 14-19°C and at a relative humidity of 70-82%. After spectral data were adjusted to reduce the effects of baseline shift, overlapping peaks and light scattering (Osborne, 1993 and Williams and Norris, 2001), the peaks shifted slightly, an effect of the pretreatment method. Derivative methods were used to remove or suppress constant background signals and enhance the visual resolution. Each derivative reduces the polynomial order by one, so constant offset is removed. This transformed the linear term into a constant one, thus removing linear tilting of the graph. The second derivative transferred peak maxima into minima and vice versa (Heise and Winzen, 2002).
Color is an important food quality parameter affecting consumer acceptance (Crisosto et al., 2003). When color values were considered, L* and h° values slightly decreased while C* slightly increased to coincide with the increasing of the intensity of the yellow-orange epidermis color and mesocarp (Jesus Ornelas-Paz et al., 2008). This is likely a result of the ripening process. The loss of green color is due to degradation of the chlorophyll structure, which associates with the synthesis of carotenoids, with pigment ranging from yellow to red. It remains a compound and intact in the tissue, even when extensive senescence has occurred. Carotenoids may be synthesized during the development stage of plants, but remain masked by the presence of chlorophyll. Moreover, it can be synthesized during fruit ripening. Following the degradation of chlorophyll, the carotenoid pigments become visible (Wills et al., 1998 and Vazquez-Caicedo et al., 2005). Texture softening occurs during storage and ripening, which directly affects fruit shelf life and quality (Yashoda et al., 2007). Since cell wall hydrolases increase activity during ripening, this results in disassembly, depolymerization and dissolution of pectin and other hemicellulosic polysaccharides (Fry, 1995). Moreover the cell wall degrading enzymes, glycanase and glycosidase, were indentified in ripe mango (Yashoda et al., 2007). In addition, in climacteric fruit the rapid synthesis of polygalacturonase (PG) activity coincides with considerable textural alteration (loss of firmness) and conversion of pectic polysaccharides into water-soluble galacturonides during ripening (Lasan et al., 1986). TSS of mango fruit increased substantially after harvest until storage, and remained constant during the shelf-storage period. This is because mango is a climacteric fruit, which tends to have increased soluble solid concentration until a maximum is reached at the fully-ripe stage, followed by a decreasing trend when the fruit reaches full senescence (Jha et al., 2006 and Tefera et al., 2007). In contrast, TA slightly decreased from harvest to storage for 4 days and then remained almost constant during shelf storage for 7 days. TA decreased dramatically during ripening. This is associated with rapid ripening and senescence of mangoes when stored at higher temperatures. Changes in TA and pH are based on changes in citric, malic and ascorbic acid (Tefera et al., 2007). TSS/TA increased substantially during cold storage and shelf storage for 4 and 7 days because of its relation to TSS and TA. DM of mango fruit were composed of carbohydrates – starch and sugar – that changed slightly during cold and shelf storage. During the ripening process, starch is hydrolyzed to simple sugars (Kumar et al., 1994). Morover, DM relates to shelf life; mango fruit has a high percentage of dry matter and consequently a short shelf life (Hofman et al., 1997). So mango fruit quality components in terms of color, texture, TSS, TA, TSS/TA and DM changed during postharvest management. These occurred after storage at 13°C. This is similar to the findings of Lederman et al. (1997) who found that mango fruit normally ripen when stored at 14°C.
The PLSR provided the results of TSS, TA and DM in terms of R2, SEC, SEP and bias of mango fruit. The results of the entire process were better than each process since it was obtained from a variety of samples (Osborne et al., 1993; William and Norris, 2001 and Siesler et al., 2002). Particularly, RPD values were 2.69, 2.66 and 3.24, respectively. RPD values of TSS and TA PLSR models were in the range of 2.4-3.0, which can be used for rough screening. Meanwhile, the RPD of DM PLSR model was in the range of 3.1-4.9, which can be applied in screening (William and Norris, 2001). This is similar to considerable prior research reporting that NIRS can be used to assess the quality of fruit, such as soluble solids content (SSC) and acidity (pH) of Satsuma mandarin oranges (Gomez et al., 2006), SSC and TA of Valencia Late orange (Cayuela, 2008) and SSC of apple (Fan et al., 2009).
This research reveals that NIRS can be applied to screen the quality of mango fruit during postharvest management stages including harvesting period, cold storage and shelf storage. By using the calibration models, the quality of mango fruit in term of TSS, TA and DM can be predicted. However, the exact quality should be confirmed by consumer preferences. NIRS could be installed in the sorting line system for automatica screening of mango fruit quality.
ACKNOWLEDGEMENTS
This study was supported by the French Agricultural Research Center for International Development (CIRAD), the Postharvest Technology Innovation Center, the Postharvest Technology Research Institute and the Graduate School, Chiang Mai University.
REFERENCES
Cayuela, J.A. 2008. Vis/NIR soluble solids prediction in intact oranges (Citrus sinensis L.) cv. Valencia Late by reflectance. Postharvest Biology and Technology 47: 75-80. 10.1016/j.postharvbio.2007.05.005
Crisosto, C.H., G.M. Crisosto, and P. Metheney. 2003. Consumer acceptance of ‘Brook’ and ‘Bing’ cherries is mainly dependent on fruit SSC and visual skin color. Postharvest Biology and Technology 28: 159-167. 10.1016/S0925-5214(02)00173-4
Fan, G., J. Zha, R. Du, and L. Gao. 2009. Determination of soluble solids and firmness of apples be Vis/NIR transmittance. Journal of Food Engineering 93: 416-420. 10.1016/j.jfoodeng.2009.02.006
Fry, S.C. 1995. Polysaccharide-modifying enzymes in the plant cell wall. Annual Reviews of Plant Physiology and Plant Molecular Biology 46: 497-520.
Haidar, J., and T. Demisse. 1999. Malnutrition and xerophthagma in rural communities of Ethiopia. East Africa Medical Journal 10: 590-593.
Heise, H.M., and R. Winzen. 2002. Chemometrics in Near Infrared Spectroscopy. p.125-162. In H.W. Siesler, Y. Ozaki, S. Kawata, and H.M. Heise. (eds.), Near-Infrared Spectroscopy: Principle, Instrument, Application. WILEY-VCH Verlag GmbH. Germany.
Hofman, P.J., L.G. Smith, D.C. Joyce, G.I. Johnson, and G.F. Meiburg. 1997. Bagging of mango (Mangifera indica cv. Keitt) fruit influences fruit quality and mineral composition. Postharvest Biology and Technology 12: 83-91. 10.1016/S0925-5214(97)00039-2
Iwamoto, M., S. Kawano, and Y. Ozaki. 1995. An overview of research and development of near infrared spectroscopy in Japan. Journal of Near Infrared Spectroscopy 3: 179-189.
Jha, S.N., A.R.P. Kingsly, and S. Chopra. 2006. Physical and mechanical pro-perties of mango during growth and storage for determination of maturity. Journal of Food Engineering 72: 73-76. 10.1016/j.jfoodeng.2004.11.020
Jesus Ornelas-Paz, J.D., E.M. Yahia, and A.A. Gardea. 2008. Changes in external and internal color during postharvest ripening of ‘Manila’ and ‘Ataulfo’ mango fruit and relationship with carotenoid content determined by liquid chromatography –Apcl+-time-of-flight mass spectrometry. Postharvest Biology and Technology 50: 145-152. 10.1016/j.postharvbio.2008.05.001
Kumar, S., D.K Das, A.K. Singh, and U.S. Prasad. 1994. Sucrose metabolism during maturation and ripening of mango cultivars. Plant Physiology and Biochemistry 21: 27-32.
Lazan, H., Z. M. Ali, L.K. Wah, J. Voon, and G.R. Chaplin. 1986. The potential role of polygalacturonase in pectin degradation and softening of mango fruit. ASEAN Food Journal 2: 93-98.
Lederman, I.E., G. Zauberman, A. Weksler, I. Rot, and Y. Fuchs. 1997. Ethylene-forming capacity during cold storage and chilling injury development in ‘Keitt’ mango fruit. Postharvest Biology and Technology 10: 107-112.
Mohsenin, N.N. 1984. Electromagnatic Radiation Properties of Foods and Agricultural Products. Gordon and Breach, Science Publishers, Inc. USA. 673 pp.
Mukherjee, S. K. 1997. Introduction: Botany and Importance. p. 1-19. In R. E. Litz, (ed) The Mango:Botany, Production and Uses. CABI Publishing. UK.
Nakasone, H. Y., and R. E. Paull. 1998. Tropical Fruit. CABI International. UK. 445 pp.
Osborne, B. G. 1986. Near Infrared spectroscopy in Food Analysis. p. 1-14. In R. A. Meyers (ed), Encyclopedia of Analytical Chemistry. John Wiley&Sons Ltd, Chichester.
Osborne, B. G., T. Fearn, and P. H. Hindle. 1993. Practical NIR Spectroscopy with Applications in Food and Beverage Analysis. Longman Group UK Limited1986, UK. p. 227.
Saranwong, S., J. Sornsrivichai, and S. Kawano. 2003. Performance of a portable NIR instrument for brix value determination of intact mango fruit. Postharvest Biology and Technology 11:175-181.
Saranwong, S., J. Sornsrivichai, and S. Kawano. 2004. Prediction of ripe-stage eating quality of mango fruit from its harvest quality measured nondestructively by near infrared spectroscopy. Postharvest Biology and Technology 31: 137-145. 10.1016/j.postharvbio.2003.08.007
Siesler, H.W., Y. Ozaki, S. Kawata, and H.M. Heise. 2002. Near-Infrared Spectroscopy: Principle, Instrument, Application. WILEY-VCH Verlag GmbH, Germany(2002).
Tefera, A., T. Seyoum, and K. Woldetsadik. 2007. Effect of disinfection, packaging and storage environment on the shelf life of mango. Biosystems Engineering 96(2): 201-212. 10.1016/j.biosystemseng.2006.10.006
Theanjumpol, P., V. Sardsud, and G. Self. 2010. Effect of mango fruit sampling position on quality assessment by near infrared spectroscopy. Journal of Agricultural Science 41(1) (Suppl.): 409-412.
Vazquez-Caicedo, A.L. P. Sruanmsiri, R. Carle, and S. Neidhart. 2005. Accumulation of all- tran-β-carotene and its 9-cis and 13 – cis stereoisomer during postharvest ripening of nine Thai mango cultivar. Journal of Agricultural and Food Chemistry 53: 4827-4835. 10.1021/jf048168h
Wills, R., B. McGlasson, D. Graham, and D. Joyce. 1998. Postharvest: An Introduction to the Physiology & Handling of Fruit, Vegetable & Ornamantals. 4th (ed). Hyde Park Press. Australia. 262p.
Williams, P., and K. Norris. 2001. Near-Infrared Technology in the Agricultural and Food Industries. 2nd (ed). American Association of Cereal Chemists, Inc, USA.
Yoshida, H.M., T.N. Prabha, and R.N. Tharanathan. 2007. Mango ripening-Role of carbohydrases in tissue softening. Food Chemistry 102: 691-698.
Parichat Theanjumpol1,2*, Guy Self3, Ronnarit Rittiron4, Tanachai Pankasemsuk5 and Vicha Sardsud6
1 Postharvest Technology Research Institute, Chiang Mai University, Chiang Mai 50200, Thailand
2 Postharvest Technology Innovation Center, Commission on Higher Education, Bangkok 10400, Thailand
3 CIRAD, UMR Qualisud, TA B-95/16 – 73 rue J.-F. Breton, Montpellier, F-34398 Cedex 5, France
4 Department of Food Engineering, Faculty of Engineering at Kamphaengsaen, Kasetsart University, Nakorn Pathom 73140, Thailand
5 Department of Plant Science and Natural Resource, Faculty of Agricultural, Chiang Mai University, Chiang Mai 50200, Thailand
6 School of Agro-Industry, Mae Fah Luang University, Chiang Rai 57100, Thailand
*Corresponding author. E-mail: parichatcmu@gmail.com
Total Article Views