 ISSN: 2822-0838 Online

Population Pharmacokinetics of Phenytoin in Patients with Traumatic Brain Injury
Kansinee Srisaeng* , Juntip Kanjanasilp, Peeraya Sriphong, Chumlong Kittivaravach, Prawatwong WongsrikaewPublished Date : 2019-08-24
DOI : 10.12982/CMUJNS.2015.0084
Journal Issues : Number 3, September - December 2015
ABSTRACT
This study investigated the pharmacokinetic parameters of intravenous phenytoin in patients with early traumatic brain injury. Routine clinical pharmacokinetic data were obtained from 122 patients, aged 12-79 years old, admitted to the neurotrauma ward, at Sunpasitthiprasong Hospital, Thailand. Three plasma samples per patient were collected during Days 3-7 after receiving phenytoin. We investigated the factors influencing the pharmacokinetics of intravenous phenytoin, including demographic, clinical, pathological, and surgical treatment data. The data were analyzed using NONMEM and the final model was validated using a nonparametric bootstrap technique and a visual predictive check (VPC). A one-compartment model with Michaelis-Menten elimination adequately described the data. Actual body weight (ABW) was the only variable that affected the Michaelis-Menten constant (Km). The final model parameters were: Km = 4.34 mg/L*(1-0.026*(ABW-57)), Vmax = 8.76 mg/kg/day and Vd = 0.719 L/kg; the bootstrap and VPC results were satisfactory.
Keywords: Phenytoin, NONMEM, Traumatic brain injury, Population pharmacokinetics, Post-traumatic epilepsy
INTRODUCTION
Post-traumatic seizure causes secondary brain injury, contributing to morbidity and mortality after traumatic brain injury. Post-traumatic epilepsy is defined as a recurrent seizure disorder due to traumatic brain injury (Khan and Benerjee, 2010). It has become an important clinical problem related to head injury in many countries (Beghi, 2003). Post-traumatic epilepsy can be divided into three groups: immediate seizure, occurring within 24 hours of injury; early seizure, occurring within 7 days of injury; and late seizure, occurring more than 7 days after injury (Garga and Lowenstein, 2006; Gupta and Gupta, 2006; Khan and Benerjee, 2010). Immediate and early seizures are believed to have a different pathogenesis from late seizure, and are considered to be direct reactions to brain
damage (Agrawal et al., 2006; Khan and Benerjee, 2010). Patients with early seizure have a higher incidence of intracranial pathology (Khan and Benerjee, 2010). Seizure activity in the early post-traumatic period may cause secondary brain damage, because of increased metabolic demand, raised intracranial pressure, and excess neurotransmitter release (Schierhout and Roberts, 1998). Seizure activity may be undetectable, if the patient is paralyzed and ventilated (Khan and Benerjee, 2010). Evidence suggests that early seizure activity after head injury may increase the risk of post-traumatic epilepsy (Gupta and Gupta, 2006).
Effective prophylaxis of early post-traumatic seizures reduces brain metabolic demands, thereby reducing intracranial pressure and neurotransmitter release (Brain Injury Special Interest Group of the American Academy of Physical Medicine and Rehabilitation, 1998), which in turn minimizes secondary brain injury. Anticonvulsants are recommended for seizure prophylaxis in the early period post-injury in high-risk patients, but are not recommended for preventing late post-traumatic seizure (Schierhout and Roberts, 1998; Chang and Lowenstein, 2003; Bratton et al., 2007; Khan and Benerjee, 2010). Phenytoin is a commonly used and effective anticonvulsant for treatment and prevention of early post-traumatic seizure in patients with severe head injury, within the first 7 days after injury (Boucher and Hanes, 1998; Schierhout and Roberts, 1998; Chang and Lowenstein, 2003; Bratton et al., 2007; Khan and Benerjee, 2010). However, many physiological changes occur in neurotrauma patients in which the pharmacokinetics of the drugs may be altered. The therapeutic range for phenytoin is 10-20 mg/L as the total plasma phenytoin concentration in patients with normal plasma protein binding (Winter, 2008). Many studies reported low serum levels of phenytoin in neurotrauma patients, but little evidence describes the population pharmacokinetics of phenytoin in these patients (Chang and Lowenstein, 2003; Frend and Chetty, 2007).
We studied the population pharmacokinetics of phenytoin in head injury patients within 7 days after trauma. We also modeled the population pharmacokinetics of phenytoin in patients with traumatic brain injury for appropriate dose adjustment.
MATERIALS AND METHODS
Patient and study procedure
The study was conducted at Sunpasitthiprasong Hospital, Ubon Ratchathani, Thailand. All patients ≥ 12 years of age admitted to the neurotrauma ward from April 2012 to January 2013 were assessed for study eligibility. Eligible patients had traumatic brain injury within 7 days after head injury, and received intravenous phenytoin sodium for treatment or prevention of seizure in the early period of traumatic brain injury. Patients with brain injuries from other causes (i.e., stroke, infections, tumors, or hypoxia) were excluded. No cases were pregnant or had a history of phenytoin allergy. The details of study were explained to the patients or guardians and written informed consent was obtained. The Ethics Committees of Mahasarakham University and Sunpasitthiprasong Hospital approved the study. Baseline laboratory tests included serum albumin, blood urea nitrogen, serum creatinine, creatinine clearance, total bilirubin, direct bilirubin, indirect bilirubin, alanine aminotransferase, aspartate aminotransferase, alkaline phosphatase, and prothrombin time.
Drug administration and blood sampling
Each patient received a regimen of phenytoin sodium (Dilantin®) – either 100 mg every 8 hours or 300 mg every 24 hours (with or without a loading dose of 500-1000 mg). Three plasma samples were collected from each patient during Days 3-7 according to a table of random numbers, one sample in the distribution phase, and two samples in the elimination phase. Sampling times for all patients during the distribution phase were at 1, 1.5, 2, and 2.5 hours after dosing. Sampling times in the elimination phase were during hours 3-8 after dosing for the group receiving 100 mg every 8 hours, and hours 3-24 after dosing for the group receiving 300 mg every 24 hours (Figure 1). However, in some instances blood samples could not be collected on the prescribed schedule, so the real time was recorded. Demographic, clinical, and pathological data, as well as information on surgical treatment modality were obtained.
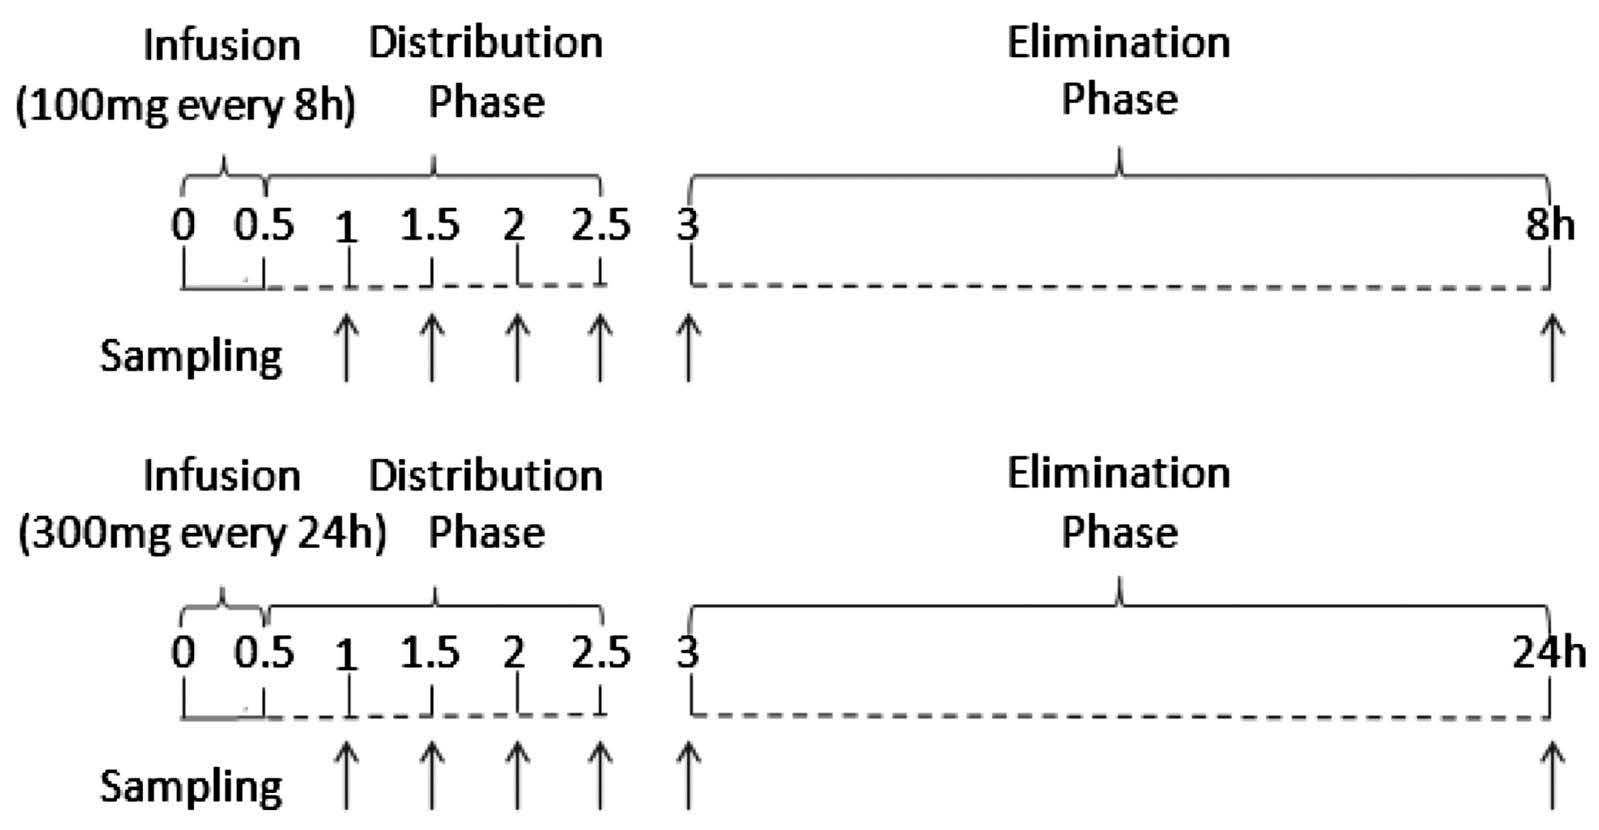
Figure 1. Random sampling during Days 3-7 from patients receiving daily phenytoin at 100 mg every 8 h (above) or 300 mg every 24 h (below), with or without loading dose of 500-1000 mg.
Assay of total plasma phenytoin concentration
Total plasma concentration was analyzed using fluorescence polarization immunoassay, COBAS INERGRA 400 plus (Roche). The linear range was obtained between 0.42 and 40 mg/L. The assay was performed using the standard protocol at Sunpasitthiprasong Hospital.
Population pharmacokinetic modeling
The data were analyzed using the non-linear mixed effect model (NONMEM) software version 7.2 (Bauer, 2011; Boeckmann et al., 2011), with first-order conditional estimation with interaction. Results from NONMEM were analyzed with Xpose, version 4.4.0 (Jonsson and Karlsson, 1999; Keizer et al., 2013), implemented in R program, version 2.15.3 (R Core Team, 2013). Different models, including one- and two-compartment models with first-order and Michaelis-Menten elimination, were tested for the structural model. ADVANS and TRANS subroutines of these models are shown in Table 2.
The inter-individual variability was described using an exponential error model as follows:
PKi = TVPK*exp(ηPKi)
where PKi is the ith individual estimate of the parameter; TVPK is the typical value estimate; and ηPKi is inter-individual random effect with a mean of 0 and variance of ω2. The residual variability was described using a proportional error model as follows:
Cobsij = Cpredij *(1+ εij)
where Cobsij is the jth observed concentration of phenytoin for the ith patient; Cpredij is the jth predicted concentration of phenytoin for the ith patient; and εij is the residual random effect with a mean of 0 and variance of σ2.
We considered 20 covariates that might influence the pharmacokinetics of intravenous phenytoin: gender, age, height, ABW, ideal body weight (IBW), regimen, alcohol consumption, smoking, severity of head injury, depressed skull fracture, brain hemorrhage/hematoma, brain edema, brain contusion, midline shift, trauma organ involvement, brain surgery, fever, albumin level, liver function test (LFT), and loading dose of phenytoin. Since we collected a wide range of demographic, biochemical, and hematological data in the course of the study, potential relationships between the clinical and demographic factors and individual parameter estimates (empirical Bayes estimates; EBEs) were screened using graphical inspection, and by a general additive modeling (GAM) (Mandima et al., 1992) obtained from Xpose, version 4.4.0 (Jonsson and Karlsson, 1999; Keizer et al., 2013), implemented in R program, version 2.15.3 (R Core Team, 2013). The potential covariates that could influence the pharmacokinetics of phenytoin were added individually to the population model. To discriminate between two nested models, we used the difference of objective function value (OFV) (-2 log likelihood). In the stepwise forward selection, the covariate with the greatest reduction in OFV was included first, and then other covariates were added until no significant improvements in model fit were achieved (full model). After that, in the stepwise backward elimination, each covariate in the full model was tested by removing each entry one-by-one to confirm statistical significance. Statistical significance was defined as a reduction in OFV of at least 3.84 (P<0.05) and 6.63 (P<0.01) for the forward selection and backward elimination steps, respectively. In addition to OFV, we considered goodness-of-fit plots, biological plausibility, the precision of the parameter estimates, and the ability of covariates to explain variability.
Model evaluation
Non-parametric bootstrap technique and visual predictive check (VPC) were used to evaluate the final model. For the bootstrapping method, 1,000 datasets were generated by resampling with replacement from the original dataset (Efron, 1979; Efron and Tibshirani, 1993) using Perl-speaks-NONMEM (PsN), version 3.5.9 (Keizer et al., 2013). The final model was fitted to each new dataset, and then the bias, standard errors, and confidence intervals of the parameter estimates were calculated. If the model is robust, the bootstrap estimates should be similar to the parameter estimates from the original dataset, and they should lie within the 95% confidence interval.
The visual predictive check (VPC) (Yano et al., 2001; Bergstrand et al., 2011) was carried out using Perl-speaks-NONMEM (PsN), version 3.5.9 (Keizer et al., 2013), in which 1,000 replicates were simulated by using the original data as a template. VPC graphs were created using Xpose, version 4.4.0. The prediction-corrected VPC was utilized to account for the fact that the patients received different dosing regimens (Bergstrand et al., 2011).
VPC was used to graphically assess whether data in the simulations were similar to observed data, for both measures of central tendency and variability. The median, 10th and 90th percentiles, with a 95% confidence interval of each percentile derived from the simulation, were graphically compared to corresponding percentiles of the observed data. In this study, we used a prediction-corrected VPC (pcVPC), which normalizes both simulated and observed data to the typical population prediction for evaluating models. If evidence of model misspecification existed, discrepancies would be observed.
RESULTS
The population pharmacokinetic analysis was performed for 321 plasma samples collected from 122 head injury patients. Of these, 104 were male and 18 were female; the mean age (±SD) was 35.3±16.7 years (range: 12-79 years). The patient characteristics are presented in Table 1.
Table 1. Characteristics of 122 patients with traumatic brain injury.
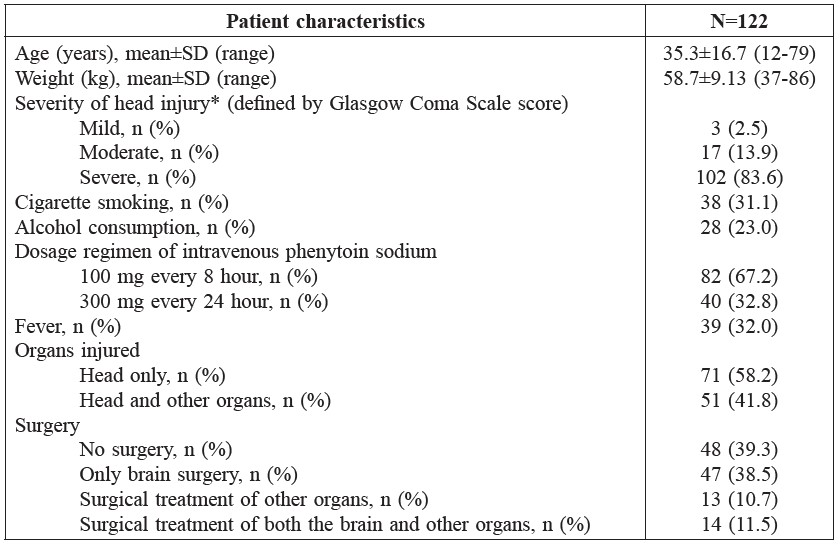
Note: *Severity of head injury – Mild: GCS score=13-15; Moderate: GCS score=9-12; Severe: GCS score=3-8.
Phenytoin levels ranged from 0.9 to 31.6 mg/L, with an average (±SD) of 10.1±6.3 mg/L and a median of 9.2 mg/L. We observed sub-therapeutic, therapeutic, and super-therapeutic phenytoin levels in 174, 127 and 20 samples (54.2%, 39.6%, and 6.2%), respectively. Eighty-five patients (69.6%) had sub-therapeutic phenytoin levels in at least one sample and 11 patients (9.1%) had super-therapeutic phenytoin levels in at least one sample. Only 26 patients (21.3%) had phenytoin levels in the therapeutic range in all samples.
The one-compartment model with Michaelis-Menten effectively described the data by graphical assessment and objective function provided by NONMEM, as the objective function value of this model was less than the others (Table 2). The basic pharmacokinetic parameters were Vmax (the maximum rate of metabolism, mg/kg/day) and Km (the plasma concentration of the rate of metabolism is one-half the maximum, mg/L).
Table 2. Parameters, subroutines and objective function value (OFV) in pharmacokinetic model examination.
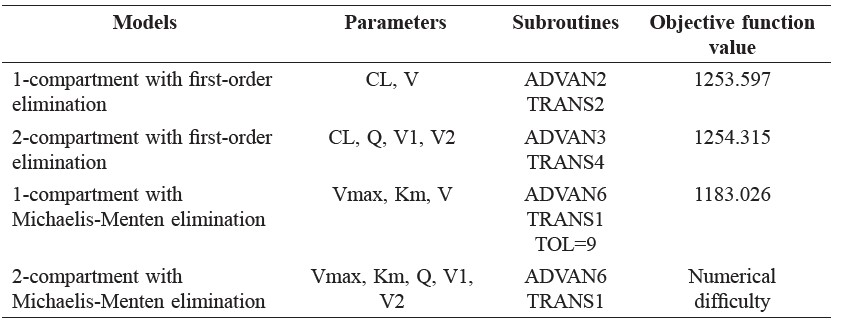
Note: CL = Clearance, V = Volume of distribution, V1 = Central volume, V2 = Peripheral volume, Q = inter-compartmental clearance, Vmax = the maximum rate of metabolism, Km = Michaelis-Menten constant.
In the structural model analysis, inter-individual variability in Vmax (ηVmax) was high (206%), so this parameter was fixed at zero for the appropriate Vmax value.
The pharmacokinetics of phenytoin in patients with early traumatic brain injury were adequately described using a one-compartment model with Michaelis-Menten. Only body weight affected Km. The final model parameters were: Km = 4.34 mg/L*(1-0.026*(ABW-57)), Vmax = 8.76 mg/kg/day and Vd = 0.719 L/kg. The between subject variability (BSV) of Km and Vd was estimated at 73.3% and 38.7%, respectively. The parameter estimates from bootstrapping datasets were similar to those obtained from the original dataset, and they lay within the 95% confidence interval, as presented in Table 3.
Table 3. Parameter estimates and bootstrap estimates from the final model.
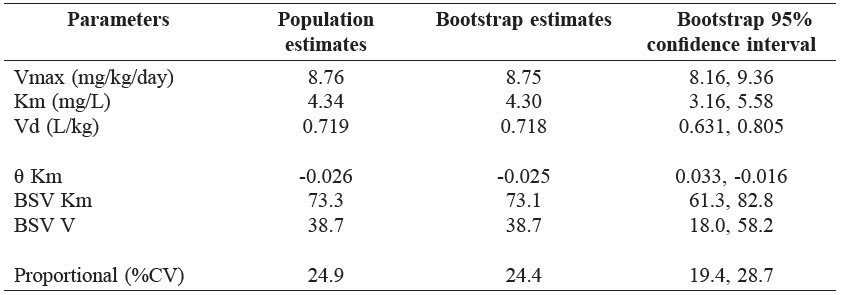
Note: Vmax = the maximum rate of metabolism, Km = Michaelis-Menten constant, Vd = Volume of distribution, θ = Theta for body weight, a predictor of Km, CV = Coefficient variability, BSV = Between Subject Variability.
Figure 2 shows the prediction-corrected visual predictive check (pcVPC), which was stratified by treatment regimen: 100 mg every 8 hour and 300 mg every 24 hour. The pcVPC was satisfactory with the observed data of the two graphs lying within the 95% prediction interval of the predicted model for the 10th, 50th, and 90th percentiles; similar findings were observed for both.
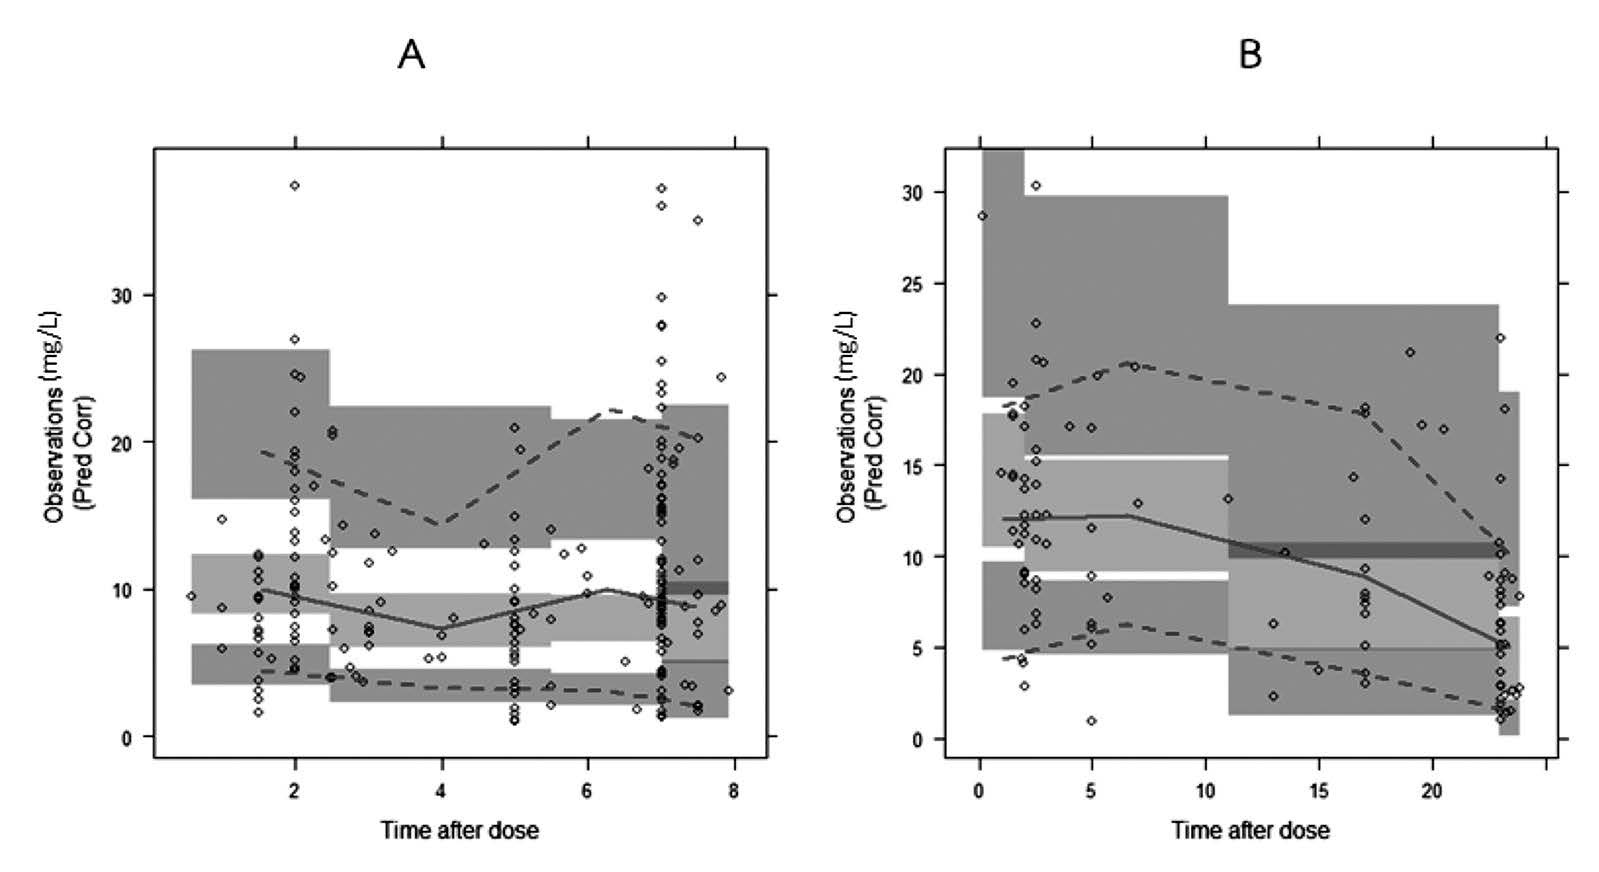
Figure 2. Visual predictive check of the final model stratified for different dosing regimens: phenytoin 100 mg IV every 8 h (A) and 300 mg IV every 24 h (B). The solid lines represent the median observed plasma concentration, and the middle fields represent a 95% confidence interval for the median. The observed 10th and 90th percentiles are presented with dashed lines, and the 95% confidence intervals for the corresponding model predicted percentiles are shown as lower and upper fields, respectively. The observed plasma concentrations (prediction corrected in the pcVPC) are represented by circles.
DISCUSSION
A one-compartment model with Michaelis-Menten, including body weight as a predictor, was appropriate for describing the population pharmacokinetics of phenytoin in patients with traumatic brain injury. When the final model was validated using bootstrapping and a visual predictive check, the results were satisfactory.
In general practice, the parameters used to calculate the estimated phenytoin adult dosage were Km of 4-4.30 mg/L, Vmax of 7 mg/kg/day and Vd of 0.65-0.70 L/kg (Winter, 2004; Winter, 2008; Bauer, 2008). These were average parameters in adults with normal liver and renal function, as well as normal plasma protein binding (Winter, 2004; Winter, 2008; Bauer, 2008).
The volume of distribution (Vd) of phenytoin in the present study was similar to that of the approximate Vd; this was similar to the findings of Boucher et al. (1988), who studied head injury patients within 14 days after trauma. Boucher et al. (1988) reported Vd of 0.70 L/kg. Average and median values of albumin in our study were at the low end of the normal range. In our study, no factor affected Vd, while Frame and Beal (1998) reported that body weight did. The Km observed in our study was similar to that of the approximate Km, although higher than the value (3.4 mg/L) reported in Boucher et al. (1988) using a Michaelis-Menten time-invariant model. In the present study, only ABW affected Km; that is, for every 1 kg ABW different from median weight (57 kg), TVKm changed by 2.6%. Little evidence exists about factors that affect Km in neurotrauma patients. Previous studies in the general epilepsy population have reported that body weight, alcohol consumption, co-anticonvulsants, age, and race affected Km (Grasela et al., 1983; Yukawa et al., 1989; Kanjanasilp et al., 2005).
Vmax in our study was higher than that of the approximate Vmax, and similar to the value (596 mg/day; 8.11 mg/kg/day) reported in Boucher et al. (1988) using a Michaelis-Menten time-invariant model. In neurotrauma patients, metabolism rate of many drugs might increase during the early period after trauma, and decline to normal levels in Days 7-14 (Frend and Chetty, 2007).
When the ηVmax was fixed at zero, we could not examine the influence of factors. In general epilepsy populations, factors reported to affect Vmax include body weight, age, co-anticonvulsants, alcohol consumption, cigarette smoking, fever, and auto-induction process (Grasela et al., 1983; Leppik et al., 1985; Yukawa et al., 1989; Odani et al., 1996; Frame and Beal, 1998; Kanjanasilp et al., 2005).
Since phenytoin is eliminated primarily by hepatic metabolism with approximately 90% by CYP2C9 and 10% by CYP2C19, medications that inhibit or induce these enzymes might be expected to cause drug-drug interactions with phenytoin, and might hence alter phenytoin metabolism (Frend and Chetty, 2007; Winter, 2008). Medications that can also displace phenytoin from protein binding sites or decrease absorption may alter phenytoin concentration too (Frend and Chetty, 2007; Winter, 2008). Drugs that influence phenytoin pharmacokinetics include amiodarone, antacids, carbamazepine, chloramphenicol, cimetidine, ciprofloxacin, disulfiram, fluconazole, fluoxetine, isoniazid, phenobarbital, rifampicin, salicylates, sertraline, sulfonamides, ticlopidine, trimethoprim, valproic acid, and voriconazole (Frend and Chetty, 2007; Winter, 2008).
In the present study, only a small number of co-medications may have potentially interacted with phenytoin – sodium valproate in two patients and phenobarbital in one patient. Therefore, we did not examine the influence of concomitant medications.
Genetic polymorphisms in the drug-metabolizing enzyme CYP2C9 and CYP2C19 have been reported to affect the pharmacokinetic parameters of phenytoin (Odani et al., 1997; Mamiya et al., 1998; Yukawa et al., 2006). As phenytoin is eliminated primarily by hepatic metabolism, mainly 90% by CYP2C9 (Frend and Chetty, 2007; Winter, 2008), patients deficient in CYP2C9 have a limited ability to metabolize phenytoin (Frend and Chetty, 2007; Winter, 2008). Two common variant alleles, CYP2C9*2 and CYP2C9*3, differ from wild-type CYP2C9*1 by a single point mutation (Stubbins et al., 1996). These two mutant alleles are associated with significantly lower metabolic capacity for many CYP2C9 substrates (Takanashi et al., 2000). Higher phenytoin serum concentrations were reported in patients with the CYP2C9*3 genotype (Van der Weida et al., 2001; Soga et al., 2004). The CYP2C9*2 and CYP2C9*3 alleles are expressed at a greater frequency in Caucasians compared to Asians (Kanjanasilp et al., 2005; Kirchheiner et al., 2005; Tassaneeyakul, 2008). The allele frequency of CYP2C9*2 in Thais, Caucasians, Asians, and Africans is 0, 11, 0, and 4%, respectively; the allele frequency of CYP2C9*3 in Thais, Caucasians, Asians, and Africans is 4.6, 7, 3, and 2%, respectively (Kirchheiner et al., 2005; Tassaneeyakul, 2008). In our study, we did not examine the influence of genetic polymorphism, because collecting this information during routine clinical practice would have been difficult.
The fixed-dose phenytoin sodium 300 mg/day, which was commonly used in the practical setting of the present study, produced low plasma phenytoin levels on at least one occasion in a large number of patients with early traumatic brain injury. Therefore, alternative regimens may be needed. According to the final model, the loading dose of intravenous phenytoin sodium to reach a phenytoin plasma concentration of 15-20 mg/L in a typical patient (weight 57 kg) would be 668.2-890.9 mg (11.7-15.6 mg/kg); the maintenance dose for a phenytoin plasma concentration of 10-20 mg/L would be 378.5-446.0 mg/day (6.6-7.7 mg/kg/day). However, a higher dose of phenytoin may increase the risk of phenytoin toxicity; therefore, close monitoring of the symptoms and signs and drug level may be needed.
CONCLUSION
A one-compartment model with Michaelis-Menten effectively described the population pharmacokinetics of phenytoin in patients with early traumatic brain injury. Values of Km and Vd in these patients were similar to that of the approximate parameters, but Vmax was slightly higher than the approximate Vmax. Although the parameters in this group of patients were slightly different from approximate parameters, the appropriate dosage regimen of phenytoin for therapeutic-range phenytoin levels in patients with early-period traumatic brain injury may be calculated by using these population pharmacokinetic parameters.
ACKNOWLEDGEMENTS
The authors would like to acknowledge Dr. Wanchana Ungphakorn, Pharmacometrics Research Group, Uppsala University, for advice in pharmacokinetics modeling. We are grateful to Dr. Parinya Chamnan, Sunpasitthiprasong Hospital, for advice in research methodology and proofreading. Finally, we are thankful to Prof. J. Edward Moreton for his helpful suggestions. This work was supported with grants from the Faculty of Pharmacy, Mahasarakham University.
REFERENCES
Agrawal, A., J. Timothy, L. Pandit, and M. Manju. 2006. Post-traumatic epilepsy: An overview. Clinical Neurology and Neurosurgery. 108: 433-39. doi: 10.1016/j.clineuro.2005.09.001
Bauer, L.A. 2008. Phenytoin. p. 485-547. Applied Clinical Pharmacokinetics, 2nd Edn. The McGraw-Hill Companies, USA.
Bauer, R.J. 2011. NONMEM Users Guide: Introduction to NONMEM 7.2.0. ICON Development Solutions, Ellicott City, Maryland, USA.
Beghi, E. 2003. Overview of studies to prevent posttraumatic epilepsy. Epilepsia 44: 21-6.
Bergstrand, M., A.C. Hooker, J.E. Wallin, and M.O. Karlsson. 2011. Prediction-Corrected Visual Predictive Checks for Diagnosing Nonlinear Mixed-Effects Models. The AAPS Journal 13: 143-51. doi:10.1208/s12248-011-9255-z
Boeckmann, A.J., L.B. Sheine, and S.L. Beal. 2011. NONMEM Users Guide-Part V. NONMEM Project Group: University of California at San Francisco, San Francisco.
Boucher, B.A., J.H. Rodman, G.S. Jaresko, S.N. Rasmussen, C.B. watridge, and T.C. Fabian. 1988. Phenytoin pharmacokinetics in critically ill trauma patients. Clinical Pharmacology and Therapeutics. 44: 675-83.
Boucher, B.A., and S.D. Hanes. 1998. Pharmacokinetic Alterations After Severe Head Injury. Clinical Pharmacokinetics. 35: 209-21. doi: 10.2165/00003088-199835030-00004
Brain Injury Special Interest Group of the American Academy of Physical Medicine and Rehabilitation. 1998. Practice parameter: antiepileptic drug treatment of post-traumatic seizure. Archives of Physical Medicine and Rehabilitation. 79: 594-97. doi:10.1016/S0003-9993(98)90081-8
Bratton, S.L., R.M. Chestnut, J. Ghajar, F.F. Mcconnell Hammond, O.A. Harris, R. Hartl, G.T. Manley, A. Nemecek, D.W. Newell, G. Rosenthal, J. Schouten, S.D. Timmons, J.S. Ullman, W. Videtta, J.E. Welberger, and D.W. Wright. 2007. Antiseizure Prophylaxis. Journal of Neurotrauma 24: S-83-S-86. doi:10.1089/neu.2007.9983.
Chang, B.S., and D.H. Lowenstein. 2003. Practice parameter: Antiepileptic drug prophylaxis in severe traumatic brain injury: Report of the Quality Standards Subcommittee of the American Academy of Neurology. American Academy of Neurology 60: 9-17.
Efron, B. 1979. Bootstrap Methods: Another Look at the Jackkife. The Annals of Statistics 7: 1-26.
Efron, B., and R. Tibshirani. 1993. An Introduction to the Bootstrap. FL: Chapman & Hall/CRC, Boca Raton.
Frame, B., and S.L. Beal. 1998. Non-Steady state Population Kinetics of Intravenous Phenytoin. Therapeutic Drug Monitoring. 20: 408-16. doi: 10.1097/00007691-199808000-00010
Frend, V., and M. Chetty. 2007. Dosing and Therapeutic Monitoring of Phenytoin in Young Adults After Neurotrauma: Are Current Practices Relevant?. Clinical Neuropharmacology 30: 362-69. doi: 10.1097/WNF.0b013e318059ae1c
Garga, N., and D.H. Lowenstein. 2006. Posttraumatic Epilepsy. Epilepsy currents 6: 1-5.
Grasela, T.H., L.B. Sheiner, B. Rambeck, H.E. Boenigk, A. Dunlop, P.W. Mullen, J. Wadsworth, A. Richens, T. Ishizaki, K. Chiba, H. Miura, K. Minagawa, P.G. Blain, J.C. Mucklow, C.T. Bacon, and M. Rawlins. 1983. Steady-state Pharmacokinetics of Phenytoin from Routinely Collected Patient Data. Clinical Pharmacokinetics 8: 355-64.
Gupta, Y.K., and M. Gupta. 2006. Post Traumatic Epilepsy: A Review of Scientific Evidence. Indian Journal of Pharmacology. 50: 7-16.
Jonsson, E.N., and M.O. Karlsson. 1999. Xpose--an S-PLUS based population pharmacokinetic pharmacodynamic model building aid for NONMEM. Computer methods and programs in biomedicine 58: 51-64. doi:10.1016/S0169-2607(98)00067-4
Kanjanasilp, J., Y. Preechagoon, S. Kaewvichit, and R.M.E. Richards. 2005. Population Pharmacokinetics of Phenytoin in Thai Epileptic Patients. CMU Journal of Natural Sciences. 4: 287-97.
Keizer, R.J., M.O. Karisson, and A. Hooker. 2013. Modeling and Simulation Workbench for NONMEM: Tutorial on Pirana, PsN and Xpose. CPT: Pharmacometrics & Systems Pharmacology 2: 1-9. doi: 10.1038/psp.2013.24
Khan, A.A., and A. Benerjee. 2010. The role of prophylactic anticonvulsants in moderate to severe head injury. International Journal of Emergency Medicine. 3: 181-91. doi: 10.1007/s12245-010-0180-1
Kirchheiner, J., and J. Brockmöller. 2005. Clinical consequences of cytochrome P450 2C9 polymorhisms. Clinical Pharmacology & Therapeutics 77: 1-16. doi: 10.1016/j.clpt.2004.08.009
Leppik, I.E., J. Fisher, R. Kriel, and R.J. Sawchak. 1985. Altered phenytoin clearance with febrile illness. Neurology 36: 1367-70.
Lindbom, L., P. Pihlgren, and E.N. Jonsson. 2005. PsN-Toolkit--a collection of computer intensive statistical methods for non-linear mixed effect modeling using NONMEM. Computer methods and programs in biomedicine 79: 241-57. doi: 10.1016/j.cmpb.2005.10.001
Mamiya, K., I. Ieiri, J. Shimamoto, E. Yukawa, J. Imai, H. Ninomiya, H. Yamada, K. Otsubo, S. Higuchi, and N. Tashiro. 1998. The effects of genetic polymorphisms of CYP2C9 and CYP2C19 on phenytoin metabolism in Japanese adult patients with epilepsy: Studies in stereoselective hydroxylation and population pharmacokinetics. Epilepsia 39: 1317-23. doi: 10.1111/j.1528-1157.1998.tb01330.x
Mandema, J.W., D. Verotta, and L.B. Sheiner. 1992. Building population pharmacokinetic--pharmacodynamic models. I. Models for covariate effect. Journal of pharmacokinetics and biopharmaceutics 20: 511-28. doi: 10.1007/BF01061469
Odani, A., Y. Hashimoto, K. Takayanagi, Y. Otsuki, T. Koue, M. Takano, M. Yasuhara, H. Hattori, K. Furusho, and K. Inui. 1996. Population Pharmacokinetics of Phenytoin in Japanese Patients with Epilepsy: Analysis with a Dose-Dependent Clearance Model. Biological & Pharmaceutical Bulletin 19: 444-48. doi: 10.1248/bpb.19.444
Odani, A., Y. Hashimoto, Y. Otsaki, Y. Uwai, H. Hattori, K. Furusho, and K. Inui. 1997. Genetic polymorphism of the CYP2C subfamily and its effects on the pharmacokinetics of phenytoin in Japanese patients with epilepsy. Clinical Pharmacology and Therapeutics 62: 287-92. doi: 10.1016/S0009-9236(97)90031-X
R Core Team. 2013. R: A Language and Environment for Statistical Computing. R foundation for statistical computing, Vienna, Austria.
Schierhout, G., and I. Roberts. 1998. Prophylactic antiepileptic agents after head injury: a systematic review. Journal of Neurology, Neurosurgery, and Psychiatry 64: 108-12.
Soga, Y., F. Nishimura, Y. Ohtsuka, H. Araki, Y. Iwamoto, H. Naruishi, N. Shiomi, Y. Kobayashi, S. Takashiba, K. Shimizu, Y. Gomita, and E. Oka. 2004. CYP2C polymorphisms, phenytoin metabolism and gingival overgrowth in epileptic patients. Life Sciences. 74: 827-34.
Stubbins, M.J., L.W. Harries, G. Smith, M.H. Tarbit, and C.R. Wolf. 1996. Genetic analysis of the human cytochrome P450 CYP2C9 locus. Pharmacogenetics 6: 429-39. doi: 10.1097/00008571-199610000-00007
Takanashi, K., H. Tainaka, K. Kobayashi, T. Yasumori, M. Hosakawa, and K. Chiba. 2000. CYP2C9 Ile359 and Leu359 variants: enzyme kinetic study with substrates. Pharmacogenetics 10: 95-104. doi: 10.1097/00008571-200003000-00001
Tassaneeyakul, W. 2008. Genetic Polymorphism of Drug Metabolizing Enzymes in Thais. Proceeding of the 2nd Asian Pacific ISSX Regional Meeting. Winter, M.E. 2004. Phenytoin. p. 321-63. In M.E. Winter (ed) Basic Clinical Pharmacokinetic, 4thEdn. Lippincott Williams & Wilkins, USA.
Winter, M.E. 2008. Phenytoin and Fosfomycin. p. 247-64. In J.E. Murphy (ed) Clinical pharmacokinetics, 4thEdn. American Society of Health-System Pharmacists, Inc, USA.
Yano, Y., S.L. Beal, and L.B. Sheiner. 2001. Evaluating pharmacokinetic/pharmacodynamic Models Using the Posterior Predictive check. Journal of Pharmacokinetics and Pharmacodynamics 28: 171-92. doi: 10.1023/A:1011555016423
Yukawa, E., S. Higuchi, and T. Aoyama. 1989. Population Pharmacokinetics of Phenytoin from Routine Clinical Data in Japan. Journal of Clinical Pharmacy and Therapeutics 14: 71-7.
Yukawa, E., K. Mamiya. 2006. Effect of CYP2C19 genetic polymorphism on pharmacokinetics of phenytoin and phenobarbital in Japanese epileptic patients using non-linear mixed effects model approach. Journal of Clinical Pharmacy and Therapeutics. 31: 275-82. doi: 10.1111/j.1365-2710.2006.00712.x
van der Weida, J., L.S. Steijns, and M.J. van Weelden. 2001. The effect of genetic polymorphism of Cytochrome P450 CYP2C9 on phenytoin dose requirements. Pharmacogenetics 11: 287-91. doi: 10.1097/00008571-200106000-00002
Kansinee Srisaeng1,2*, Juntip Kanjanasilp1, Peeraya Sriphong1, Chumlong Kittivaravach3 and Prawatwong Wongsrikaew3
1 Faculty of Pharmacy, Mahasarakham University, Maha Sarakham 44150, Thailand
2 Pharmacy Department, Sunpasitthiprasong Hospital, Ubon Ratchathani 34000, Thailand
3 Neurosurgery Department, Sunpasitthiprasong Hospital, Ubon Ratchathani 34000, Thailand
*Corresponding author. E-mail: yingkans@gmail.com
Total Article Views