 ISSN: 2822-0838 Online

Prediction of Antioxidant Capacity of Thai Indigenous Plant Extracts by Proton Nuclear Magnetic Resonance Spectroscopy
Trakul Prommajak , Sang Moo Kim , Cheol-Ho Pan , Sang Min Kim , Suthat Surawang and Nithiya Rattanapanone*Published Date : 2019-08-24
DOI : 10.12982/CMUJNS.2015.0083
Journal Issues : Number 2, May - August 2015
ABSTRACT
Antioxidant capacities of the ethanol extracts from 28 Thai indigenous plants were determined by FCRC, DPPH, ABTS and FRAP assays. Proton nuclear magnetic resonance spectra of the extracts dissolved in D2O were measured at 300 MHz. The antioxidant capacity and integrated peaks of nuclear magnetic resonance (NMR) spectra were analyzed by partial least square (PLS) regression. Linear correlation was found between the actual and predicted antioxidant capacities of all assays with R2 more than 0.84 for calibration models and more than 0.54 for cross-validation models. However, these values were lower than those using infrared (IR) spectroscopy in our previous study. The lower efficiency of NMR-PLS regression might be due to the integrated NMR spectra having lower resolution than the whole IR spectra. Therefore, full NMR spectra should be further investigated for predicting the antioxidant capacity or other biochemical properties of plant extracts.
Keywords: Thai plants, antioxidant capacity, nuclear magnetic resonance spectroscopy, partial least square regression
INTRODUCTION
Plants are important sources of phytochemicals with various biological activities, including antioxidant activity, which has been studied extensively. Antioxidants inhibit free radicals by hydrogen atom transfer or electron transfer. Various assays should be conducted to evaluate the total antioxidant capacity of a sample (Karadag et al., 2009). Commonly used antioxidant assays include 1,1-diphenyl-2-picrylhydrazyl (DPPH), 2,2′-azinobis (3-ethylbenzothiazoline-6-sulfonic acid) diammonium salt (ABTS), ferric reducing antioxidant power (FRAP), and oxygen radical absorbance capacity (ORAC) assays. ORAC assay measures antioxidant capacity based on hydrogen atom transfer, while DPPH, ABTS and FRAP assays are based on electron transfer (Huang et al., 2005). Folin-Ciocalteu reagent, formerly used for determination of total phenolic content, reacts with any reducing species in a sample by electron transfer; this method is called Folin-Ciocalteu reducing capacity (FCRC) (Magalhães et al., 2010). However, it is time-consuming and expensive to perform all of these assays.
Infrared (IR) spectroscopy and multivariate data analysis, e.g., partial least square regression (PLS) and cluster analysis, has been applied for fast and non-destructive quality control of agricultural commodities and food products (Sun, 2009). IR spectroscopy, in combination with PLS regression, has effectively predicted the chemical composition and antioxidant activity of food products (Lam et al., 2005; Leopold et al., 2011; Versari et al., 2010). In measurement of IR spectrum, only KBr is required for sample preparation in KBr pellet technique and no reagent is required for horizontal attenuated total reflectance technique (Meissl et al., 2007). Therefore, IR spectroscopy with multivariate analysis can cost effectively predict the antioxidant capacity of food products; many antioxidant assays can be predicted by a single IR spectrum (Lu et al., 2011).
In organic chemistry, IR spectroscopy is used in combination with nuclear magnetic resonance (NMR) spectroscopy for the structural elucidation of compounds (Lampman et al., 2009). While both techniques provide similar information, NMR spectroscopy is higher resolution (Edwards, 2006). Therefore, NMR and IR spectroscopy should theoretically be used for multivariate analysis of antioxidant activity of food samples.
The objective of this study was to apply NMR spectroscopy to predict the antioxidant capacities of plant extracts that were determined by ET-based assays, including FCRC, ABTS, DPPH and FRAP assays. In this way, four antioxidant capacity values of plant extracts were determined by a single NMR measurement, reducing sample preparation, chemical reagents and the time required for conducting all antioxidant assays.
MATERIALS AND METHODS
Raw materials
Plants were collected from local markets and a farm in Chiang Mai, Thailand in August-September, 2012 (Table 1). A wide range of plants was randomly selected in order to obtain a wide range of antioxidant capacities for making the regression model. The moisture content of the plants was determined by the AOAC method (AOAC, 2000).
Analytical grade ethanol for extraction was obtained from J.T. Baker (Coopersburg, PA, USA). All other analytical reagents were obtained from Sigma-Aldrich (St. Louis, MO, USA).
Table 1. Antioxidant capacities of freeze-dried Thai indigenous vegetable extracts.
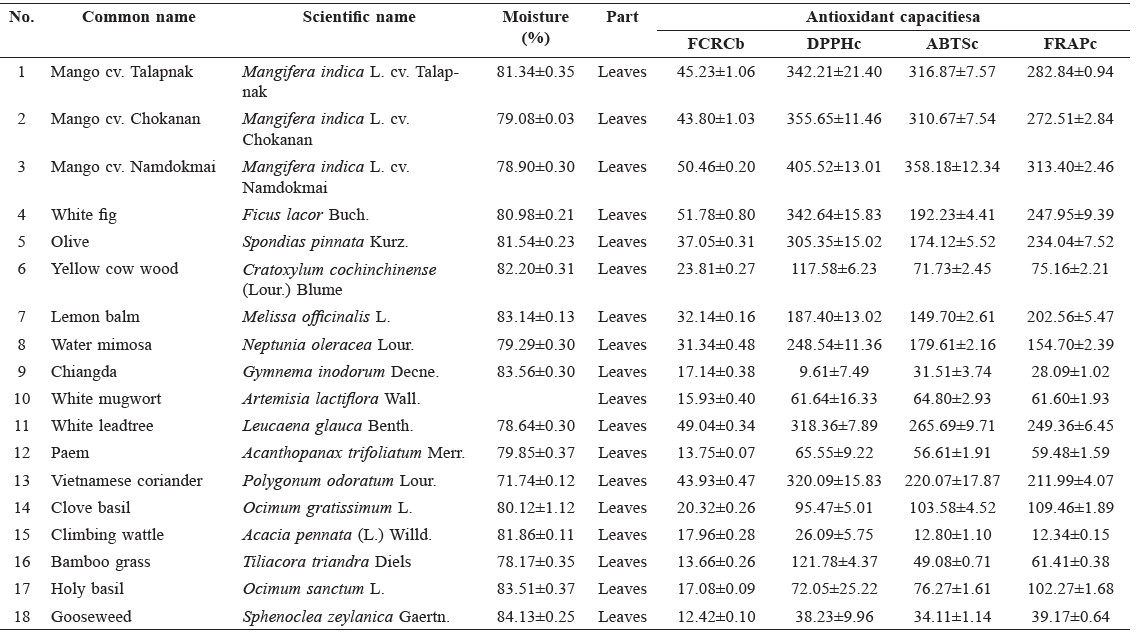
Note: a Means ± standard deviation of at least triplicate analysis. b Unit of FCRC was g GAE equivalent/100 g extract. c Unit of DPPH, ABTS, FRAP was mmol Trolox equivalent/100 g extract.
Preparation of plant extracts
Edible parts of 28 plants were washed with tap water for about 1 min at room temperature and drained for 1 h. Each plant was extracted with 60% ethanol at a plant-to-solvent ratio of 1:5 (w/v) using a blender (Model MR 4050 CA, Braun, Spain) for 30 s (Prommajak et al., 2014). Then, the solution was filtered through a double layer of muslin cloth and centrifuged at 2,500 x g (Universal 320 R, Hettich, Tuttlingen, Germany) for 20 min. The supernatant was evaporated by a rotary evaporator (Eyela, Tokyo, Japan), lyophilized by freeze-dryer (Labconco, Kansas City, MO, USA), and ground into powder. The freeze-dried samples were kept at -20°C until use. Extraction was performed in triplicates.
Determination of Antioxidant Capacities
The dry powder (1 mg) was dissolved in 1 mL of 50% (v/v) ethanol and was then analyzed for antioxidant capacities. Folin-Ciocalteu reducing capacity (FCRC) was analyzed by the modified method of Dudonné et al. (2011). The result was expressed as gram gallic acid equivalent (GAE)/100 g extract.
2,2′-Azinobis (3-ethylbenzothiazoline-6-sulfonic acid) diammonium salt (ABTS) radical scavenging capacity (RSC) was analyzed according to the method of Re et al. (1999). 1,1-diphenyl-2-picrylhydrazyl (DPPH) radical scavenging capacity assay was determined according to the modified method of Payet et al. (2005). Ferric reducing antioxidant power (FRAP) was determined according to the method of Benzie and Strain (1996). The result was expressed as mmol Trolox equivalent (TE) /100 g extract. Analyses were performed at least in triplicates.
TE value was calculated as the following equation:
Antioxidant capacity (mmol TE/100 g extract) = “A×V×D” /”W×10”
where A is TE calculated from standard curve (mM).
V is volume of solvent used for dissolving the extract (ml).
D is dilution factor.
W is weight of freeze-dried extract (g).
Nuclear magnetic resonance spectroscopy
Plant extract (5 mg) was dissolved in 1 ml of D2O. Proton NMR spectra were acquired by JNM-LA300 FT NMR system (Jeol, Tokyo, Japan) operated at 300 MHz. Peak integration was performed and the proton contents in each chemical shift were used for statistical modeling.
Statistical analysis
Partial least square (PLS) regression was performed with Unscrambler version 9.7 (CAMO Software AS, Oslo, Norway). Integrated NMR peaks were used as explanatory variables, while antioxidant capacities were used as reference values. Data centering was conducted prior to statistical analysis. Sample outliers were excluded from the model to obtain a higher correlation coefficient and lower prediction error. Leave-one-out cross validation was used for model validation. K-means cluster analysis and data visualization were performed by R version 2.15.2 (http://cran.r-project.org/) with ‘cluster’ package (Maechler et al., 2013).
RESULTS
Antioxidant capacities of plant extracts
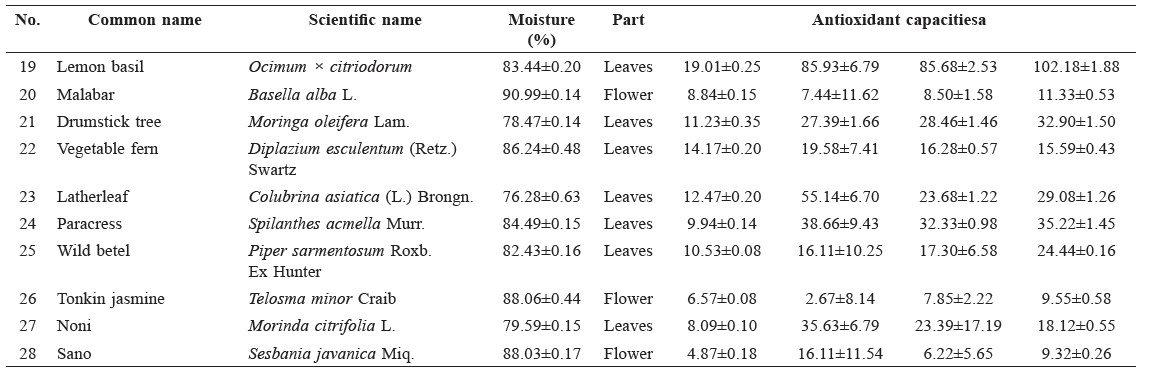
Antioxidant capacities of plant extracts are shown in Table 1. According to K-means cluster analysis based on all antioxidant capacity values, the samples were divided into four groups. Only ABTS and FRAP data had non-overlapping values between groups. The first group had high antioxidant capacity, with ABTS values of more than 260 mmol Trolox eq./100 g and FRAP values of more than 249 mmol Trolox eq./100 g. This group included Leucaena glauca Benth and three varieties of Mangifera indica L. The second group had moderate antioxidant capacity, with ABTS values between 149 and 221 mmol Trolox eq./100 g and FRAP values between 154-248 mmol Trolox eq./100 g. This group included Ficus lacor Buch., Spondias pinnata Kurz., Melissa officinalis L., Neptunia oleracea Lour. and Polygonum odoratum Lour. The third group had moderately low antioxidant capacity, with ABTS values between 49 and 104 mmol Trolox eq./100 g and FRAP values between 59 and 110 mmol Trolox eq./100 g. This group included Cratoxylum cochinchinense, Artemisia lactiflora, Acanthopanax trifoliatum, Ocimum gratissimum, Tiliacora triandra, Ocimum sanctum and Ocimum × citriodorum. The remaining samples had low antioxidant capacity, with ABTS values lower than 35 mmol Trolox eq./100 g and FRAP values lower than 40 mmol Trolox eq./100 g (Figure 1). Correlations were found between the antioxidant values obtained from the four assays at a significance level less than 0.01 (Figure 2).
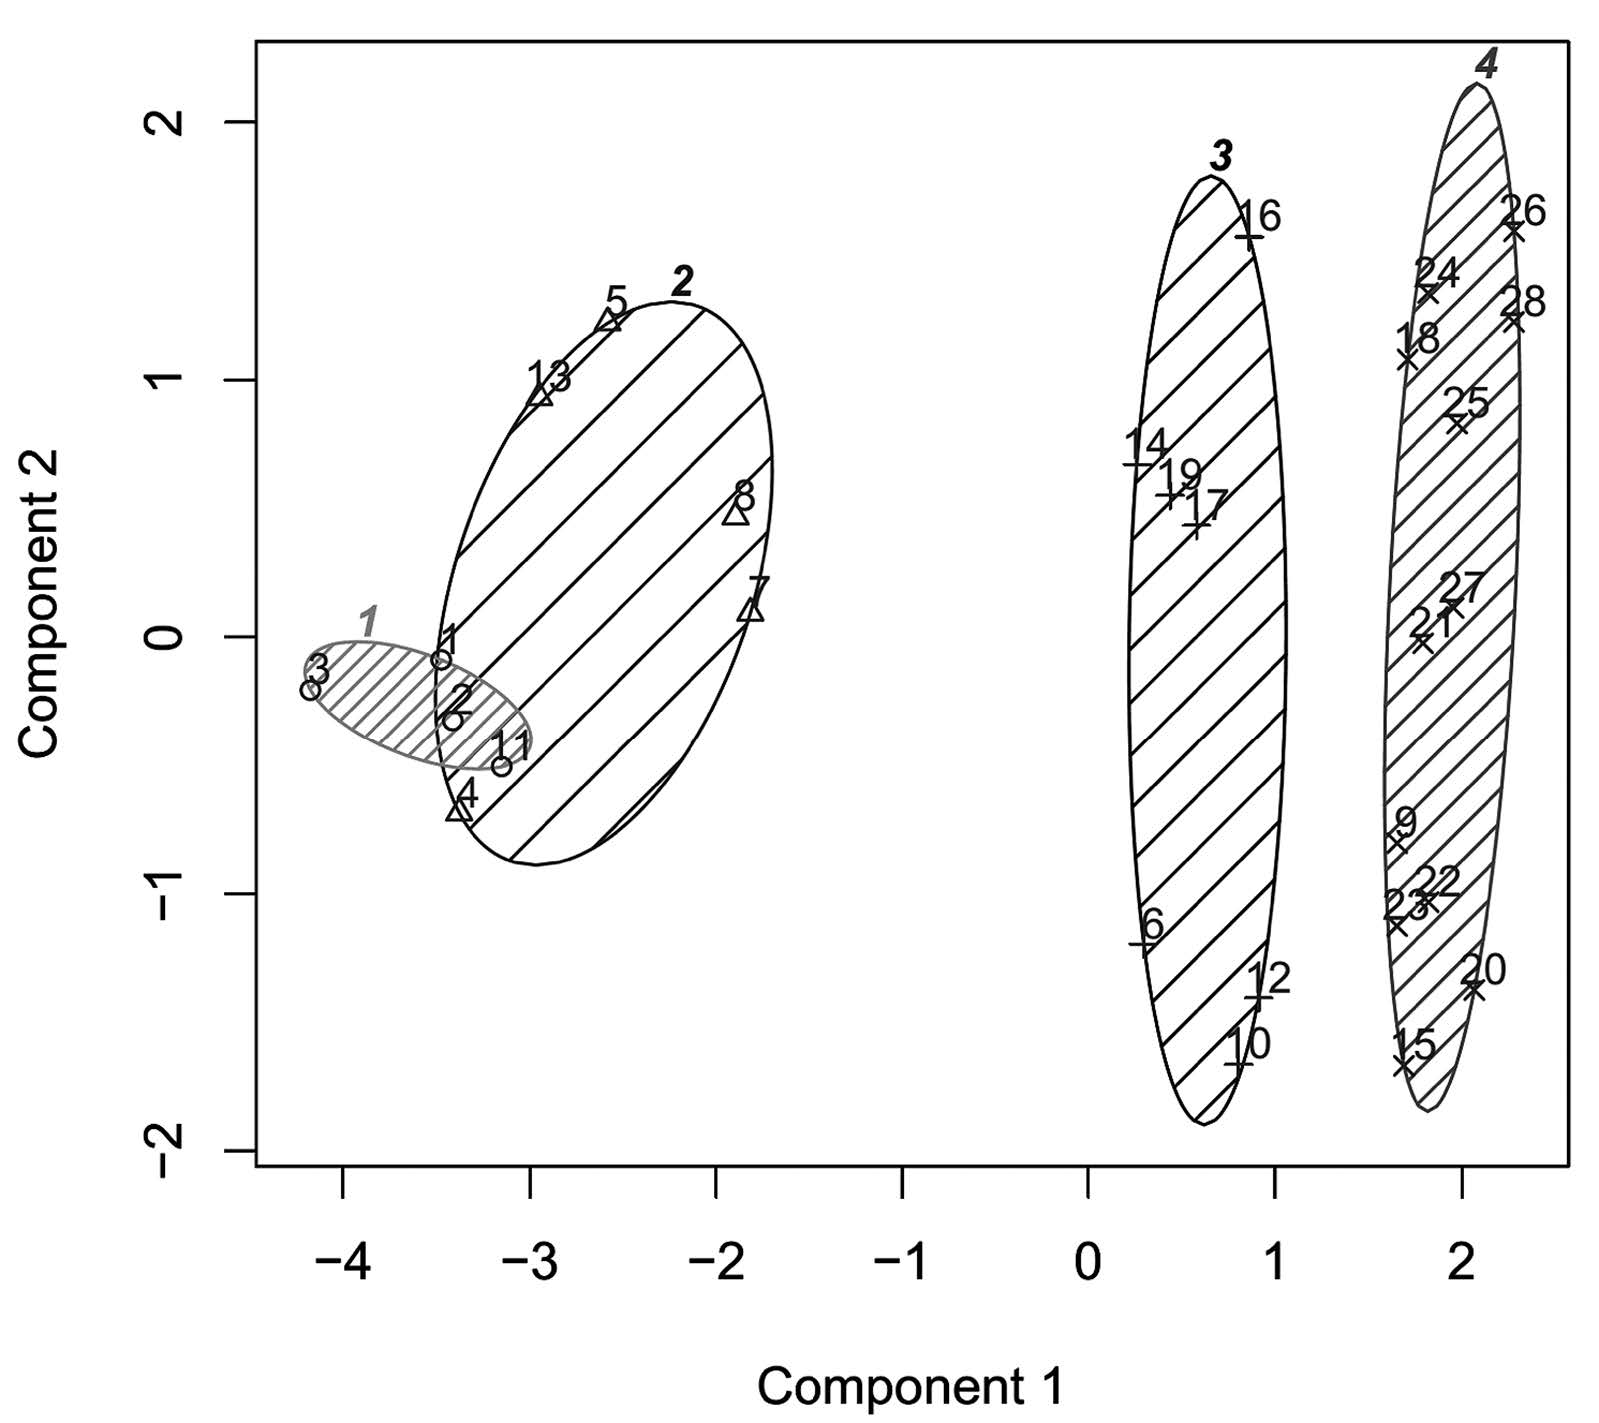
Figure 1. K-means clustering of Thai indigenous vegetable extracts based on antioxidant capacity.
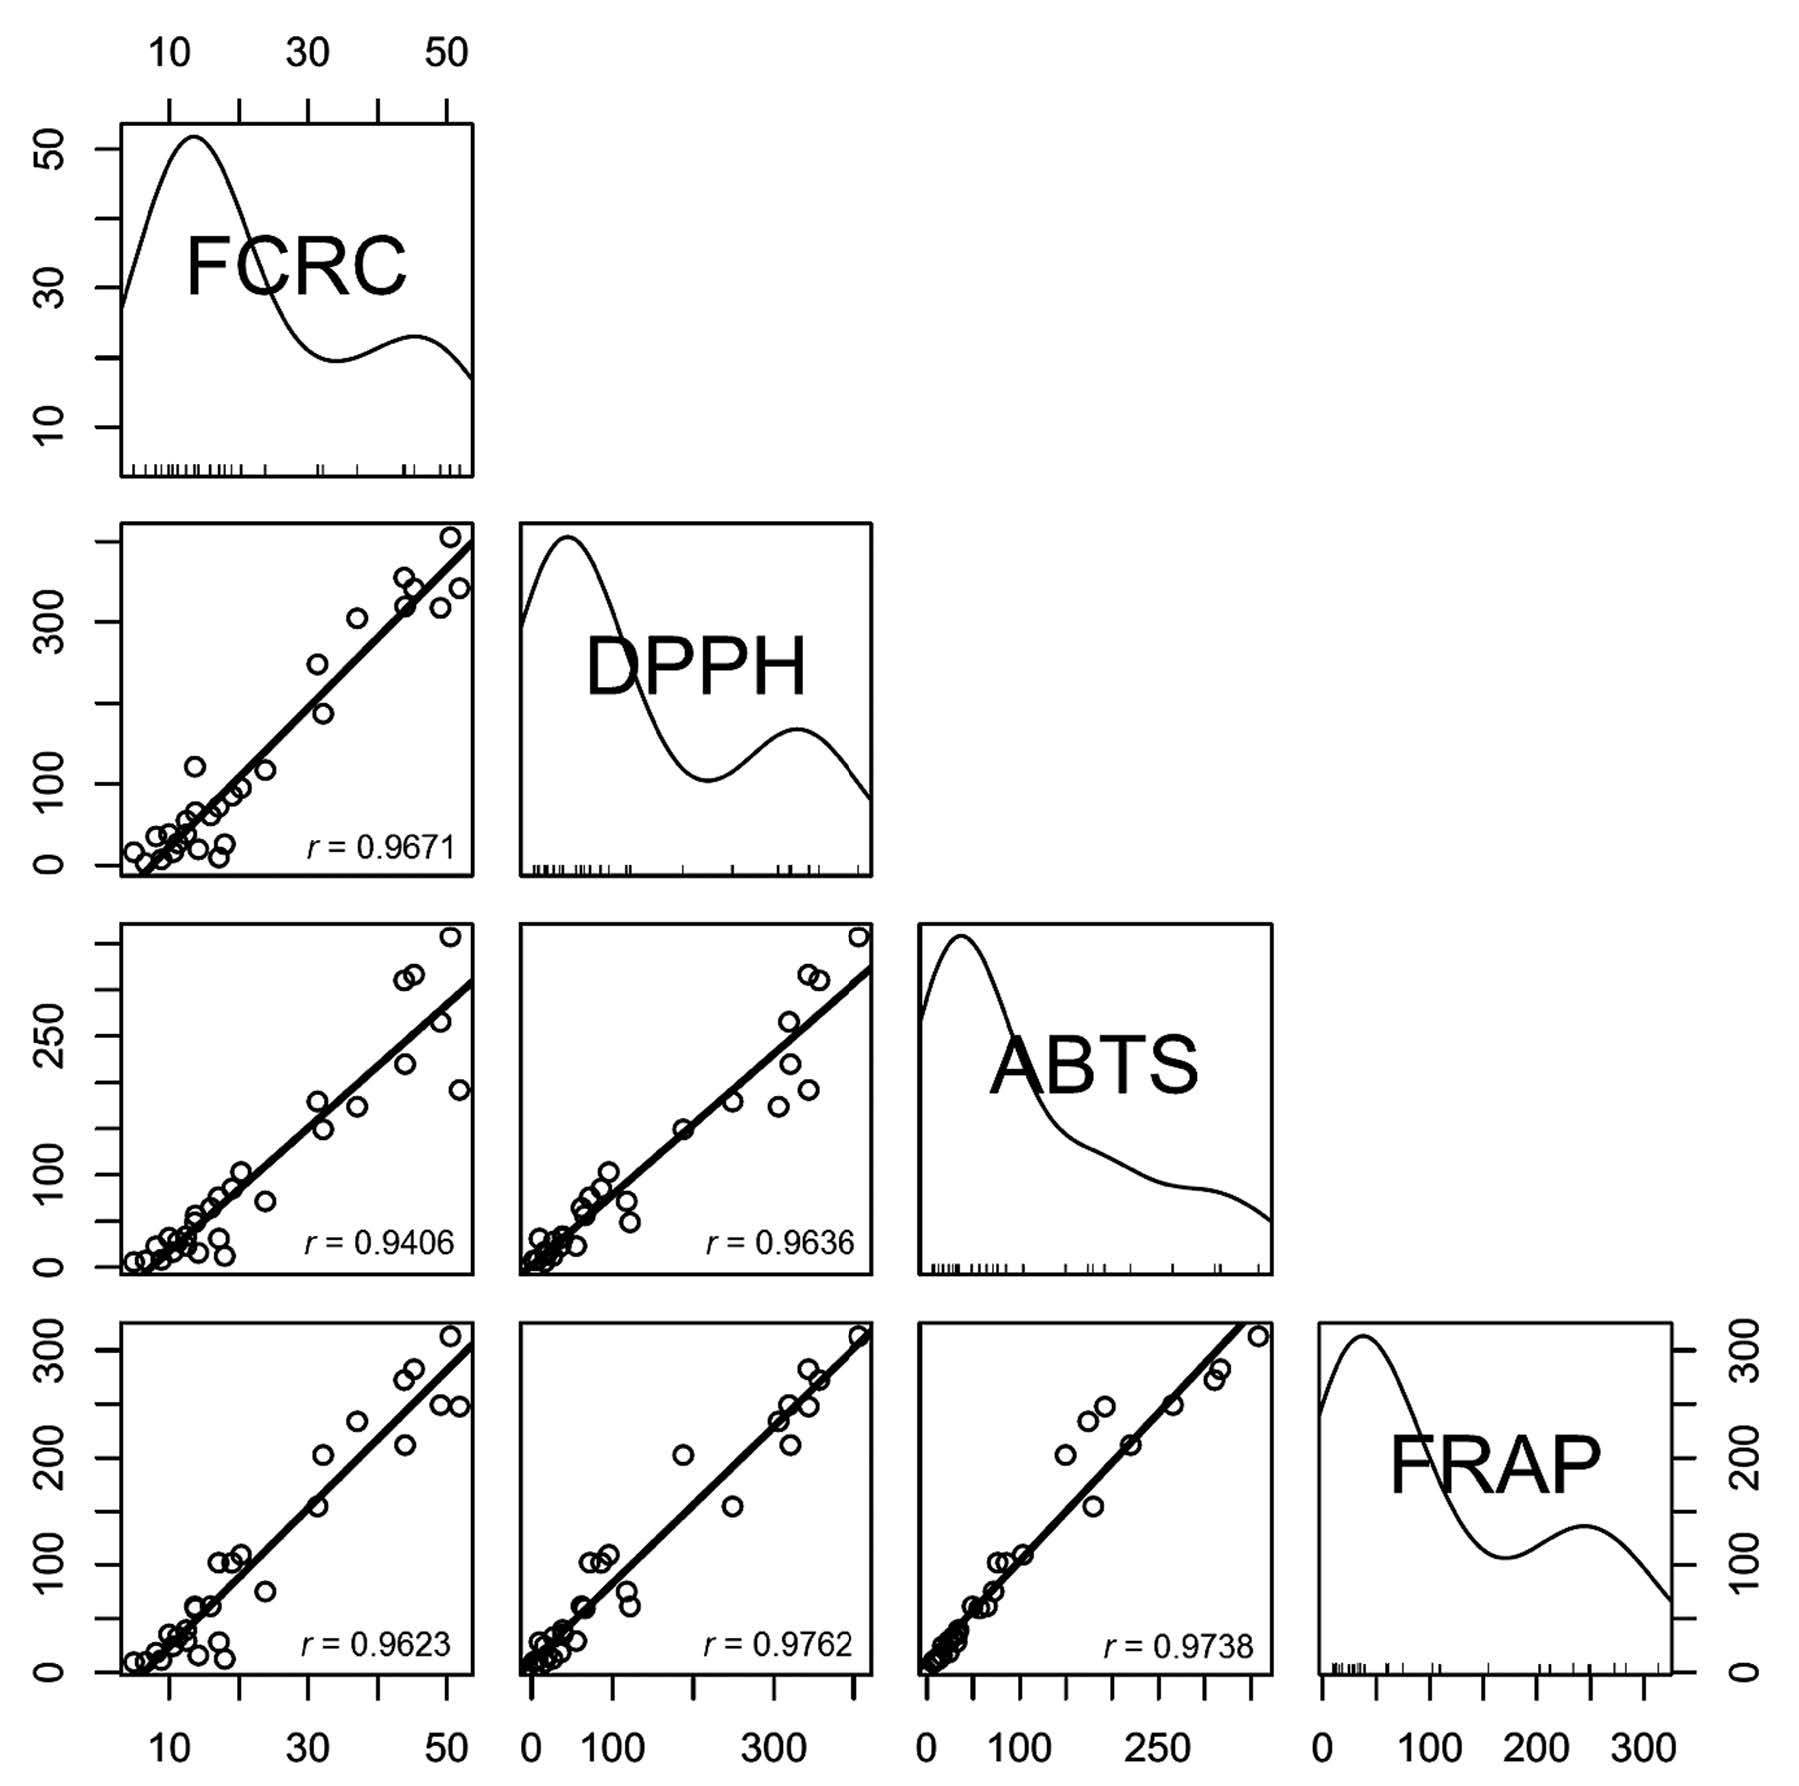
Figure 2. Correlation between FCRC, DPPH, ABTS and FRAP assays with Pearson’s correlation coefficient (r).
NMR-PLS regression of antioxidant capacity
The integration data of NMR peaks and antioxidant capacity values were used for PLS regression. Predicted antioxidant capacity was correlated with the measured antioxidant capacity (Figure 3). Coefficients of determination (R2) were more than 0.84-0.89 for the calibration models and 0.54-0.68 for the cross-validation models (Table 2). FRAP assay had the highest R2 of the calibration models, while ABTS assay had the highest R2 of the validation models. Residual showed the difference between actual and predicted value (y − ŷ). Water mimosa (sample 8) showed large residuals (Figure 4).
Table 2. Parameters and results of PLS regression.
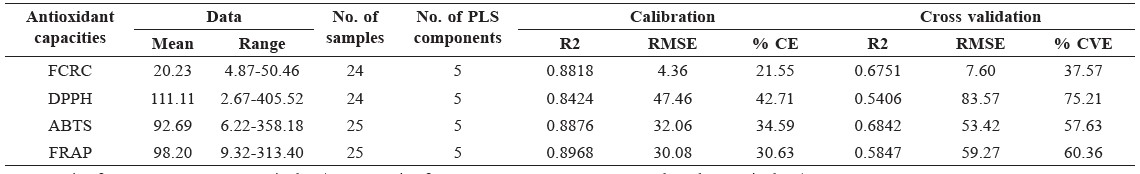
Note: Unit of FCRC was g GAE equivalent/100 g. Unit of DPPH, ABTS, FRAP was mmol Trolox equivalent/100 g. RMSE – root mean square error; CE –calibration error; CVE – validation error.
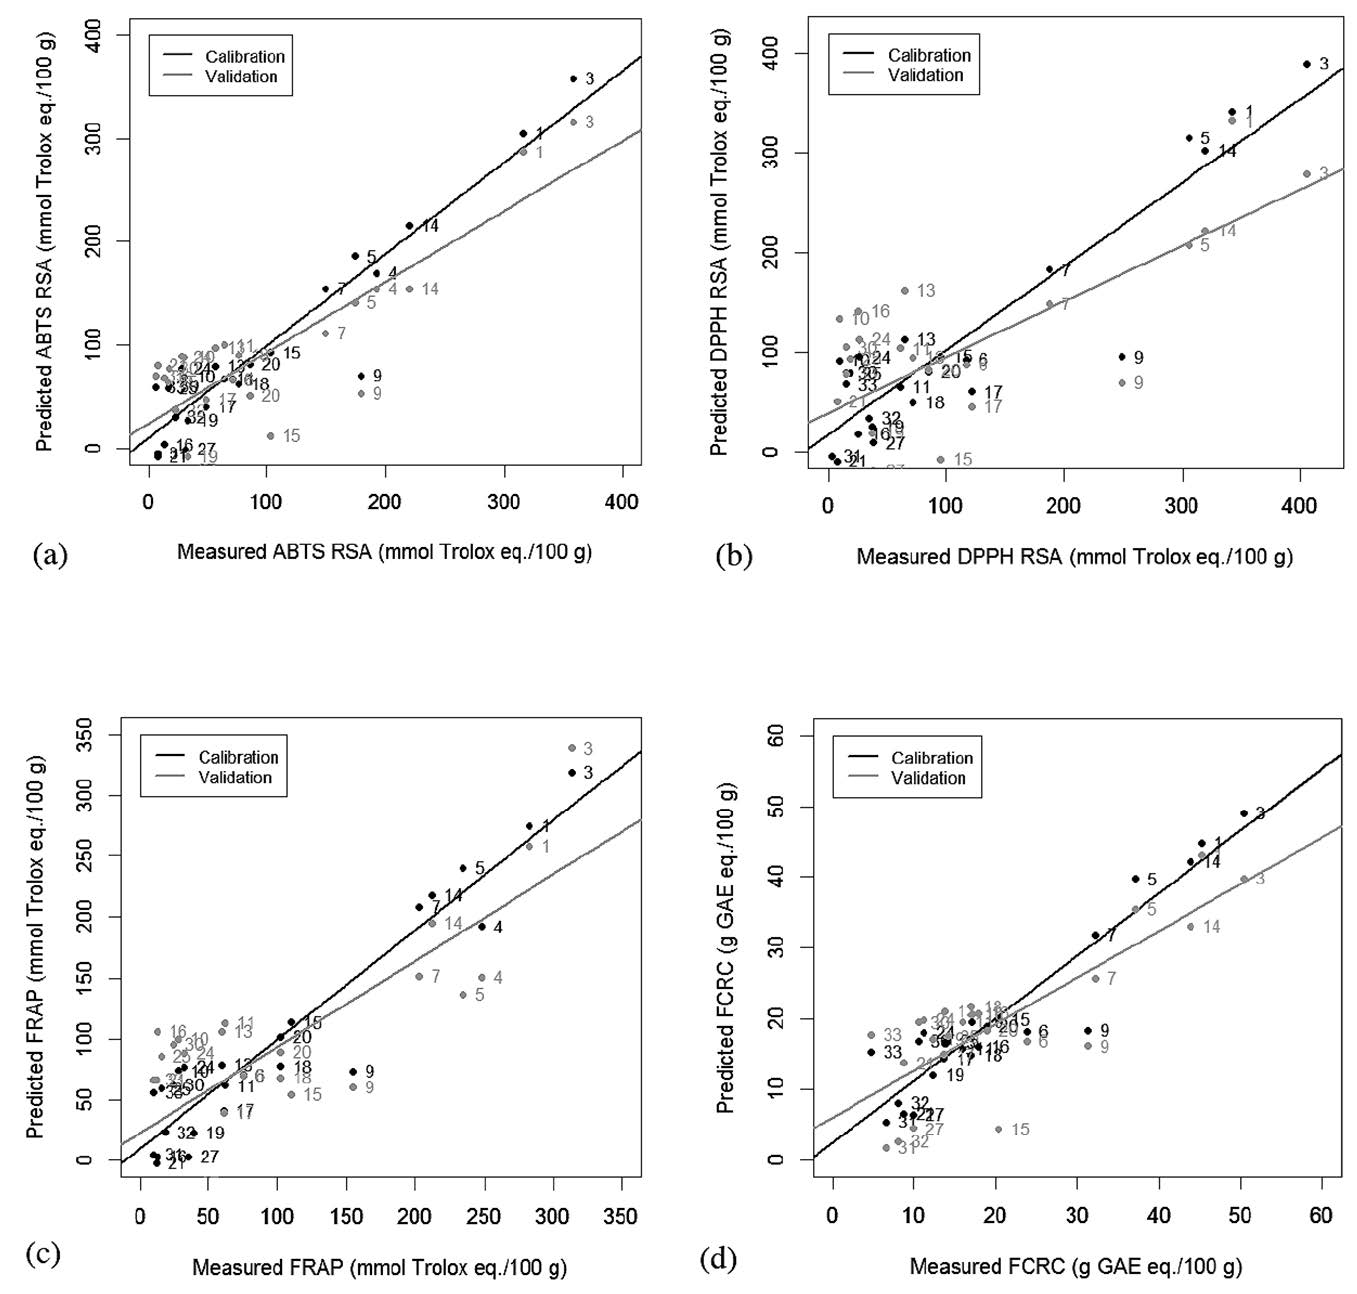
Figure 3. Measured and predicted (a) ABTS, (b) DPPH, (c) FRAP and (d ) FCRC values of freeze-dried extract by NMR-PLS regression.
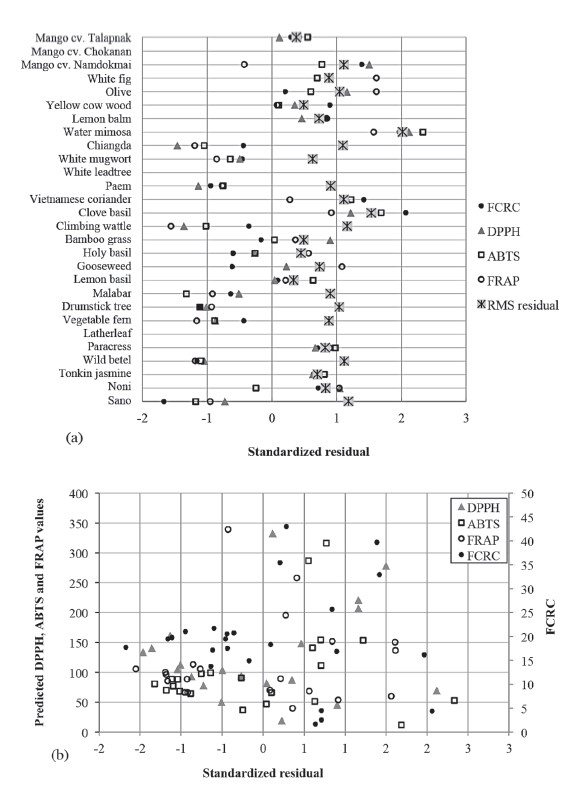
Figure 4. Residual plots of LOO cross-validated NMR-PLS data for (a) individual sample and (b) predicted antioxidant capacity of freeze-dried extract.
The effect of functional groups of bioactive compounds in plant extracts on antioxidant capacity could be determined by regression coefficients of PLS models. The patterns of regression coefficient were similar among all assays (Figure 5). Regression coefficients at the chemical shifts of 1.0, 1.2, 3.5 and 6.9 had large positive values.
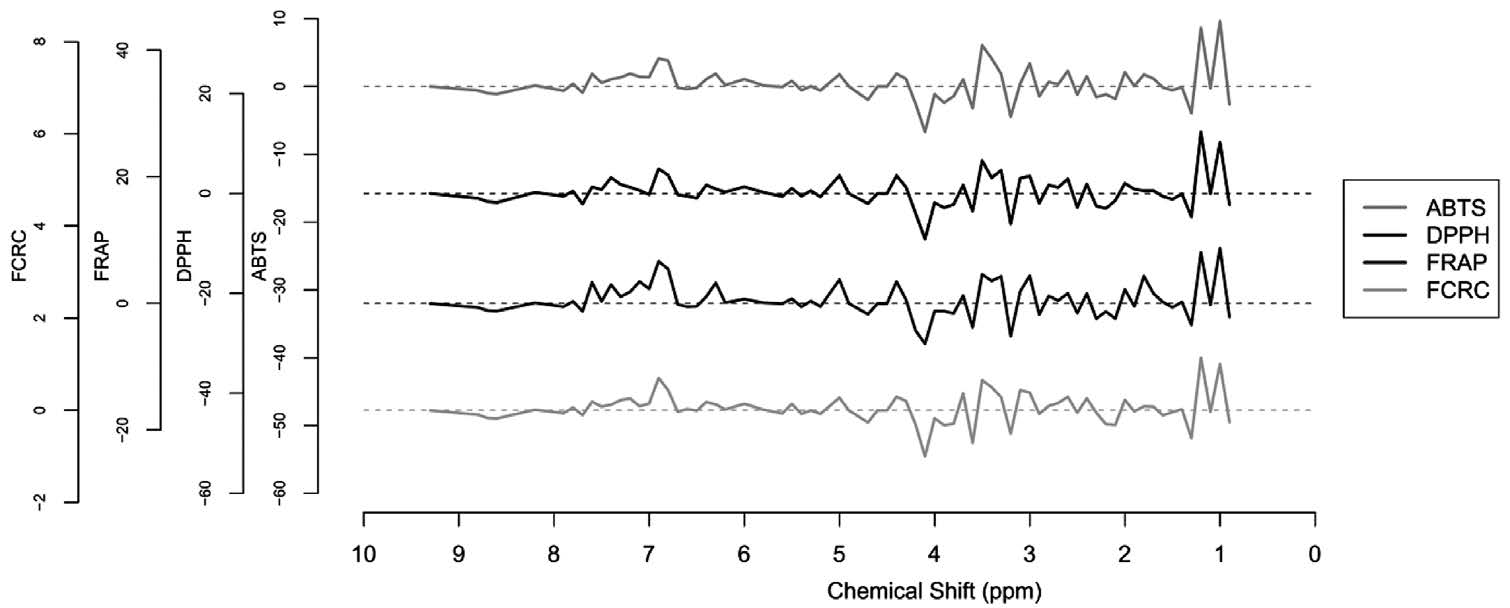
Figure 5. Regression coefficients for the NMR-PLS prediction of antioxidant capacity of (a) liquid and (b) freeze-dried vegetable extracts.
DISCUSSION
The positive correlations between the antioxidant values obtained from four assays may be due to the same electron transfer antioxidant mechanism of the assays (Karadag et al. 2009). Most antioxidant values of the extracts were located in the region of low antioxidant capacity. Frequency plot indicated a similarity between the FCRC, DPPH, and FRAP assays. However, the shape of the frequency plot was different for the ABTS assay. Some samples with a high antioxidant value in three of the assays shifted to the middle region in the ABTS assay. This may be due to different reactions between the assays. The reaction of ABTS radical and phenols was composed of first and secondary reactions between the compounds, which resulted in a rapid reaction. In contrast, the reaction of DPPH radical and phenol is complex and composed of many reversible reactions, which resulted in a different rate of reaction. Moreover, the reaction of DPPH also depended on phenolic compounds (Koleva et al., 2001).
The R2 values of NMR-PLS models were less than those obtained from our previous study using infrared (IR) spectra (R2>0.98 for calibration models and R2>0.89 for validation models). This might be because the resolution of integrated NMR data was less than full IR spectra. In partial least square regression, an increasing number of PLS components generally resulted in a R2 higher value. NMR-PLS had four to five PLS components; this was lower than FTIR-PLS (5-11 components). However, increasing the PLS components in NMR-PLS to a level higher than the reported value caused overfitting and resulted in higher validation errors or lower predictability.
A plot between residual and predicted values showed that the models underestimated or overestimated antioxidant capacity when predicted values were less than 200 mmol TE/100 g. However, when predicted values were higher than this, underestimation mostly occurred (Figure 4b).
A coefficient value higher than zero indicated that the functional groups at the particular chemical shift had a positive effect on the antioxidant capacity of the extract. High positive coefficients occurred at the chemical shift 1.0-1.2 and 3.4-3.5 ppm. The chemical shift around 1 ppm was assigned to the para-substituted benzene ring and the chemical shift at 1.2 ppm was assigned to the hydroxyl (OH) group. The chemical shift at 3.4-3.5 ppm was assigned to alkene or alkyne protons that were attached to the hydroxyl group (Lampman et al., 2009).
Minor positive coefficient peaks also occurred at the chemical shift of 6.8-6.9 ppm, which was assigned to the hydroxy-substituted benzene ring. The chemical shift around 7.0-8.0 ppm was assigned to the benzene ring with different substitutions. The presence of a hydroxyl group attached to a benzene ring is a key indicator for antioxidant capacity of phenolic compounds (Arts et al., 2003). The chemical shift at 6.9 and 7.6 ppm was also reported in most flavonoids, which were exhibited by the proton from ring C and B of flavonoids, respectively (Yoon et al., 2011).
On the other hand, a regression coefficient value less than zero indicated that functional groups had a negative effect on antioxidant capacity. The negative coefficients were found at chemical shifts of 1.3, 2.3, 3.2 and 4.1 ppm. The chemical shift at 4.1 could be assigned to the proton in the –COOCH3 or –OCH2 groups attached to phenol, which had a steric effect and decreased the antioxidant capacity of the phenolic compounds. Similarly, the negative effect of –CH3 substitution in phenol was also reflected at the chemical shift at 2.3 ppm (Lampman et al., 2009). These results were confirmed and indicated that phenolic acids and flavonoids were major contributors to antioxidant activity of the samples.
NMR-PLS regression provided models with lower R2 and higher error when compared with IR-PLS regression. Theoretically, NMR provides more information than IR. However, in this study, peak integration was used instead of full spectrum, which cannot be exported from the computer. Therefore, full NMR spectrum should be further investigated for better predictability and convenience in statistical analysis.
CONCLUSION
NMR spectroscopy was used to predict the antioxidant capacities of plant extracts. NMR-PLS regression had an R2 > 0.82 for calibration models and an R2 > 0.52 for validation models, showing less predictability compared with IRPLS regression. The lower efficiency of NMR-PLS might due to integrated NMR spectra, which had lower resolution than the whole IR spectra. The coefficients of PLS regression models revealed that the aromatic ring and hydroxyl group were responsible for the antioxidant activity of the plant extracts.
ACKNOWLEDGEMENTS
C. Pan and S. Kim were supported by a KIST Gangneung Institute intramural grant (2Z04220).
REFERENCES
AOAC. 2000. Official Methods of Analysis of AOAC, 17th ed. Association of Official Analytical Chemists, Gaithersburg.
Arts, M.J., J. Sebastiaan Dallinga, H.P. Voss, G.R. Haenen, and A. Bast. 2003. A critical appraisal of the use of the antioxidant capacity (TEAC) assay in defining optimal antioxidant structures. Food Chemistry 80: 409-414.
Benzie, I.F., and J. Strain. 1996. The ferric reducing ability of plasma (FRAP) as a measure of “antioxidant power”: the FRAP assay. Analytical Biochemistry 239: 70-76.
Cai, Y., Q. Luo, M. Sun, and H. Corke. 2004. Antioxidant activity and phenolic compounds of 112 traditional Chinese medicinal plants associated with anticancer. Life Sciences 74: 2157-2184.
Dudonné, S.P., P. Poupard, P. Coutière, M. Woillez, T. Richard, J.M. Mérillon, and X. Vitrac. 2011. Phenolic composition and antioxidant properties of poplar bud (Populus nigra) extract: individual antioxidant contribution of phenolics and transcriptional effect on skin aging. Journal of Agricultural and Food Chemistry 59: 4527-4536.
Edwards, J.C. 2006. Principles of NMR. [Accessed April 17, 2012]. Available from: http://www.process-nmr.com/pdfs/NMR%20 Overview.pdf.
Huang, D., B. Ou, and R.L. Prior. 2005. The chemistry behind antioxidant capacity assays. Journal of Agricultural and Food Chemistry 53: 1841-1856.
Karadag, A., B. Ozcelik, and S. Saner. 2009. Review of methods to determine antioxidant capacities. Food Analytical Methods 2: 41-60.
Koleva, I. I., Niederländer, H. A., and T. A. van Beek. 2001. Application of ABTS radical cation for selective on-line detection of radical scavengers in HPLC eluates. Analytical Chemistry 73: 3373-3381.
Lam, H.S., A. Proctor, L. Howard, and M.J. Cho. 2005. Rapid fruit extracts antioxidant capacity determination by Fourier transform infrared spectroscopy. Journal of Food Science 70: C545-C549.
Lampman, G.M., D.L. Pavia, G.S. Kriz, and J.A. Vyvyan. 2009. Spectroscopy. Brooks/Cole, Belmont.
Leopold, L., N. Leopold, H. Diehl, and C. Socaciu. 2011. Prediction of total antioxidant capacity of fruit juices using FTIR spectroscopy and PLS regression. Food Analytical Methods 5: 405-407.
Lu, X., J. Wang, H.M. Al-Qadiri, C.F. Ross, J.R. Powers, J. Tang, and B.A. Rasco. 2011. Determination of total phenolic content and antioxidant capacity of onion (Allium cepa) and shallot (Allium oschaninii) using infrared spectroscopy. Food Chemistry 129: 637-644.
Maechler, M., P. Rousseeuw, A. Struyf, M. Hubert, and K. Hornik. 2013. cluster: Cluster Analysis Basics and Extensions. R package version 1.14.4.
Magalhães, L.M., F. Santos, M.A. Segundo, S. Reis, and J.L.F.C. Lima. 2010. Rapid microplate high-throughput methodology for assessment of Folin-Ciocalteu reducing capacity. Talanta 83: 441-447.
Meissl, K., E. Smidt, and M. Schwanninger. 2007. Prediction of humic acid content and respiration activity of biogenic waste by means of Fourier transform infrared (FTIR) spectra and partial least squares regression (PLS-R) models. Talanta 72: 791-799.
Payet, B., A. Shum Cheong Sing, and J. Smadja. 2005. Assessment of antioxidant activity of cane brown sugars by ABTS and DPPH radical scavenging assays: determination of their polyphenolic and volatile constituents. Journal of Agricultural and Food Chemistry 53: 10074-10079.
Prommajak, T., S. Surawang, and N. Rattanapanone. 2014. Ultrasonic-assisted extraction of phenolic and antioxidative compounds from lizard tail (Houttuynia cordata Thunb.). Songklanakarin Journal of Science and Technology 36: 65-72.
Re, R., N. Pellegrini, A. Proteggente, A. Pannala, M. Yang, and C. Rice-Evans. 1999. Antioxidant activity applying an improved ABTS radical cation decolorization assay. Free Radical Biology and Medicine 26: 1231-1237.
Romera-Fernández, M., L.A. Berrueta, S. Garmón-Lobato, B. Gallo, F. Vicente, and J.M. Moreda. 2012. Feasibility study of FT-MIR spectroscopy and PLS-R for the fast determination of anthocyanins in wine. Talanta 88: 303-310.
Shan, B., Y.Z. Cai, M. Sun, and H. Corke. 2005. Antioxidant capacity of 26 spice extracts and characterization of their phenolic constituents. Journal of Agricultural and Food Chemistry 53: 7749-7759.
Sun, D.W. 2009. Infrared Spectroscopy for Food Quality Analysis and Control. Elsevier, Burlington.
Surveswaran, S., Y.Z. Cai, H. Corke, and M. Sun. 2007. Systematic evaluation of natural phenolic antioxidants from 133 Indian medicinal plants. Food Chemistry 102: 938-953.
Versari, A., G.P. Parpinello, F. Scazzina, and D.D. Rio. 2010. Prediction of total antioxidant capacity of red wine by Fourier transform infrared spectroscopy. Food Control 21: 786-789.
Wojdylo, A., J. Oszmianski, and R. Czemerys. 2007. Antioxidant activity and phenolic compounds in 32 selected herbs. Food Chemistry 105: 940-949.
Yoon, H., S. Eom, J. Hyun, G. Jo, D. Hwang, S. Lee, Y. Yong, J.C. Park, Y.H. Lee, and Y. Lim. 2011. 1H and 13C NMR data on hydroxy/methoxy flavonoids and the effects of substituents on chemical shifts. Bulletin of the Korean Chemical Society 32: 2101-2104.
Trakul Prommajak1, Sang Moo Kim2, Cheol-Ho Pan3, Sang Min Kim3, Suthat Surawang1 and Nithiya Rattanapanone1,4*
1 Division of Food Science and Technology, Faculty of Agro-Industry, Chiang Mai University, Chiang Mai 50100, Thailand
2 Department of Marine Food Science and Technology, Gangneung-Wonju National University, Gangneung 210-702, Korea
3 Functional Food Center, Korea Institute of Science and Technology, Gangneung 210-340, Korea
4 Postharvest Technology Research Institute, Chiang Mai University, Chiang Mai 50200, Thailand
*Corresponding author. E-mail: agfsi001@gmail.com
Total Article Views