 ISSN: 2822-0838 Online

Extraction and Functional Properties of Protein from De-Oiled Rice Bran
Akkasit Jongjareonrak* , Kannanuch Srikok, Noppol Leksawasdi and Carlo AndreottiPublished Date : 2019-08-24
DOI : 10.12982/CMUJNS.2015.0079
Journal Issues : Number 2, May - August 2015
ABSTRACT
The de-oiled Sangyod Phatthalung (Oryza sativa L.) rice bran waste from screw-press, rice bran oil production contains 12.8% protein. It was used to study the optimization of protein extraction. An optimization procedure using a central composite design (CCD) with three factors –sodium hydroxide concentration (0.05-0.2 M), extraction temperature (30-60°C) and extraction time (60-240 min) – determined the effect of these parameters on extraction yield and functional properties of rice bran protein. The optimum conditions obtained by using response surface methodology (RSM) were a sodium hydroxide concentration of 0.13 M at an extraction temperature of 49°C for 170 min. The predicted protein extraction yield for these optimum conditions was 45.2%. A verification experiment was conducted under optimum conditions and the protein extraction yield was 43.1%. The experimental and predicted values were similar, confirming that the prediction model equation was capable of reasonably and accurately predicting the protein extraction yield. The rice bran protein extract exhibited a maximum solubility at pH 10 (68.3%). The foaming activity, foaming stability, emulsifying activity index (EAI) and emulsion stability index (ESI) values of the rice bran protein at pH 10 were 113.4 % v/v, 62.6 min, 0.170 (Abs500nm) and 37.1 min, respectively. These results indicated that protein can be extracted from de-oiled Sangyod Phatthalung rice bran with a high yield and can be used as a food ingredient or protein source.
Keywords: Extraction, Protein, Rice bran, Sangyod Phatthalung, Response surface methodology
INTRODUCTION
Thailand is a leading rice producer and exporter. Over 31 billion metric tons of rice paddy was harvested annually during the period 2010-2013, generating 11 billion metric tons of byproducts from rice milling and polishing, including broken rice, rice bran and rice hull (Rice Department, 2014). Rice bran is an under-utilized milling byproduct of rough rice, a large amount of which is used as animal feed or simply discarded. Several studies have reported on the nutritional quality of rice bran, which includes protein, fiber, vitamins and minerals (Barber and Benedito de Barber, 1991). The oil in rice bran is commercially extracted and used as high-quality cooking oil. Although the residue, or de-oiled rice bran, contains a high level (12-15%, wet weight basis) of protein, it has yet to be used to its full potential. Rice bran protein has been reported to be of high quality and of importance for food and pharmaceutical applications. It contains lysine, an essential amino acid. Rice bran is also a good source of hypoallergenic proteins with anti-cancer activity; therefore, rice bran protein may serve as an alternative protein ingredient for a wide range of applications (Wang et al., 1999; Fabian et al., 2011). The reports available are mostly focused on the preparation and functional properties of rice bran protein. The protein from rice bran is usually extracted using solvents – with alkaline extraction the most common (Gnanasambandam and Hettiarachchy, 1995), due to the availability of the agents. However, extracting protein from rice bran residue is still rare, and the conditions employed may differ by type of rice bran. Therefore, this investigation aims to optimize protein extraction from the de-oiled rice bran waste product from industrial oil extraction using response surface methodology (RSM). The de-oiled rice bran was derived from Sangyod Phatthalung rice, an indigenous-Thai pigmented rice commonly harvested in Southern Thailand. The cooked rice is typically pink-red in color with a soft texture and fragrant aroma. RSM, which determines model equations that describe the interrelationships between independent and dependent variables (Edwards and Jutan, 1997), is an effective method for optimizing processing conditions. The functional properties of the rice bran protein obtained by using the optimum extraction conditions were also examined.
MATERIALS AND METHODS
Materials and chemicals
Sangyod Phatthalung de-oiled rice bran from screw-press oil extraction was obtained from Baan Thai Herb Co., Ltd., Kuankanoon, Phatthalung Province, Thailand. The de-oiled rice bran was packed into Nylon-LLDPE bags, tightly sealed and transported to the laboratory at the Faculty of Agro-Industry, Chiang Mai University, Chiang Mai, Thailand and stored at 4°C until used (within 6 months). All reagents were analytical grade.
Proximate composition analyzes
Protein content was determined by Kjeldahl method using a nitrogen conversion factor of 5.95 (Wongsagonsup et al., 2005). Fat, fiber, moisture and ash content of the raw materials were analyzed according to the method of AOAC (2000). Carbohydrate content was determined by subtracting the sum of the protein, fat, ash and moisture content from 100. All experiments were done in triplicate, calculated and reported on a percent wet weight basis.
Protein extraction from de-oiled rice bran
Protein extraction was performed according to the method of Sereewatthanawut et al. (2008) with modifications. Initially, de-oiled rice bran was suspended in sodium hydroxide (NaOH) solution (0.05-0.2M) at a ratio of 1:10 (w/v). The suspension was set on a water bath at different temperatures (30-60°C) and different times (60-240 min), with continuous stirring. The suspension was then centrifuged at 6,000 x g for 15 min and filtered using filter paper (Whatman No.1) to separate the insoluble materials. The pH of the supernatant/filtrate was adjusted to pH 7 with 1 M hydrochloric acid (HCl). This was then dried in an oven at 50°C for 12 hr. Protein content of the crude extract was determined (AOAC, 2000) and the protein extraction yield (%) was calculated according to the following equation:
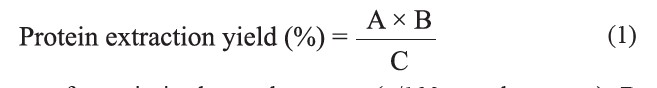
where A is the percent of protein in the crude extract (g/100g crude extract), B is the amount of crude extract (g/100g rice bran) and C is the protein content of the rice bran (12.8%)
Experimental design
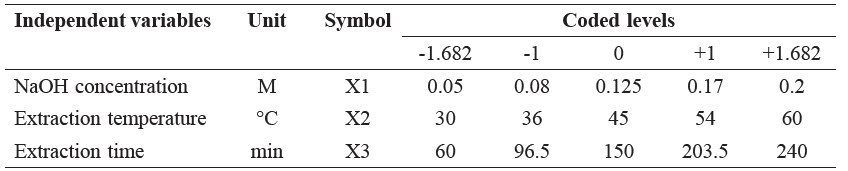
In preliminary studies, three factors – concentration of NaOH (M, X1: 0.05, 0.08, 0.125, 0.17 and 0.20 M), extraction temperature (°C, X2: 30, 36, 45, 54 and 60°C) and extraction time (min, X3: 60, 96.5, 150, 203.5, 240 min) – were identified as critical variables that significantly affected the protein extraction yield. The range and center point values of these three independent variables were based on the results of the preliminary experiments. Protein extraction yield (Y) was selected as the dependent variable for a combination of the independent variables, as given in Table 1.
Central composite design (CCD) (Box and Wilson, 1951) was used to optimize protein extraction from Sangyod Phatthalung rice bran. CCD consisted of 23 factorial points, six axial points (α=1.682) and three replicates of the central point. Experimental runs were randomized to minimize three effects of unexpected variability in the observed responses. Data were analyzed by multiple regression analysis using Minitab software (Minitab Inc., State College, Pa., USA) to fit a 2nd order model to each response. This model can be expressed with uncoded variables (X1, X2 and X3), as shown in equation (2):
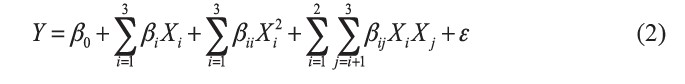
where Y is the estimated response for the dependent variables (% yield); β are the regression coefficients (β0 for the constant term, βi for the linear terms, βii for the quadratic terms for a single variable and βij for the interaction terms, with i = 1 to 3; and j = 1 to 3); Xi, Xj are levels of the independent variables; and ε is a random error. The goodness of fit of the polynomial model was evaluated by the coefficient of determination R2 and Radj2. The values of R2 suggest that the models can explain a high percentage of the variability in the observed data. Surface plots were developed using the fitted full quadratic polynomial equations obtained by holding one of the independent variables at a constant value (central point) and changing the levels of the other two variables.
Table 1. Independent variables and their coded and actual values used for optimization.
Functional properties determination of the rice bran protein extract
Protein solubility. The solubility properties of the rice bran protein extract were determined according to the method of Klompong et al. (2007) with modifications. Two hundred mg of crude protein extract were dispersed in 20 ml of deionized water and the pH of the mixture was adjusted to 2, 4, 6, 8 and 10 with 1 or 6 M HCl and 1 or 6 M NaOH. The mixture was stirred at room temperature for 60 min and centrifuged at 6,000 x g for 15 min. Protein content in the supernatant was determined using the Kjeldahl method. Protein solubility was calculated as follows:

Emulsifying properties. The emulsion activity and emulsion stability index of rice bran protein were determined at pH 2, 4, 6, 8 and 10 by the turbidimetric method (Kinsella et al., 1993). An emulsion was formed by mixing 30 ml of 1% rice bran protein extract at various pH with 10 ml of soybean oil using a homogenizer at 1,100 rpm for 3 min at 25°C, then 1 ml of emulsion was diluted with 0.1% (w/v) sodium dodecyl sulfate (SDS) solution at a ratio of 1:25 (v/v). The absorbance of the emulsion was measured immediately after emulsion formation using UV-Visible spectroscopy at 500 nm and expressed as emulsion activity of protein. To determine the emulsion stability index, the emulsion was left at 25°C for 10 min, and then 1 ml of emulsion was diluted with 0.1% (w/v) SDS solution at a ratio of 1:25 (v/v) and the absorbance at 500 nm was measured. Emulsion stability index was calculated according to the following equation:

where A0 is the absorbance at 0 min and ΔA is the change in absorbance during the time interval; t (10 min).
Foaming properties. The foaming activity and foaming stability of the protein were determined according to the method described by Khuwijitjarusathe et al. (2007) with modifications. Twenty ml of 1% sample solution were transferred to a 100 ml beaker and the pH was adjusted to pH 2, 4, 6, 8 and 10. The solutions were homogenized at a speed of 16,000 rpm, using a homogenizer to incorporate the air for 2 min at room temperature. The whipped sample was immediately transferred into a 50 ml cylinder and the total volume was read within 30 s. The foaming activity was calculated according to the following equation:

where A is the volume of prepared foam (ml) and B is the volume of sample solution (ml).
Foaming stability was measured as the foam volume remaining after standing for 10 min and the value was calculated using the following equation:

where V0 is the initial foam volume at 0 min (ml) and ΔV is the change in the volume of foam during the time interval; t (10 min).
Statistical analysis
Minitab statistical software was used for regression and graphical analyses of the data. After the multifactorial analysis of variance and the 2nd order model prediction determinations, the optimum extraction conditions for obtaining the maximum values of the one response was obtained by the desirability function approach using Minitab. The response surface plots and surface plots were developed using Minitab. The statistical significance of the data from proximate composition analysis and protein functional properties determination was evaluated by the analysis of variance (ANOVA).
RESULTS
Proximate composition
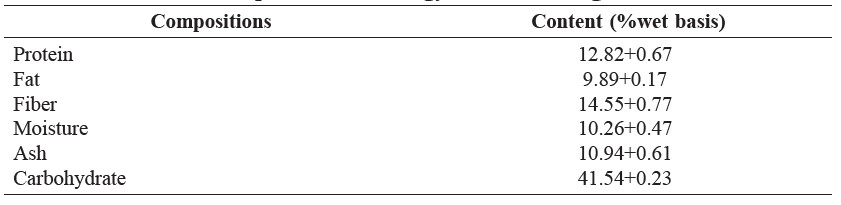
Proximate compositions of Sangyod Phatthalung de-oiled rice bran are shown in Table 2.
Table 2. Proximate compositions of Sangyod Phatthalung de-oiled rice bran.
Optimization of protein extraction from de-oiled rice bran
Experimental results of the 3-factor, 5-level central composite design are shown in Table 3. The response surface regression (RSREG) procedure for Minitab software was employed to fit the quadratic polynomial equation of the experimental data. Using least square regression, Minitab fit a full response surface model for every response investigated (including all linear, quadratic, and interaction terms); the model equation (7) is as follows:
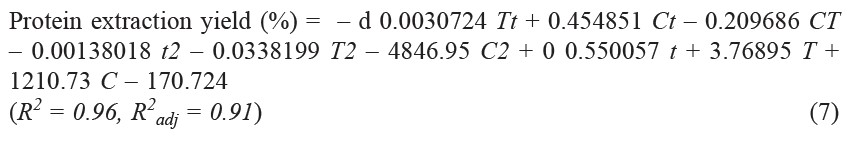
Where t = Time (min), T = Temperature (°C), and C = NaOH Concentration (M).
Table 3. Central composite design and experimental data of protein extraction from de-oiled Sangyod Phatthalung rice bran.
Conditions for optimum responses of protein extraction
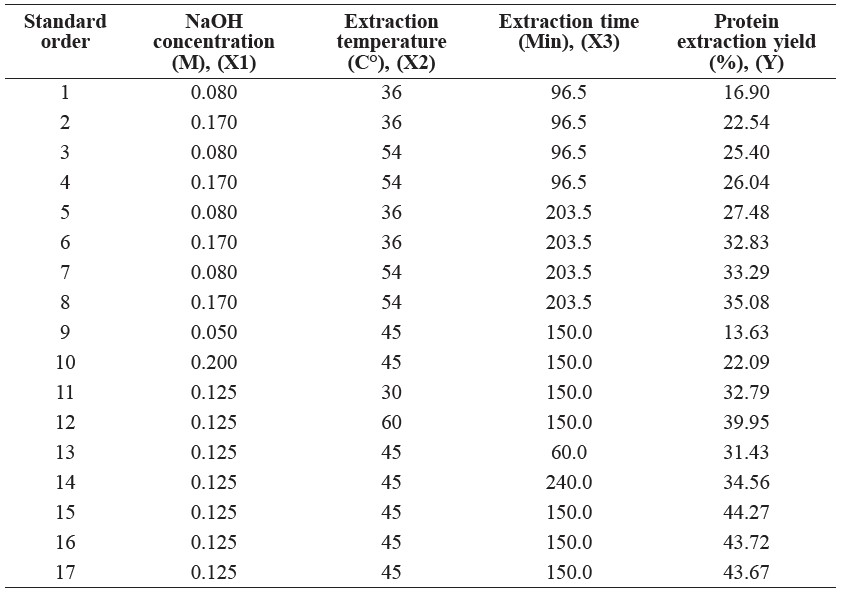
Protein extraction from Sangyod Phatthalung de-oiled rice bran was optimized using response surface methodology (RSM). The predicted responses under the optimum conditions were sodium hydroxide concentration of 0.13 M at an extraction temperature of 49°C for 170 min. The predicted responses for the selected condition gave a protein extraction yield of 45.2%. Figure 1 shows the response surface plots for the multiple response effects of three factors (sodium hydroxide concentration, extraction temperature and extraction time) on protein extraction yield. A verification experiment was also conducted under optimum conditions; the protein extraction yield was 43.1%.
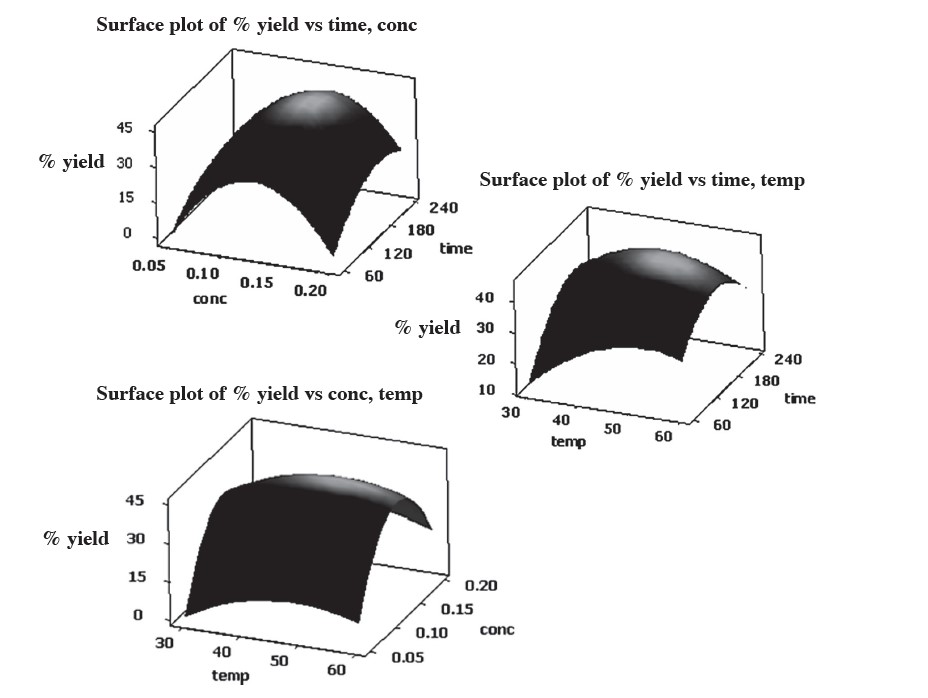
Figure 1. Response surface plots of interactive effects of sodium hydroxide concentration, extraction temperature and extraction time on protein extraction yield from Sangyod Phatthalung de-oiled rice bran.
Functional properties
Protein solubility. The results of protein solubility with various pH values are presented in Figure 2. The rice bran protein extract had a minimum protein solubility of 26.9% at pH 4. An increasing solubility was observed at either side of this pH. The maximum solubility was detected at pH 10 (68.3%).
Note: Mean values with different letters indicate the significant differences (p≤0.05).
Figure 2. Effect of pH value on the protein solubility (%) of Sangyod Phatthalung rice bran protein extract.
Emulsifying properties
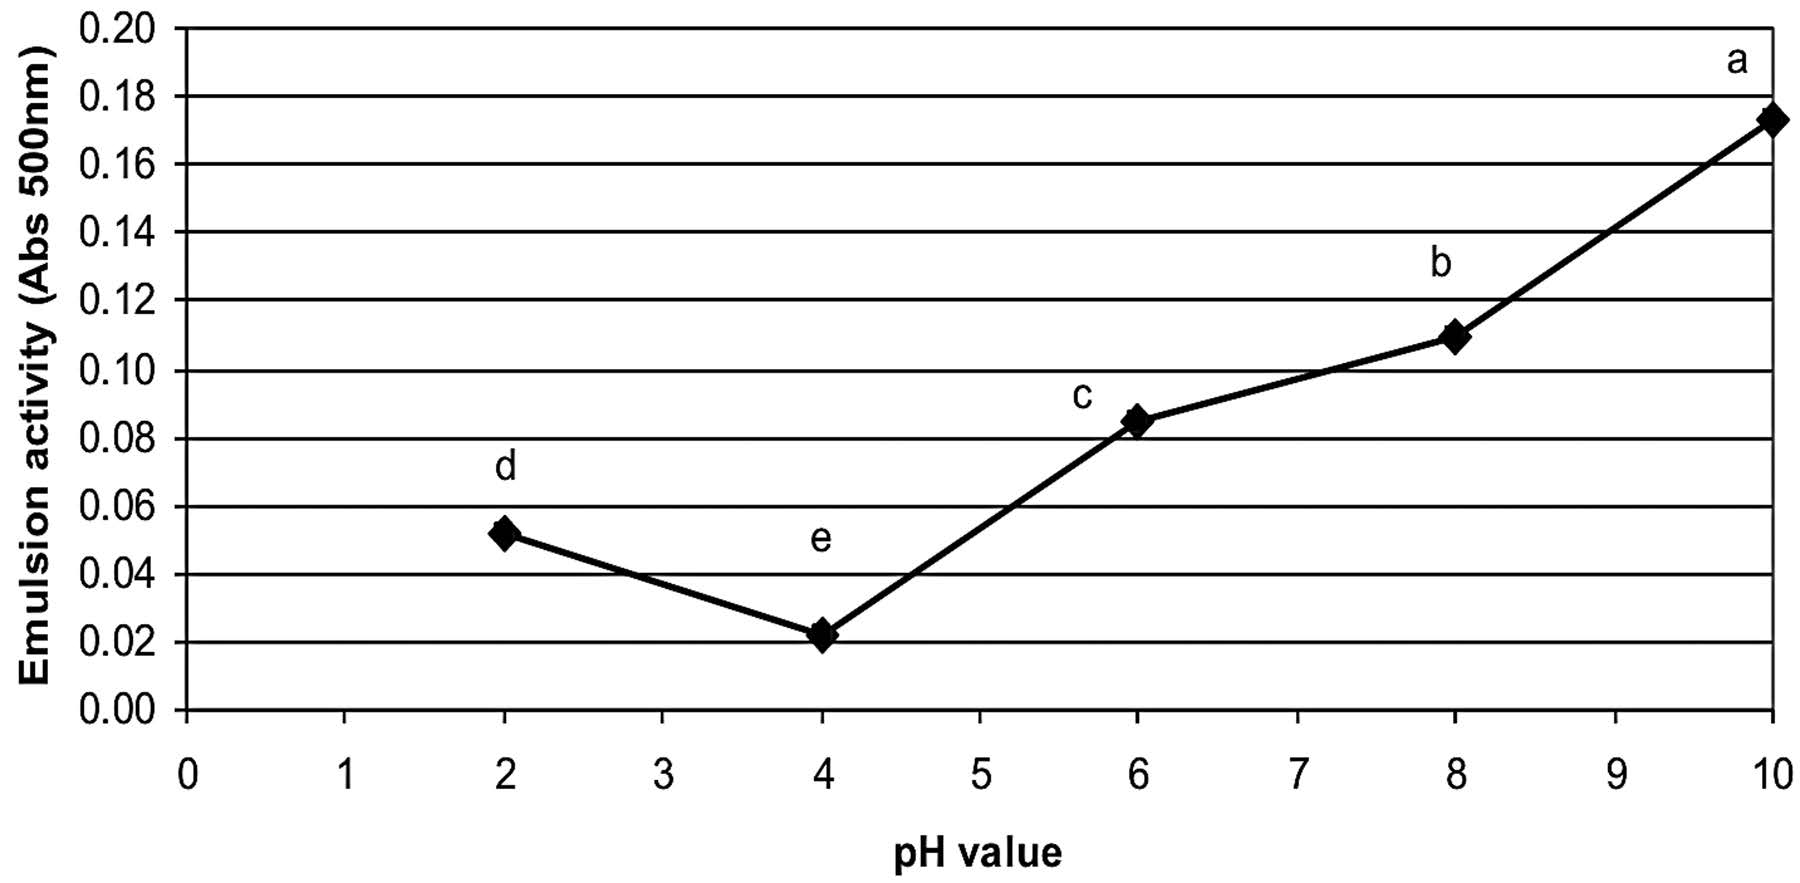
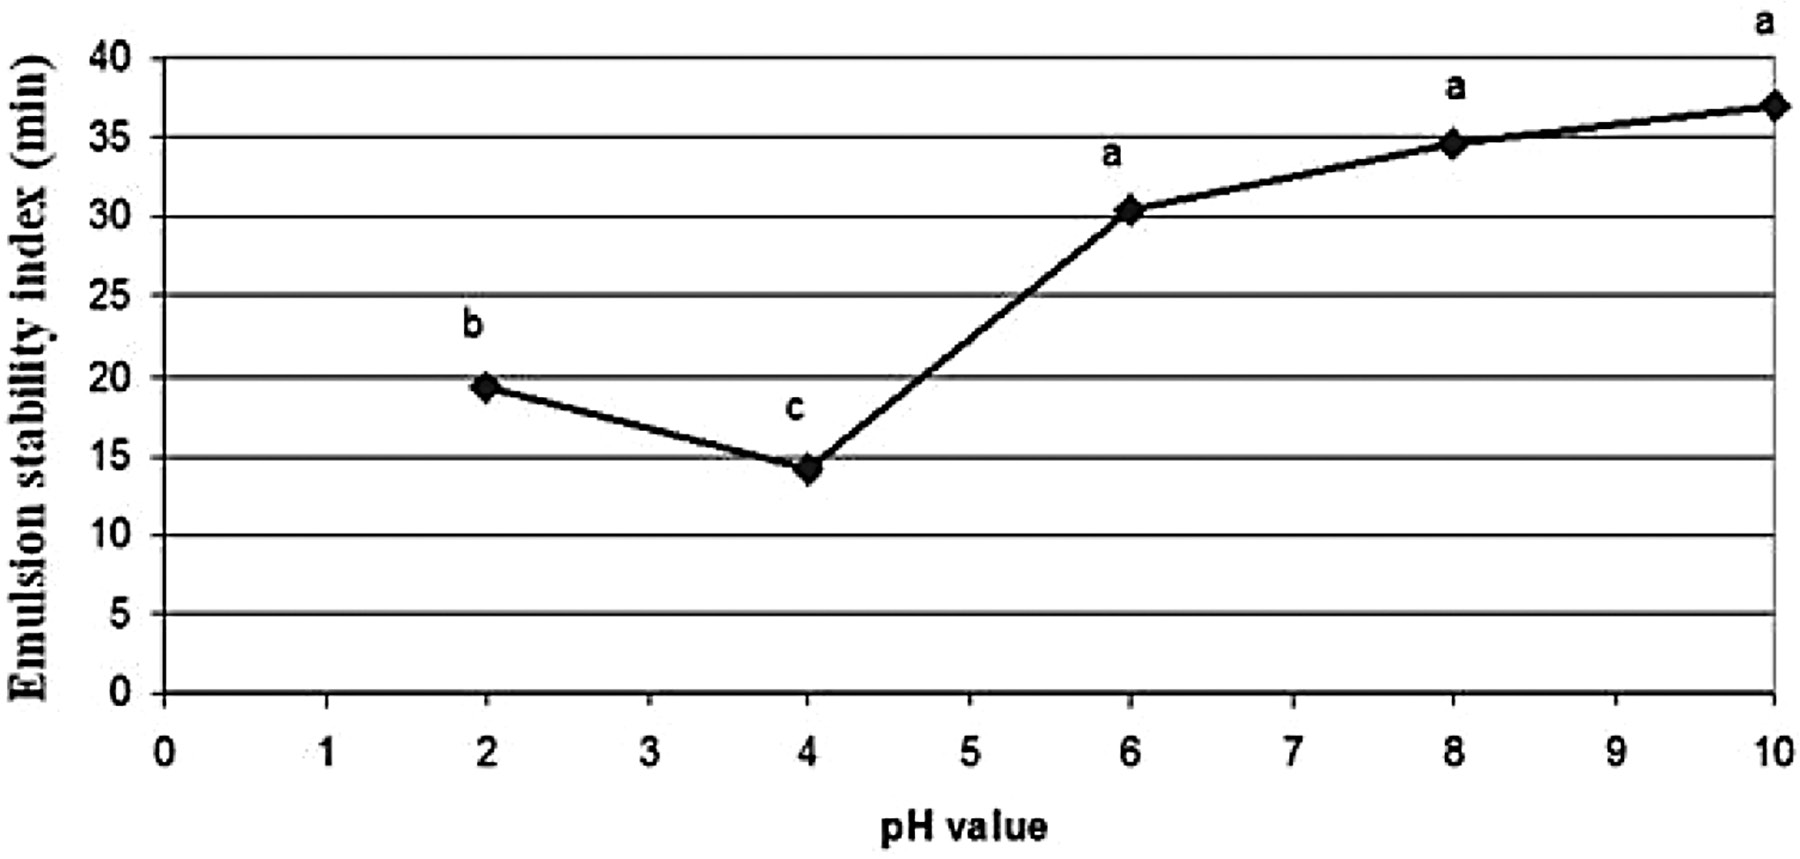
The emulsion activity index (EAI) and emulsion stability index (ESI) of rice bran protein extract as affected by pH values are shown in Figures 3 and 4, respectively. At pH 10, the protein extract had the highest emulsion activity and emulsion stability index with values of 0.17 (Abs500nm) and 37.1 min, respectively. At pH 4, the protein extract had the lowest emulsion activity and emulsion stability index with values of 0.02 (Abs500nm) and 14.1 min, respectively.
Note: Mean values with different letters indicate the significant differences (p≤0.05).
Figure 3. Effect of pH value on the emulsion activity (A 500nm) of Sangyod Phatthalung rice bran protein extract.
Note: Mean values with different letters indicate the significant differences (p≤0.05).
Figure 4. Effect of pH value on the emulsion stability index (min) of Sangyod Phatthalung rice bran protein extract.
Foaming properties
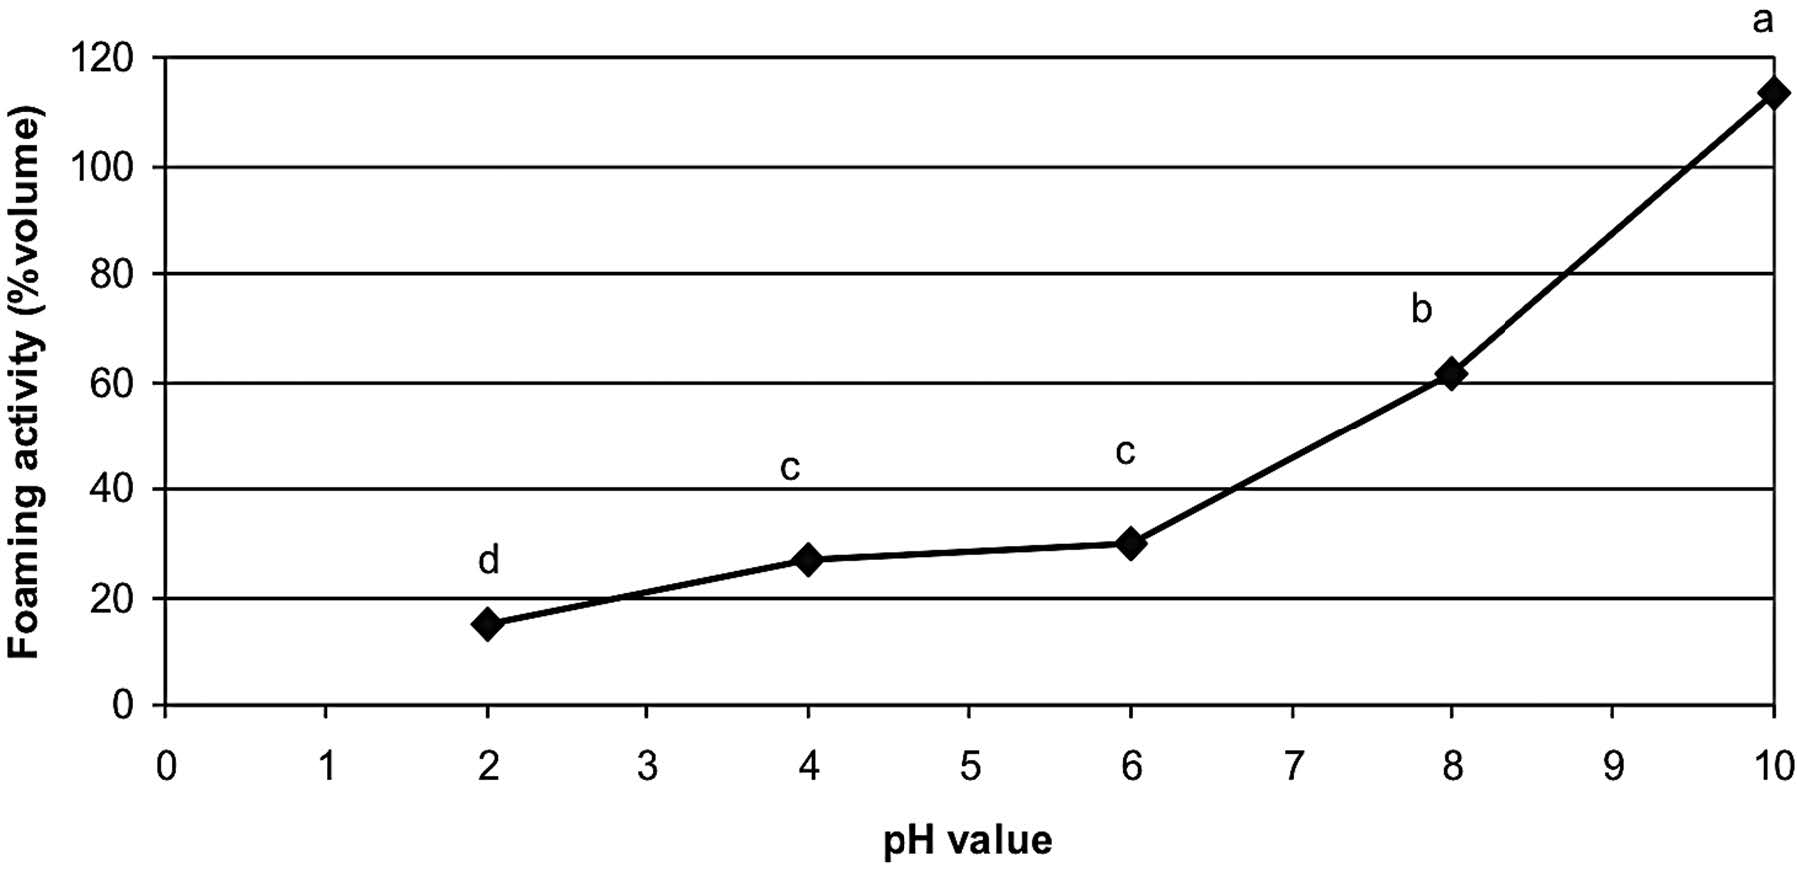
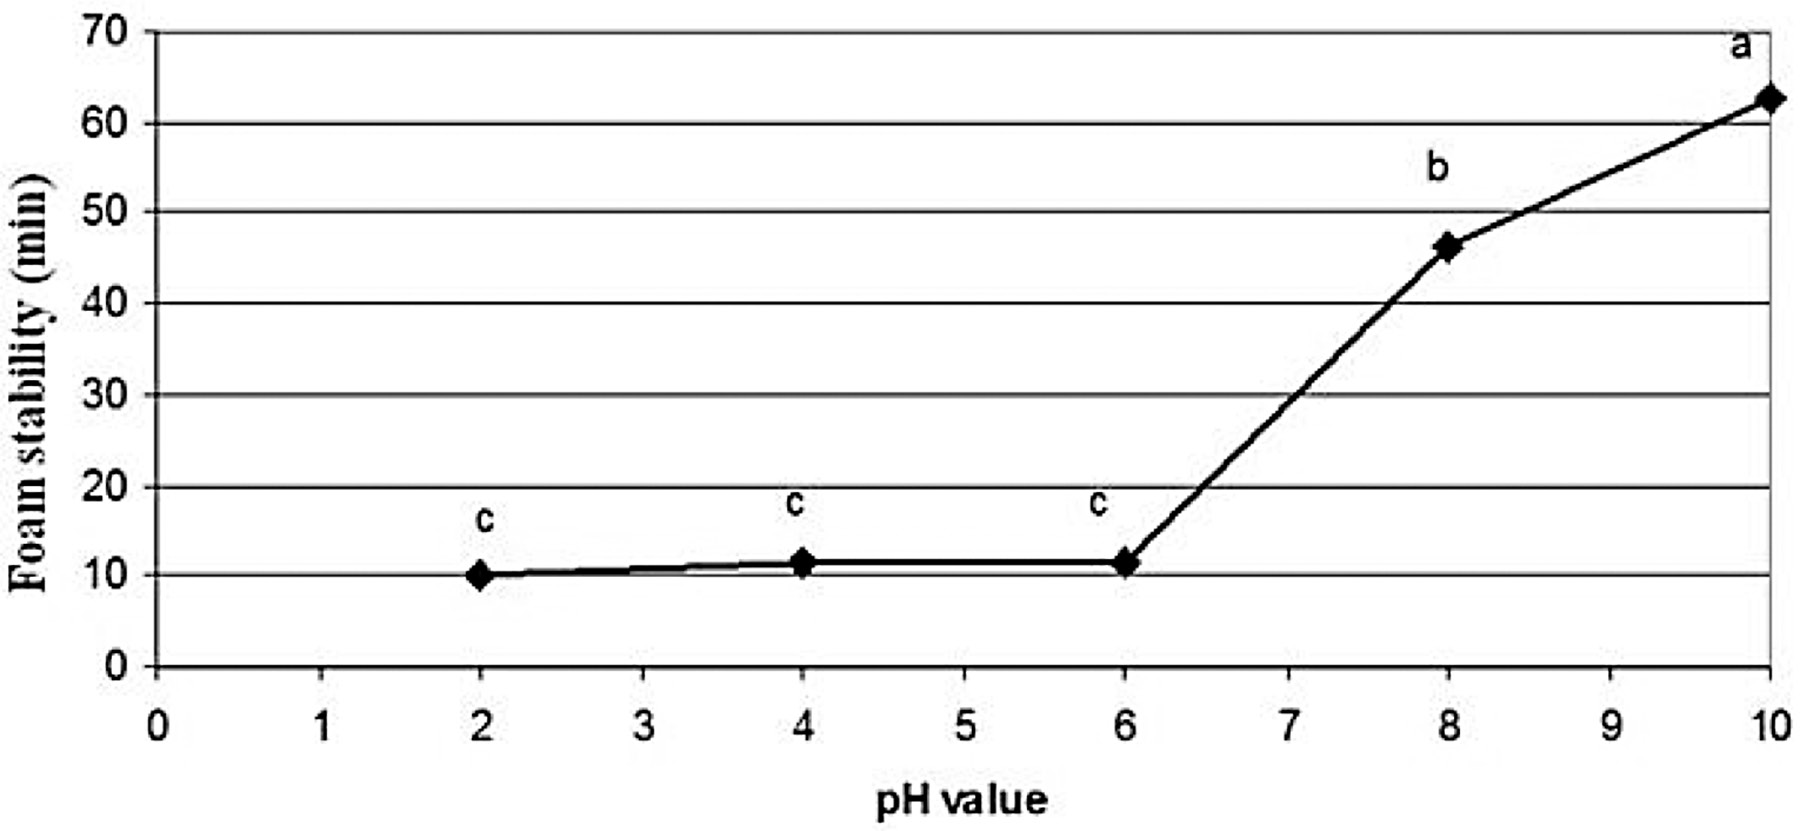
The foaming activities of rice bran protein extract as affected by pH values are depicted in Figure 5. The rice bran protein extract showed the highest foaming activity of 113.4% at pH 10 and the lowest of 15.0% at pH 2. The foaming activity at pH 2.0-10.0 significantly increased as pH increased (p≤0.05). The foam stability index of rice bran protein extract in the pH range of 2-10 is shown in Figure 6. The rice bran protein extract had the highest foaming stability index (62.6 min) at pH 10 and the lowest foaming stability index (10 min) at pH 2.
Note: Mean values with different letters indicate the significant differences (p≤0.05).
Figure 5. Effect of pH on the foaming activity of Sangyod Phatthalung rice bran protein extract.
Note: Mean values with different letters indicate the significant differences (p≤0.05).
Figure 6. Effect of pH on foam stability (min) of Sangyod Phatthalung rice bran protein extract.
DISCUSSION
The proximate composition of Sangyod Phatthalung de-oiled rice bran was in accordance with those reported by Sereewatthanawut et al. (2008). However, the fat content of the de-oiled Sangyod Phattalung rice bran was relatively high, indicating the inefficiency of oil extraction from the rice bran.
The results from optimizing the protein extraction from the de-oiled rice bran suggested that the protein extraction yield increased with increasing sodium hydroxide concentrations, extraction temperatures and extraction times (Table 3). The coefficient of determination (R2) from equation (7) was 0.96, indicating that the prediction model was suitable to represent the real correlation among the selected parameters. The value of R2 for the model equation of extraction yield was highly significant for the response surface. In addition, the experimental and predicted values of extraction yield were similar, confirming that the prediction model was capable of reasonably and accurately predicting the protein extraction yield.
The extracted rice bran protein had various functional properties. The solubility of the protein could be attributed to the net charge of peptides and surface hydrophobicity. The net charge of protein increases as pH moves away from pI, resulting in increasing solubility where surface hydrophobicity promotes the aggregation of protein via hydrophobic interaction (Sorgentini & Wagner, 2002). At pH 10, the higher solubility of protein from rice bran might be due to the increase in total negative charges in the protein molecules at that pH, which resulted in an increasing repulsing force and increasing interactions with water (Zayas, 1997). The emulsion property results of rice bran protein were closely related with protein solubility. Emulsion activity and emulsion stability index of rice bran protein were generally lower at acidic pH compared to alkaline pH. This might be due to better solubility properties of the protein at pH values far from the pI of protein (Mangino, 1994). The emulsification properties of the rice bran protein extract may also result from both soluble and insoluble proteins, as well as other components, such as polysaccharides. Protein can emulsify and stabilize the emulsion by decreasing surface tension of the oil droplet and providing electrostatic repulsion on the surface of the oil droplet (Tang, 2007).
Foaming is another functional property of protein. Foam is a colloid in which many gas bubbles are trapped inside a liquid or solid. Small air bubbles are covered by thin liquid films. Foam can be formed by whipping air into liquid as much and fast as possible. From the result, at pH 10 the rice bran protein extract had the highest protein solubility. The soluble proteins in the foam forming solutions reduced surface tension at the interface between air bubbles and the surrounding liquid, obstructing the coalescence of the bubbles. Furthermore, protein molecules can unfold and interact with other molecules nearby to form a multilayer protein film with an increased flexibility at the air-liquid interface. As a result, the air bubbles are more difficult to disrupt, and the foams are more stable (Adebowale and Lawal, 2003).
CONCLUSION
The optimum levels of NaOH concentration, extraction temperature and extraction time for protein extraction from de-oiled Sangyod Phatthalung rice bran were investigated using RSM. The predicted model equation provided a similar result to the experimental verification values. The protein yield extracted from Sangyod Phatthalung de-oiled rice bran was high. The functional properties of the rice bran protein were generally affected by pH.
ACKNOWLEDGEMENTS
The authors thank Chiang Mai University, Chiang Mai, Thailand for its financial support as well as the Faculty of Agro-Industry, Chiang Mai University for its budgetary grant.
REFERENCES
Adebowale, K. O., and O. S. Lawal. 2003. Foaming, gelation and electrophoretic characteristics of macuna bean (Macuna pruriens) protein concentrates. Food Chem. 83: 237-246.
AOAC. 2000. Official Methods of analysis (17th Ed). Washington, DC: Association of Official Analytical Chemists.
Barber, S., and C. Benedito de Barber. 1980. Rice bran: chemistry and technology. In Rice: Production and Utilization; Luh, B.S., Ed. AVI Publishing Co., Inc. Westport, CT. pp. 790-862.
Box, G. E. P., and K. B. Wilson. 1951. On the experimental attainment of optimum conditions. J. R. Stat. Soc. 13 : 1-45.
Edwards, I. M., and A. Jutan. 1997. Optimization and control using response surface methods. Comput. Chem. Eng. 21: 441-453.
Fabian, C., and Y. H. Ju. 2011. A review on rice bran protein: its properties and extraction methods. Crit. Rev. Food Sci. Nutr. 51: 816-827.
Gnanasambandam, R., and N. S. Hettiarachchy. 1995. Protein concentrates from unstabilized and stabilized rice bran: preparation and properties. J. Food Sci. 60: 1066-1069, 1074.
Khuwijitjaru, P., P. Nualchan, and S. Adachi. 2007. Foaming and emulsifying properties of rice bran extracts obtained by subcritical water treatment. Silpakorn Univ. Sci. Technol. J. 1: 7-12.
Kinsella, J., E. Frankel, B. German, and J. Kanner. 1993. Possible mechanisms for the protective role of antioxidants in wine and plant foods. Food Technol. 47: 85-89.
Klompong, V., S. Benjakul, D. Kantachote, and F. Shahidi. 2007. Antioxidative activity and functional properties of protein hydrolysate of yellow stripe trevally (Selaroides leptolepis) as influenced by the degree of hydrolysis and enzyme type. Food Chem. 102: 1317-1327.
Mangino, M. E. 1994. Protein interactions in emulsions: protein-lipid interactions. In Protein Functionality in Food System; Hettiarachchy, N. S. and Ziegler, G. R., Ed.; Marcel Dekker Inc. New York. pp. 147-180.
Rice department. Ministry of agriculture and cooperatives of Thailand. 2014. The global rice production and marketing. [Online] Available: http://www.ricethailand.go.th/home/images/rice_situation/56-57/Nov13.pdf (25 Jan 2014).
Sereewatthanawut, I., S. Prapintip, K. Watchiraruji, M. Goto, M. Sasaki, and A. Shotipruk. 2008. Extraction of protein and amino acids from deoiled rice bran by subcritical water hydrolysis. Bioresour. Technol. 99 : 555-561.
Sorgentini, D. A., and J. R. Wagner. 2002. Comparative study of foaming properties of whey and isolate soy bean proteins. Food Res. Inter. 35: 721-729.
Tang. C. H. 2007. Functional properties and in vitro digestibility of buckwheat protein: Influence of processing. J. Food. Eng. 82: 568-576.
Wang, M., N. S. Hettiarchchy, M. Qi, W. Burks, and T. Siebenmorgen. 1999. Preparation and functional properties of rice bran protein isolate. J. Agric. Food Chem. 47: 411-416.
Wongsagonsup, R., S. Shobsngob, B. Oonkhanond, and S. Varavinit. 2005. Zeta potential (ζ) analysis for the determination of protein content in rice flour. Starch. 57: 25-31.
Zayas J. F. 1997. Solubility of proteins. In Functionality of proteins in food. Springer-Verlag: Berlin Heidelberg. pp. 6-75.
Akkasit Jongjareonrak1,2*, Kannanuch Srikok1, Noppol Leksawasdi1 and Carlo Andreotti3
1 Faculty of Agro-Industry, Chiang Mai University, Chiang Mai 50100, Thailand
2 Lanna Rice Research Center, Chiang Mai University, Chiang Mai 50200, Thailand
3 Faculty of Science and Technology, Free University of Bozen-Bolzano, Pl 5, I-39100 Bozen Bolzano, Italy
*Corresponding author. E-mail: jakkasit@gmail.com
Total Article Views