 ISSN: 2822-0838 Online

Effects of Monosodium Glutamate on Pro-opiomelanocortin Gene Expression in Rat Pituitary Gland and AtT-20 Tumor Cells
Khomsorn Lomthaisong* and Anuwat WanthongPublished Date : 2019-08-24
DOI : 10.12982/CMUJNS.2015.0072
Journal Issues : Number 1, January- April 2015
ABSTRACT
Pro-opiomelanocortin (POMC) is a hormone precursor produced mainly in the hypothalamus and pituitary gland. In the pituitary, post-translational processing of POMC generates secretory peptide hormones – principally, the adrenocorticotrophic hormone. Previous studies showed that administration of monosodium glutamate (MSG) to neonatal rat induces several neuroendocrine, metabolic and behavioral abnormalities. The objective of this work was to evaluate the expression of POMC mRNA in the rat pituitary and AtT-20 tumor cells following MSG administration. It was found that POMC mRNA expression in the pituitary gland of MSG-treated rats increased dramatically to 50%, while expression in pituitary AtT-20 tumor cells was inhibited. The POMC mRNA expression in the treated groups was reduced by more than 50% at every concentration of MSG used, ranging from 25 μM to 1,600 μM. POMC derived peptide, gamma 1-MSH, was also reduced, corresponding to mRNA expression level. This result has demonstrated that MSG has different effects on POMC gene expression between pituitary gland and pituitary tumor cells. This suggests that MSG has a neuronal excitatory effect on pituitary functions that enhances POMC gene expression by increasing the stress input through the central nervous system in response to high doses of MSG treatment. In contrast, in vitro, MSG decreased POMC gene expression in pituitary tumor cells; this may be a result of an excitatory toxic effect of MSG on those cells.
Keywords: Monosodium glutamate (MSG), Pro-opiomelanocortin (POMC), Hypothalamic-pituitary axis (HPA-axis), gene expression
INTRODUCTION
Monosodium L-glutamate (MSG) is widely used as a food additive. Numerous studies have shown that glutamate is the main excitatory neurotransmitter in the central nervous system and is responsible for most fast synaptic neurotransmission (Fonnum 1984; Robinson and Coyle 1987; Michaelis 1998;Ali et al. 2000). The administration of high doses of MSG to neonatal rodents has induced anatomo-physiological disorders, which can be directly associated to several neuroendocrine, metabolic and behavioral abnormalities (Dolnikoff et al. 1988; Wong et al. 1997; Stricker-Krongrad, Burlet and Beck 1998; Sukhanov et al. 1999). Previous reports found that injection of glutamate as MSG at a dose of 4 mg/g body wt/day to young rats induced neurotoxicity and brain damage (Olney 1980; Breivik et al. 2001; Kiss et al. 2011). However, the neurotoxicity that resulted from administering high doses of MSG to neonatal rodents was involved in the coactions response of the nervous and endocrine system from the hypothalamus and pituitary (Ahluwalia and Malik 1989; Hirata et al. 2003).
Moreover, neonatal administration of MSG was also used for obesity modeling with impaired glucose tolerance and insulin resistance. The link between MSG and hypothalamic control of food intake has previously been reported (Veronika and Ostatnikova 2013). The effect of MSG-induced obesity was demonstrated in rats treated by subcutaneous injections of high doses of MSG. MSG affects energy balance by disrupting the hypothalamic-signaling cascade of leptin action. The links between leptin and feed regulating hormones located in hypothalamic neurons – such as neuropeptide Y (NPY), agouti-related peptide (AgRP) and pro-opiomelanocortin (POMC) – involved in obesity has already been documented (Millington 2007). However, the role of MSG on pituitary function regarding expression of the POMC gene has not been studied.
Pro-opiomelanocortin (POMC) is a 267-amino acid precursor protein that is mainly synthesized in the anterior pituitary and arcuate nucleus of the hypothalamus. The post-translational processing of POMC results in a number of peptide products with different biological activities (Corwin et al. 1992). In particular, adrenocorticotrophic hormone (ACTH) regulates adrenal function and glucocorticoid production to maintain body homeostasis (Ooi, Tawadros and Escalona 2004).
This research aims to evaluate the effect of MSG on POMC gene expression in both in vivo and in vitro models using semi-quantitative RT-PCR, real-time PCR and in-situ hybridization methods. Moreover, measurement of peptide products of the POMC gene, gamma 1-MSH, was also analyzed in the pituitary cell line.
MATERIALS AND METHODS
Animal management and tissue material
All experimental protocols were designed to minimize animal suffering and were carried out in accordance with the humane care and use of laboratory animal guidelines of Khon Kaen University. Wistar rats were used in this experiment. Before birth, their mothers were raised in a temperature (25±1°C) and light-controlled (lights on from 07.00 am to 07.00 pm) room with free access to food and water. The animals were kept one to a cage. Ten neonatal rats were given daily subcutaneous injections of MSG (4 mg/g body wt/day) for the treatment group or normal saline for the control group, for 15 days after birth. All MSG-treated and control animals were slaughtered at 30 days of age. The pituitary glands were gathered and preserved at -70°C until used.
Cell line maintenance
AtT-20 cells were cultured under aseptic conditions. Prior to treatment, AtT-20 cells were cultured in DMEM containing 10% FCS, 100 U/ml of penicillin, 100 μg/ml of streptavidin and 2 mM L-glutamine at 37°C and 5% (v/v) CO2 in a humidified incubator, until reaching the confluence stage. The medium was replaced with FCS-free medium and the cells were cultured overnight at 37 oC and 5% (v/v) CO2 before treatment. The next day the medium was replaced again with FCS-free medium containing MSG at various concentrations (two folds concentration) ranging from 25-1600 μM and then incubated for 1 h at 37°C and 5% (v/v) CO2. After treatment, cells were harvested by adding 0.5 ml of 0.05% trypsin-EDTA solution and centrifuged at 5,000 x g for cell collection.
RNA extraction
Total RNA from the dissected pituitary gland of rats and AtT-20 cells were isolated using illustraRNAspin Mini RNA isolation kit (GE Healthcare, USA), which included column RNase-free DNase treatment. The glands were broken up mechanically as well as lysed in an appropriate aliquot of buffer RA1 containing β-mercaptoethanol and mixed immediately, then filtrated through a RNA spin filter unit to reduce viscosity and remove the lysate. The homogenized lysate was combined with 70% ethanol and mixed by vortexing to adjust RNA binding conditions, and this was applied onto the RNAspin Mini column and centrifuged for 30 sec at 8,000 x g. The column was replaced in a new collection tube. Membrane desalting buffer was added to the column and then centrifuged at 11,000 x g for 1 min to dry the membrane. The flow-through was discarded and the column returned to the collection tube. The column was incubated with DNaseI solution for 15 min to digest DNA and washed first with buffer RA2 and then RA3 (provided in the kit). Highly pure RNA was eluted in nuclease free water and centrifuged for 1 min at 11,000 x g. The concentration and purity of the RNA samples were determined by UV spectroscopy at 260/280 nm, and integrity confirmed by electrophoresis through 1% agarose gels containing formaldehyde stained with ethidium bromide.
RNA analysis by semi-quantitative RT-PCR
Primers were designed based on the corresponding cDNA sequences from R. novegicusas as follows: β-actin sense (5’-CAACTGGGACGATATGGAGAA-3’) and β-actin antisense (5’-AGGAAGGAAGGCTGGAAGAG-3’) (product size 570 bp); POMC sense (5’-CCAGGCAACGGAGATGAAC-3’) and POMC antisense (5’-TCTCGGAGGTCATGAAGCC-3’) (product size 453 bp). Total RNA (1 μg) from pituitary gland or AtT-20 cells were heat denatured at 70 °C for 5 min and reverse transcribed by incubation of the reaction mixture containing 200U RevertAid™ M-MuLV RT (Fermentas, Canada), 40 U Ribonuclease inhibitor, 10 μM dNTP mixture and 250 ng of oligodT primers at 42°C for 60 min. The reactions were terminated by heating at 70°C for 10 min and chilling on ice. The cDNA was used as templates for semi-quantitative PCR analysis. The numbers of cycles were optimized to ensure an amplification of PCR product in the exponential phase. PCR reactions were performed using illustra Hot Start Master Mix (GE Healthcare, UK) and the appropriate primer pairs (1 μM of each primer). PCR featured for a first activation and denaturing cycle at 95°C for 5 min, followed by 30 cycles consisting of 20 sec at 95°C for denaturation, 20 sec at 60°C for annealing and 40 sec at 72°C for extension. A final extension cycle of 72°C for 7 min was included. PCR products were further analyzed by agarose gel electrophoresis. Ethidium bromide intensities in each band resulting from PCR amplification were analyzed using image analysis software (Quantity One, Bio-Rad Laboratories, USA). Data are expressed as means±SEM from at least three independent experiments performed on RNA preparations. mRNA levels of POMC were calculated as the ratio to that of β-actin in each sample. Statistical analysis was performed using a paired T test. Differences were considered significant at P < 0.05.
POMC transcript analysis in AtT-20 cells using real-time PCR
Quantification Real-time PCR was performed to quantify POMC mRNA level using an ABI PRISM7700 system (Applied Biosystems, USA). We used POMC-forward primer 5’-GGTGAAGGTGTACCCCAACG-3’ and POMC-reverse primer 5’-GCCGCTCGCCTTCCA-3’ together with 5’-FAM-TCGGCGGAGGCCTTTCCCCT-3’ as TaqManprobe. 18S ribosomal RNA amplification was used as internal control for experiments. Amplification mixtures (50 μl) contained 1 X TaqMan buffer, 200 μM dNTPs, 5.5 mM MgCl2, 300 nM each primer, 175 nMTaqMan probe and AmpliTaq Gold (0.025U/μl).
Determination of gamma 1-MSH using ELISA
POMC derived peptide, gamma1-MSH level expressed in AtT-20 cells was determined using Enzymatic-Linked Immunosorbent Assay (ELISA). ELISA was carried out to quantify POMC-derived peptide, gamma1-MSH (N-POMC 1-28) using rabbit anti-N-POMC 1-28 antibody. Crude protein was prepared from the cells and culture medium (approx. 5000 cells/well). The total protein amount of 1 mg was coated on microtiter plate and placed at 4°C overnight. Next, plates were rinsed with TBST to remove weakly bound peptides and blocked with 100 μl of 5% skimmed milk in TBST and placed at 37°C for 1 hr. The blocking solution was discarded and the plate was washed three times with TBST to ensure that the skimmed milk was removed. The washed plate was then incubated with rabbit anti-N-POMC 1-28 at 37°C for 1 hr. The washing step was repeated and the plate was then incubated at 37°C for 1 hr with the secondary antibody against rabbit antibody linked with alkaline phosphatase. After that, the antibody was discarded and the plate was washed three times with TBST and another three times with TBS to remove TWEEN-20. The detection was performed using freshly prepared chromogenic substrate (1 mg/ml of p-nitrophenyl phosphate, 100 mMTris–HCl, pH 9.5, 100 mM NaCl and 50 mM MgCl2). The absorbance of colorimetric products was determined at 405 nm using an ELISA plate reader.
In situ hybridization
AtT-20 cells were grown on slice to 40-50% confluence (normally for about 48 hr) and then treated with 400 μM MSG for 1 hr. Cultured cells were washed twice with HBSS solution before being fixed in 4% paraformaldehyde in phosphate buffered saline. In hybridization, cells were washed and dehydrated in an ethanol series (70%, 95% and 100% ethanol) for 3 min each, delipidated in chloroform, and then rehydrated in an ethanol series (100%, 95% and 70% ethanol) for 3 min each. To block non-specific binding, the cells were prehybridized in prehybridization buffer (50% formamide, 40 ng of salmon sperm DNA and 5xSSC). The slides were then hybridized in hybridization buffer containing either sense or antisense riboprobes at different probe concentrations ranging from 1 in 250, 1 in 500 and 1 in 1000 dilution (equivalent to 1 μg/ml, 500 ng/ml and 250 ng/ml, respectively). Hybridization was carried out at 55°C for at least 24 hr.
After hybridization, slides were washed in 5xSSC and incubated with RNase A for 30 min in RNase-free buffer. Subsequently, slides were washed with 5xSSC at room temperature for 30 min and at 55°C for 30 min and then washed with 0.1xSSC at 55°C for 30 min. Next, the slides were blocked with blocking buffer for 2 hr before being incubated with sheep anti-digoxigenin conjugated to horse radish peroxidase (HRP) (Sigma-Aldrich, USA), then washed with buffer I. The signal detection was performed using the tyramind amplification system, TSAtm-Directed (Red) kit (NEN® Life Science, USA) to detect digoxigenin-11-dUTP in riboprobes. Tetramethylrhodaminetyramide (TMR) was activated by peroxidase, providing the deposition of red fluorescence. The slides were washed in TNT buffer for 15 min three times, and incubated in TMR solution for 10 min at room temperature. Slides were then washed again in TNT buffer for 3x15 min and in TE buffer for 15 min prior to counter staining with the nuclear stain TOTO-3 (Molecular Probes, USA). The slides were visualized using a confocal microscope.
The cells were then scanned at 570/30 nm band-pass emission filter for the TRITC and at 660 nm long-pass for TOTO-3 using image-acquiring software from Leica TCN-NT software. Initial scanning was performed at the medium scanning speed with laser intensity at 50% in order to minimize photobleaching of the sample before image acquisition. The photomultiplier tube was optimized for intensity of the signal in order to obtain the best photographic resolution. Images were multiple colored using Adobe Photoshop version 6.0 (Adobe Corporation, USA) photographic software. The red fluorescence obtained from the emission of TMR was normally altered to pseudo-green fluorescence, while the red fluorescence obtained from nuclei staining from TOTO-3 remained red, with the original fluorescent intensity.
RESULTS
The effect of MSG on POMC mRNA expression in neonatal rats was evaluated by using semi-quantitative RT-PCR analysis. POMC mRNA significantly increased in the pituitary gland of MSG-treated rats compared to the control group, as shown in Figure 1A. The expression level of POMC mRNA was statistically significant, as demonstrated by semi-quantitative RT-PCR analysis when using template cDNA dilution at 1:1,000, 1:10,000 and 1:100,000 respectively (p<0.05, n=3), shown in Figure 1B. POMC mRNA up-regulated by up to 50% with MSG-treatment compared to control.
On the other hand, when AtT-20 cells were directly treated with MSG, and the expression level of POMC mRNA was evaluated by quantitative real-time RTPCR, MSG had an inhibitory effect on expression of POMC mRNA. As shown in Figure 2, POMC transcripts significantly decreased by up to 50% in AtT-20 cells following MSG treatment compared to untreated cells (p< 0.05, n=3). In addition, when considering the level of gamma 1-MSH, a POMC-derived peptide product, gamma 1-MSH peptide correlated with POMC mRNA level, as shown by quantitative radioimmuno assay (Figure 3). Gamma 1-MSH expression decreased by more than 50% in cells following MSG treatment at every concentration used. The result demonstrates that MSG affected AtT-20 cells on POMC expression at both levels of gene and protein expression.
In situ hybridization was also used to investigate levels of POMC mRNA expression locally in MSG-treated and normal AtT-20 cells. As shown in Figure 4, the fluorescence was found mostly in cytoplasm of control cells, whereas smaller amounts were found in MSG-treated cells. From the result, the level of fluorescence TMR dramatically reduced in MSG-treated cells (at a MSG concentration of 400 μM), indicating a reduction of POMC mRNA level in the MSG-treated
group. In situ hybridization demonstrated a similar result, observed by quantitative real-time PCR analysis of POMC gene expression in AtT-20 cells.
DISCUSSION
This research has demonstrated the different effects of MSG on POMC gene expression in neonatal rat pituitary and pituitary cells, AtT-20 line. The results showed that receiving high doses of MSG in the neonatal period caused increased pituitary output by increasing production of POMC mRNA. The up-regulation of POMC mRNA increased to 50% following MSG administration as demonstrated by semi-quantitative RT-PCR. This finding suggests that an increase in POMC mRNA expression would be a result of the stress response mechanism of the animal body through HPA-axis regulation. An increase of POMC transcripts in the pituitary gland will cause increased ACTH production and secretion (Robinson and Coyle 1987; Dolnikoff et al. 1988; Ahluwalia and Malik 1989). ACTH stimulates adrenal cortex activity to synthesized steroid hormones including glucocorticoids, mainly cortisol in animals (Ooi et al. 2004; Hammer and Stewart 2006). Miskowiak and Partyka (2000) studied the effect of subcutaneous injections of MSG on pituitary weight in neonatal rats. Michaelis (1998) and Ali et al. (2000) also demonstrated the neuronal toxicity of MSG, which caused stress and increased pituitary activity that raised POMC mRNA. Therefore, a rising of POMC expression in the pituitary gland in response to MSG stimulation may also cause over-activation of adrenal glands (Breivik et al. 2001; Jezova 2005; Howell and Muglia 2006).
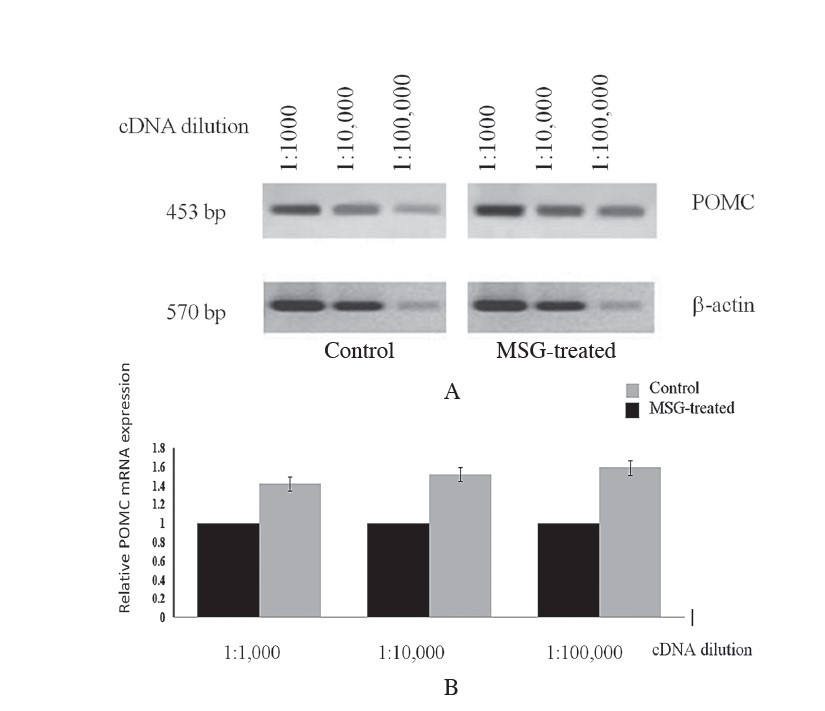
Figure 1. A) Analysis of semi-quantitative RT-PCR demonstrated POMC mRNA expression following MSG-treatment. Amplification was performed using 10-fold serial dilutions of cDNA templates. Representative images of 1.5% agarose gels stained with ethidium bromide indicate the amplified fragments for POMC at 453 bp. cDNA quantity extracted from both animal groups were normalized to the amount of β-actin cDNA. B) Relative gene expression level demonstrated by the ratio of cDNA content of MSG-treated to control rats. Mean SEM; (n = 3). *P< 0.05 vs the corresponding band intensity in MSG-treated animal.
However, an in vivo study found a different effect of MSG on the pituitary cell line. According to in vitro study, MSG has an inhibitory effect on POMC gene expression as demonstrated by quantitative real-time PCR, radioimmuno assay of gamma-1 MSH and in situ hybridization. The reduction in POMC expression could be a result of the neurotoxic effect of MSG on the cells. This will eventually target the cells, leading to apoptosis or cell death. It is possible that MSG had excitatory toxic effects on the cells, and led to changes in abnormal activity of AtT-20 cells. The excitatory effect of MSG causing cell death was thoroughly described by Gonzalez-Burgos et al. (2001).
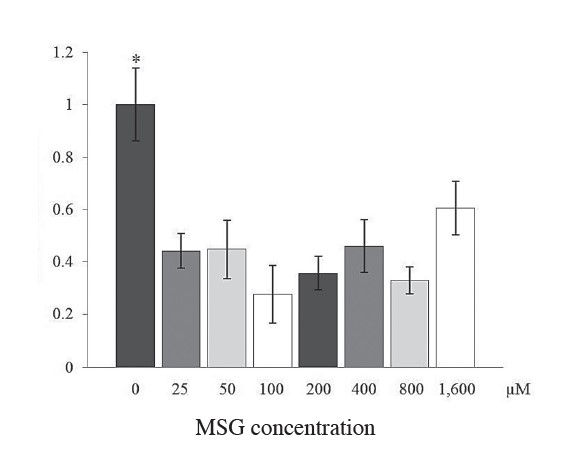
Figure 2. Effect of MSG treatment on POMC mRNA expression in AtT-20 cell line. POMC mRNA level was normalized against 18S ribosomal RNA. The results demonstrate that POMC mRNA expressed within the cells with no MSG-treatment is significantly higher (*P<0.005) (n = 3) than those cells treated with MSG at various concentrations (ranging from 25-1600 μM). Statistical analysis was performed by the student T-test.
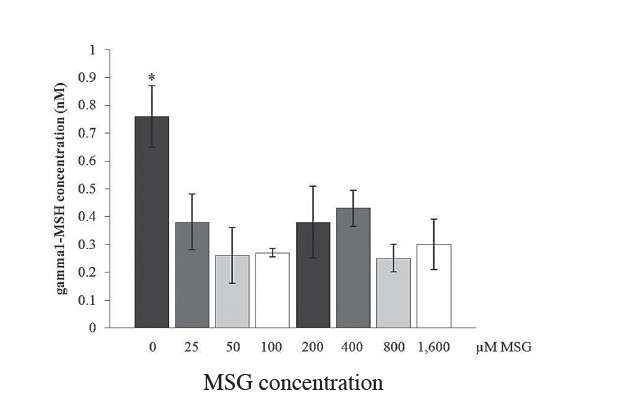
Figure 3. Effect of MSG treatment on POMC derived peptide, gamma1-MSH in AtT-20 cell line. Gamma1-MSH level is measured using ELISA. The result showed that Gamma1-MSH within the cells with no MSG-treatment is significantly higher (*P<0.005) (n = 3) than those cells treated with MSG at various concentrations (ranging from 25-1600 μM). Statistical analysis was performed by the student T-test.
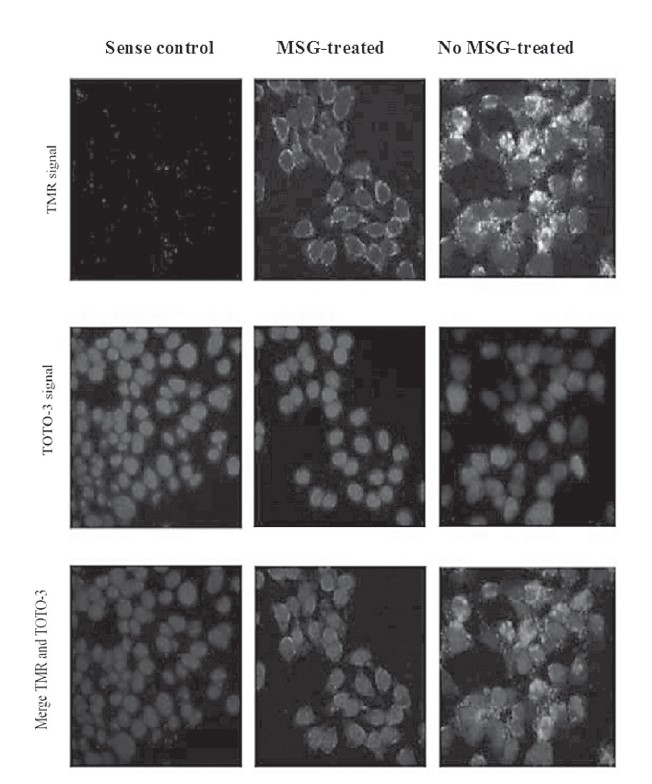
Figure 4. Confocal photographic images demonstrate the expression of POMC mRNA in the AtT-20 cells following MSG treatment. The POMC mRNA that located in cytosolic part of cells is indicated by green fluorescence (TMR), while nuclei are stained red (TOTO-3). The control AtT-20 cells were hybridized with sense riboprobe. In situ hybridization shows lower production of POMC mRNA in MSG-treated AtT-20 cells compared to the cells that were untreated with MSG.
When the body has been exposed to stressful conditions, neurosecretory cells in the hypothalamus are stimulated by nerve impulses from the higher brain center to produce more corticotrophin releasing hormone (CRH), stimulating pituitary activity (Heuser and Lammers 2003). This released hormone drives greater secretion of ACTH from the anterior pituitary, and cortisol from the adrenal glands, respectively. Cortisol concentration is provided at a higher level until the cause of stress has decreased (DeVries et al. 1997). Thus, up-regulation of POMC gene expression would result in over production of ACTH and secretory products of POMC. Administration of MSG has caused indirect effects and provided complexity of MSG activation mechanism through neurosecretory cells in the HPA-axis.
The difference in POMC expression following MSG treatment between in vivo and in vitro study was not surprising as the regulation of POMC expression in the pituitary gland was influenced by signals from the upstream level, hypothalamus, and also negative feedback regulation of cortisol from the downstream organ, adrenal gland (Watson and Mackin 2006). The effect of MSG in the animal is far more complicated than in the directly treated cells. When MSG is injected subcutaneously, it will distribute throughout the whole body, including the brain. This event will cause an increase in pituitary activity to produce more POMC mRNA expression.
In conclusion, the results of this work demonstrated that MSG has different effects on POMC gene expression in the rat pituitary and pituitary cell line, AtT-20. POMC mRNA expression in the pituitary gland was found to be up-regulated, while in pituitary tumor cells it was inhibited following MSG administration. These results indicate that pituitary response to the MSG administration is through the stress response mechanism. Whereas in cell lines, MSG inhibited an expression of POMC mRNA and caused cell death as a result of the excitatory effect of MSG on the cells. In addition, it can be inferred that high levels of MSG consumption should be avoided, as this food additive can cause stress and other neurotoxic effects on the body.
ACKNOWLEDGEMENTS
This work was financially supported by the Thailand Research Fund grant No. MRG4680198 and partially by the Faculty of Science, Khon Kaen University.
REFERENCES
Ahluwalia, P., and V. Malik. 1989. Effects of monosodium glutamate on serum lipids, blood glucose and cholesterol in adult male mice. Toxicology Letters 45: 195-198. DOI: 10.1016/0378-4274(89)90009-X
Ali, M. M., M. Bawari, U. K. Misra, and G. N. Babu. 2000. Locomotor and learning deficits in adult rats exposed to monosodium-L-glutamate during early life. Neuroscience Letters 284: 57-60. DOI: 10.1016/S0304-3940(00)00958-7
Breivik, T., P. S. Thrane, P. Gjermo, and F. Fonnum. 2001. Postnatal glutamate-induced central nervous system lesions alter periodontal disease susceptibility in adult Wistar rats. Journal of Clinical Periodontology 28:904-909.
Corwin, R. L., E. S. Corp, J. Gibbs, and G. P. Smith. 1992. Decreased behavioral effects of daily intracerebroventricular bombesin. Peptides 13: 1215-1218. DOI: 10.1016/0196-9781(92)90031-W
DeVries, A. C., J. M. Gerber, H. M. Richardson, C. A. Moffatt, G. E. Demas, S. E. Taymans, and R. J. Nelson. 1997. Stress affects corticosteroid and immunoglobulin concentrations in male house mice (Mus musculus) and Prairie voles (Microtus ochrogaster). Comparative Biochemistry and Physiology 118A: 655-663. DOI: 10.1016/S0300-9629(97)87355-0
Dolnikoff, M. S., C. E. Kater, M. Egami, I. S. de Andrade, and M. R. Marmo. 1988. Neonatal treatment with monosodium glutamate increases plasma corticosterone in the rat. Neuroendocrinology 48: 645-649.
Fonnum, F. 1984. Glutamate: A neurotransmitter in mammalian brain. Journal of Neurochemistry 42: 1-11.
Gonzalez-Burgos, I., M. I. Perez-Vega, and C. Beas- Zarate. 2001. Neonatal exposure to monosodium glutamate induces cell death and dendritic hypotrophy in rat prefrontocortical pyramidal neurons. Neuroscience Letters, 297(2): 69-72. DOI: 10.1016/S0304-3940(00)01669-4
Hammer, F., and P. M. Stewart. 2006. Cortisol metabolism in hypertension. Best Practice & Research: Clinical Endocrinology 20: 337-353. DOI: 10.1016/j.beem.2006.07.001
Heuser, I., and C. H. Lammers. 2003. Stress and the brain. Neurobiol Aging. 24: S69-S76. DOI: 10.1016/S0197-4580(03)00048-4
Hirata, A. E., F. Alvarez-Rojas, Carvalheira JBC, C. R. O. Carvalho, M. S. Dolnikoff, and M. J. A. Saad. 2003. Modulation of IR/PTP1B interaction and downstream signaling in insulin sensitive tissues of MSG-rats. Life Sciences 73: 1369-1381. DOI: 10.1016/S0024-3205(03)00477-6
Howell, M. P., and L. J. Muglia. 2006. Effects of genetically altered brain glucocorticoid receptor action on behavior and adrenal axis regulation in mice. Front Neuroendocrin 27: 275-284. DOI: 10.1016/j.yfrne.2006.05.001
Jezova, D. 2005. Control of ACTH secretion by excitatory amino acids. Endocrine 28: 287-293. DOI: 10.1385/ENDO:28:3:287
Kiss, P., T. Atlasz, K. Szabadfi, G. Horvath, M. Griecs, J. Farkas, A. Matkovits, G. Toth, A. Lubics, A. Tamas, R. Gabriel, and D. Reglodi. 2011. Comparison between PACAP- and enriched environment-induced retinal protection in MSG-treated newborn rats. Neuroscience Letters. 487: 400-405. DOI: 10.1016/j.neulet.2010.10.065
Michaelis, E. K. 1998. Molecular biology of glutamate receptors in the central nervous system and their role in excitotoxicity, oxidative stress and aging.Progess
in Neurobiology 54: 369-415. DOI: 10.1016/S0301-0082(97)00055-5
Miskowiak, B. and Partyka, M. 2000. Neonatal Treatment with Monosodium Glutamate (MSG): Structure of the TSH Immunoreactive Pituitary Cells. Histol. Histopathol. 15(2): 415-9.
Olney, J. W. 1980. Excitatory neurotoxins as food additives: an evaluation of risk. Neurotoxicolog 2: 153-192.
Ooi, G. T., N. Tawadros, and R. M. Escalona. 2004. Pituitary cell lines and their endocrine applications. Molecular and Cellular Endocrinology 228: 1-21. DOI: 10.1016/j.mce.2004.07.018
Robinson, M. B., and J. T. Coyle. 1987. Glutamate and related acidic excitatory neurotransmitters: from basic science to clinical application. FASEB 1: 446-455.
Stricker-Krongrad, A., C. Burlet, and B. Beck. 1998. Behavioral deficits in monosodium glutamate rats: specific changes in the structure of feeding behavior. Life Sciences 62: 2127-2132. DOI: 10.1016/S0024-3205(98)00187-8
Sukhanov, S. N., I. S. de Andrade, M. S. Dolnikoff, and A. T. Ferreira. 1999. Neonatal monosodium glutamate treatment alters rat intestinal muscle reactivity to some agonists. European Journal of Pharmacology 386: 247-252. DOI: 10.1016/S0014-2999(99)00751-7
Veronika H., and O. Daniela. 2013. Monosodium Glutamate Toxic Effects and Their Implications for Human Intake: A Review. JMED Research, Vol. 2013 (2013), 12 pages.
Watson, S., and P. Mackin. 2006. HPA axis function in mood disorders. Psychiatry 5: 166-170. DOI: 10.1383/psyt.2006.5.5.166
Wong, P. T., L. H. Neo, W. L. Teo, H. Feng, Y. D. Xue, and W. H. Loke. 1997. Deficits in water escape performance and alterations in hippocampal cholinergic mechanisms associated with neonatal monosodium glutamate treatment in mice. Pharmacology Biochemistry and Behavior 57: 383-388. DOI: 10.1016/S0091-3057(96)00338-3
Khomsorn Lomthaisong1* and Anuwat Wanthong2
1 Department of Biochemistry, Faculty of Science, Khon Kaen University, Khon Kaen 40002, Thailand
2 Department of Biology, Faculty of Science, Mahasarakham University, Mahasarakham 44150, Thailand
*Corresponding author. E-mail: kholom@kku.ac.th
Total Article Views