 ISSN: 2822-0838 Online

Maternal Genetic History of the Mon in Thailand
Jatupol Kampuansai, Metawee Srikummool, Pittayawat Pittayaporn and Wibhu Kutanan*Published Date : 2019-08-23
DOI : 10.12982/cmujns.2016.0014
Journal Issues : Number3 ,September - December 2016
ABSTRACT
Multiple studies based on the archaeology and anthropology of the Mon in Thailand have been reported, but little is known about their genetic history. The present study investigated polymorphisms in the hypervariable region I of mitochondrial DNA (mtDNA) in 112 new Mon samples from central and western Thailand, and then compared them with previous mtDNA data from modern Mon and ancient Mon, or Nyah Kur, from northern and northeastern Thailand. The Mon from western Thailand showed the highest genetic diversity, reflected by the haplotype diversity and number of polymorphic sites. Demographic expansion parameters and the Bayesian sky plot analysis indicated that almost all Mon populations, with the exception of the northeastern Thai Mon, have had constant population sizes or have continuously incremented over time, until reductions around 5,000 to 1,000 years ago. The multidimensional scaling plot and neighbor joining tree revealed the closest genetic relatedness between the central Thai Mon from Ratchaburi province and northeastern Thai Mon, indicating a likely common genetic ancestry. The other Mon populations had diverged genetically, perhaps driven by genetic admixture with different population sources. Interestingly, a genetic distinction between the Mon and Nyah Kur was detected, reflecting different genetic stocks between the modern and ancient Mon. Therefore, future studies of haplogroup lineages from the complete mtDNA genome and Y chromosome could elucidate a deeper and broader picture of the Mon’s genetic history.
Keywords: Mon, Mitochondrial DNA, Hypervariable region I, Genetic relationship
INTRODUCTION
The Mon are descendants of an ancient Austroasiatic-speaking people whose civilization existed in a large part of mainland Southeast Asia, with centers in the present-day southern Myanmar and central Thailand, before the rise of Thai and Burmese kingdoms (Guillou, 1999; Saraya, 1999). In Myanmar, ethnic Mon are currently concentrated in Mon and Karen States, as well as the divisions of Tenasserim and Pegu. They are remnants of a much larger distribution that included most of the Irrawaddy River Delta, which was the center of the highly developed civilization that fell to the Burmese in the 18th century A.D. (Pon Nya, 2001). In Thailand, Mon communities are found in a number of locations in the central region and surrounding areas. However, they are not successors of the Dvaravati civilization that flourished on the western bank of the Chao Phraya valley in the central plain during the 6th to 7th century A.D., but are descendants of several waves of political refugees that fled Myanmar during the 16th to 19th centuries A.D. (Ocharoen, 1998). On the other hand, remnants of the ancient Mon population of Dvaravati are now considered a distinct ethnic group known as the Nyah Kur, or the Chaobon. Nyah Kur communities are currently found in hilly areas along the border between central and northeastern Thailand. They speak a Monic language that is considered a direct descendant of the old Mon language of Dvaravati (Diffloth, 1984; Huffman, 1990).
Despite a substantial understanding of the linguistic and archaeological background of the Mon and the Nyah Kur, little is known about their genetic structure. A non-identical demographic structure between males and females of the northern Thai Mon has been observed. Although a closer maternal relatedness to the Kra-Dai people than to Austroasiatic speakers was reported, the opposite trend was observed in the paternal lineages, indicating a sex-biased admixture (Kutanan et al., 2011a). A certain degree of admixture between the Kra-Dai populations and the northern Thai Mon has been supported from analysis of their autosomal short tandem repeat (STR) sequences (Kutanan et al., 2011b). However, although genetic distinctions were observed in the high resolution Affymetrix Genechip Human Mapping 50K Xba array analysis, the northern Thai Mon were still clustered with their linguistically related groups who speak Austroasiatic languages (Xu et al., 2010). The northeastern Thai Mon showed a genetic difference from the other populations in their maternal lineage (Kutanan et al., 2014b). The Mon from western Thailand and southern Myanmar exhibited identical haplotypes of G6PD mutations with the Burmese, which is distinct from the Thai, Lao, and Khmer, reflecting a common origin or extensive gene flow between the Mon and Burmese (Nuchprayoon et al., 2008). For the central Thai Mon, no genetic investigation has been reported yet. This study aimed to evaluate the maternal genetic diversity of the Mon from different regions in Thailand (the North, Northeast, Central, and West), in order to elucidate the genetic structure and genetic relationship within the Mon groups and between the Mon and their linguistic relative, the Nyah Kur.
MATERIAL AND METHODS
Samples and DNA extraction
The subjects of this study were individual Mon people born in each village and maternally unrelated for at least three generations. One hundred twelve participants from three Mon villages located in different provinces, Kanchanaburi (MON_Sangkla, n = 52), Lopburi (MON_Lopburi, n = 39) and Ratchaburi (MON_Ratchaburi, n = 21), formed the study group of this analysis. Buccal swab samples were collected using a brush embedded in a Gentra Puregene Buccal Cell Kit (Qiagen, Hilden, Germany). All 112 donors were first interviewed and gave informed consent. Genomic DNA was then extracted according to the manufacturer’s specifications (Puregene DNA Buccal Cell Kit, Qiagen). The Ethics Committee for Human Research of Naresuan University, Thailand approved the use of human subjects for this study.
Amplification and sequencing of mtDNA
The mtDNA control region (np15704–430) was amplified using the published primer pairs (LLmt-A, 15704-5’-CATAGCCAATCACTTTATTG-3’-15723 and LHmt-E, 430-5’-CTGTTAAAAGTGCATACCGCC-3’-410) (Schurr et al., 1999) by PCR using nPfu-Forte DNA polymerase (Enzynomics, Daejeon, Korea) in a total volume of 50 μl. Each reaction consisted of 5 μl of 10x nPfu-Forte buffer, 5 μl of 200 mM dNTP mixture, 2.5 μl of each 5 mM PCR primer, 0.5 μl of 2.5 U/μl Pfu polymerase, 0.5 μl of 50 ng genomic DNA, and 34 μl of distilled water. The thermal cycling profile was 2 min at 95°C, followed by 35 cycles of 30 s at 95°C, 1 min at 56°C, 1 min at 72°C, and then a final 5 min at 72°C. Amplified products (approximately 1,200 bp) were checked on a 1% (w/v) agarose gel with a 100-bp DNA ladder (Norgen Biotek Corp., Thorold, ON, Canada). The excised products were then sent for purification and sequencing of the hypervariable region I (HVR-I; at 15897–100) at Macrogen Inc., Seoul, Korea using the SeqLmt-A (15897-5’-GTATAAACTAATACACCAGTCTTGT-3’-15921) and SeqHmt-E (100-5’-CAGCGTCTCGCAATGCTATCGCGTG-3’-76) primers for the Sanger sequencing reactions (Kampuansai et al., 2007). The obtained sequences were edited, assembled, and aligned with the revised Cambridge Reference Sequence (Andrews et al., 1999) using SeqScape software v2.7 (Applied Biosystem, Foster City, CA, USA).
Statistical analyses
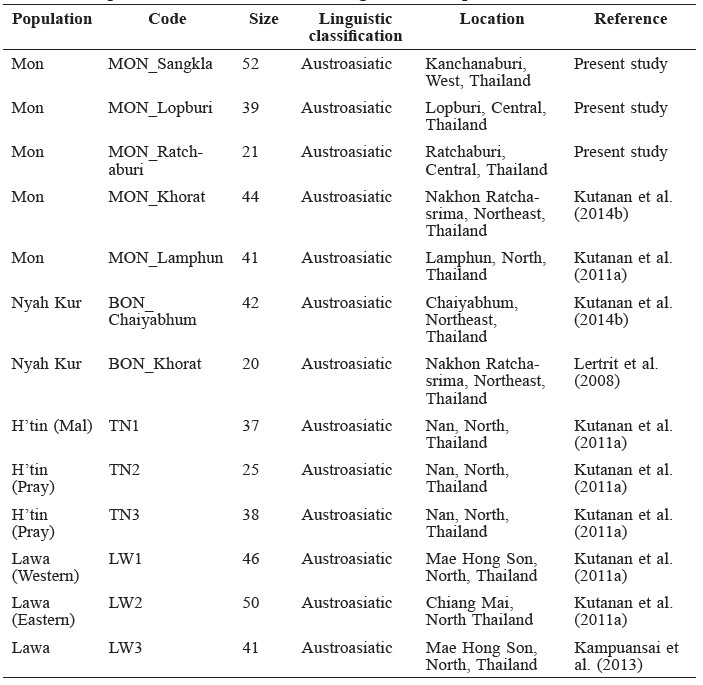
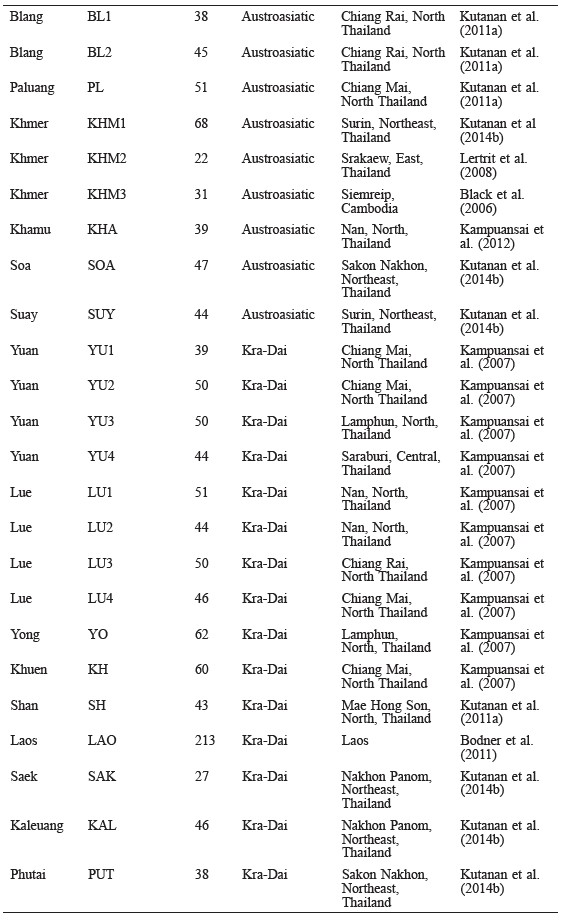
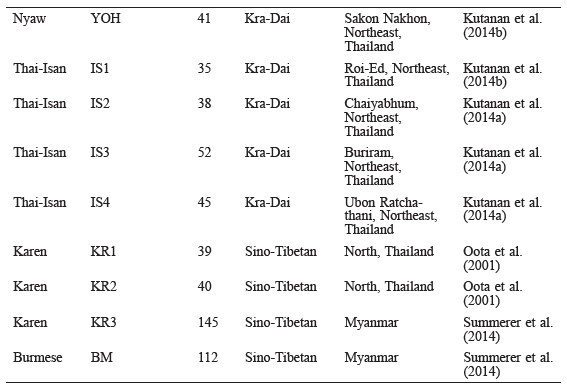
Polymorphic sites in a 360 bp length of the mtDNA (np16024–16383) were identified using DnaSP v.5 software (Librado and Rozas, 2009); these sequences and SNPs of the 112 Mons in the present study were then compared with two sets (set1 and set2) of previous mtDNA data in order to evaluate the genetic variation and population relatedness. Based on linguistic findings that the Nyah Kur language is related to ancient Mon, the mtDNA data of set1 comprised of two Mon populations (MON_Lamphun and MON_Khorat) and two Nyah Kur populations (BON_Chaiyabhum and BON_Korat) (Table 1) (Lertrit et al., 2008; Kutanan et al., 2011b; Kutanan et al., 2014b), while set2 was comprised of the mtDNA data from 44 populations belonging to three linguistic categories (Austroasiatic, Kra-Dai, and Sino-Tibetan) from Thailand and neighboring countries (Oota et al., 2001; Black et al., 2006; Kampuansai et al., 2007; Lertrit et al., 2008; Bodner et al., 2011; Kutanan et al., 2014a and 2014b; Kampuansai et al., 2012; Kampuansai et al., 2013; Summerer et al., 2014) (Table 2).
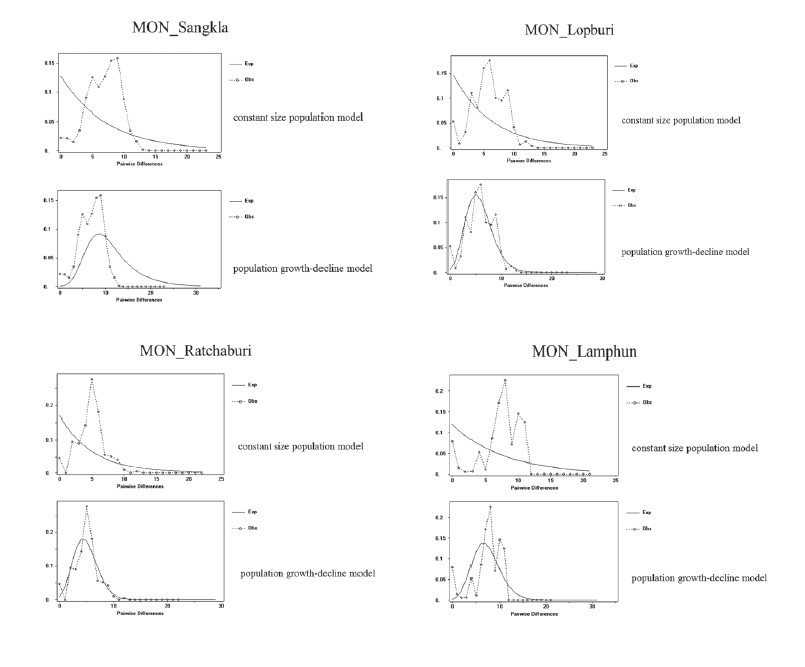
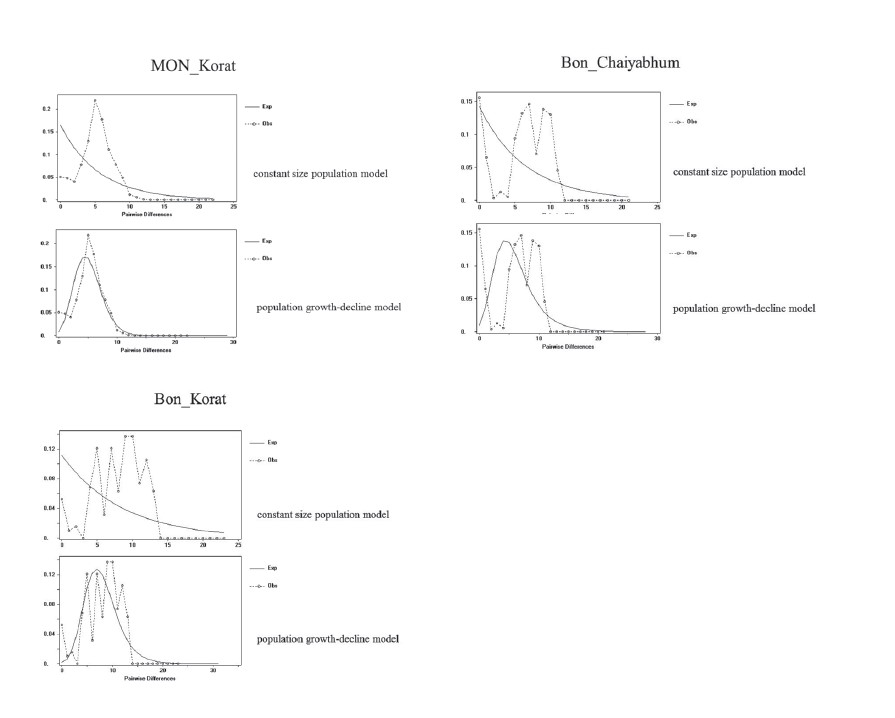
Several parameters of genetic diversity within populations, namely the mean pairwise differences (MPD) or intra-MPD, number of segregating sites nucleotide diversity (π), number of observed haplotypes and the haplotype diversity (h), were calculated using the Arlequin v.3.5 program (Excoffier and Lischer, 2010). The demographic expansion parameters, raggedness index value (r) (Harpending, 1994), and the neutrality estimators, Fu’s Fs (Fu, 1997) and Tajima’s D (Tajima, 1989), were computed using the same software. The mismatch distributions plots under a constant size population model and sudden population growth-decline models were constructed using DnaSP v.5. The number of shared haplotypes was determined within mtDNA set1 for each of the 21 possible population pairs by a simple gene count method.
Table 1. General information and basic parameters of the seven studied Mon populations and comparable populations in set1.
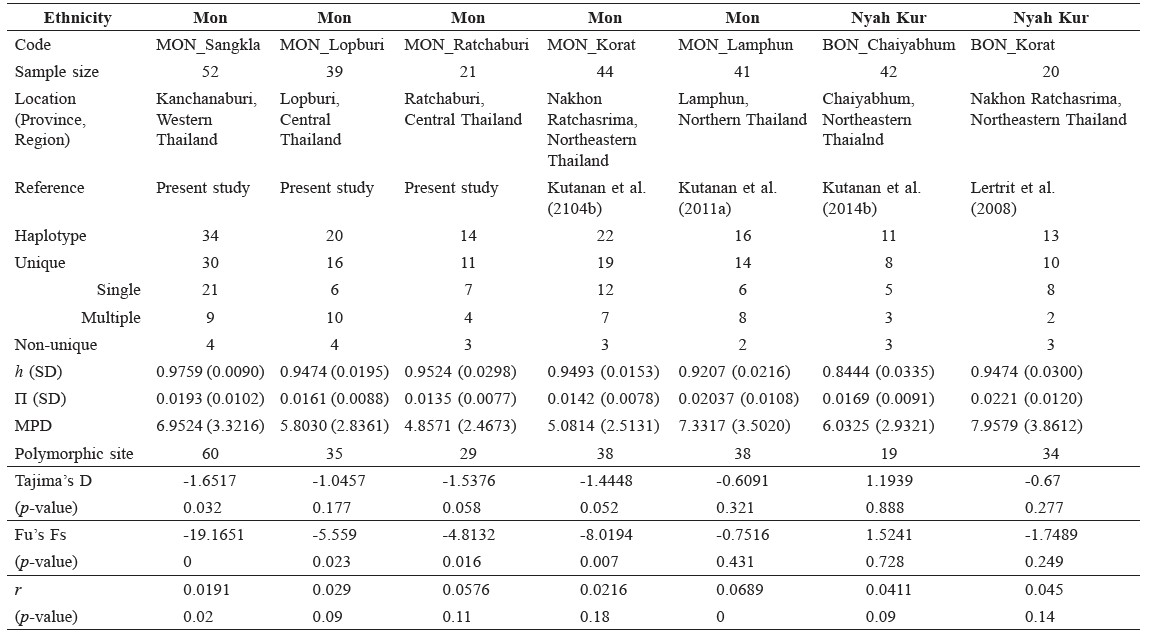
Table 2. Populations in set2 used in the genetic comparison.
Arlequin v.3.5 was used to execute all tests of mtDNA set2: the MPD values among populations (inter-MPD), analysis of molecular variance (AMOVA) (Excoffier et al., 1992) for the genetic variance at the three hierarchical subdivisions of within individuals of a population, among populations within a group, and among groups of populations, and the genetic distance between pairs of populations based on pairwise difference  significance tested by permutation). To characterize population relationships, the genetic distance matrix was plotted in two dimensions by means of multidimensional scaling (MDS) using STATISTICA v.10 (StatSoft Ltd.), and was also used to construct an unrooted neighbor joining (NJ) tree with the MEGA4 software (Tamura et al., 2007).
Apart from the demographic expansion parameters, which were used to infer previous demographic change, Bayesian skyline plot (BSP) (Drummond et al., 2005) was performed from the HVR-I using the MCMC algorithm (Drummond et al., 2002) operated in the BEAST version 1.8 program (Drummond et al., 2012). The jModel test 2.1.7 (Darriba et al., 2012) was employed to choose the suitable model for each population for creating input files of BEAST using BEAUTi v1.8. A strict molecular clock with a fixed rate of 1.64 x 10⁻⁷ substitutions/site/y was applied (Soares et al., 2009). Each MCMC sample was run for 1 x 10⁷ steps, sampled every 1000 steps, with the first 1 x 10⁶ steps regarded as burn-in. Tracer 1.5 (http://tree.bio.ed.ac.uk/ software/tracer) was used to visualize the BSP plot.
RESULTS
Genetic diversity and demographic expansion
Of the 259 sequences of the mtDNA set1, 118 different haplotypes were identified and defined by 99 variable positions (Data not shown). Among these 118 haplotypes, 65 and 43 were single and multiple unique haplotypes, respectively, while only 10 shared haplotypes were found. Haplotype number 19 (haplo19) was shared in four Mon populations (MON_Sangkla, MON_Ratchaburi, MON_Lamphun and MON_Korat), while the remaining shared haplotypes were shared among two populations (Data not shown). Haplotype number 66 (haplo66), which had the highest frequency, was found exclusively in the BON_Chaiyabhum population (Data not shown). Among 21 pairwise comparisons, 12 pairs had shared haplotypes. It is interesting that three pairs (MON_Sangkla-MON_Lopburi, MON_Sangkla-MON_Ratchaburi, and BON_Chiayabhum-BON_Khorat) shared more than one haplotype. Within the Mon ethnicity, almost all the populations exhibited shared haplotypes among the populations, except for the MON_Lopburi-MON_Lamphun pair. The Mon and Nyah Kur had very limited haplotype sharing. Only three haplotypes were observed to be shared among the Mon_Khorat-BON_Chiyabhum and MON_Lopburi-BON_Korat pairs.
The numbers for intrapopulation MPD and nucleotide diversity (π) were highest in the BON_Khorat population (7.9578 and 0.0221, respectively), reflecting a higher degree of genetic heterogeneity, but both values were lowest in the MON_Ratchaburi population (4.8571 and 0.0135, respectively), indicating the greatest degree of genetic homogeneity or recent mtDNA divergence within this population (Table 1). Haplotype diversity (h) varied from 0.9759 (MON_Sangkla) to 0.8444 (BON_Chaiyabhum), which was in the same range as that previously published for Austroasiatic populations in Thailand (Lertrit et al., 2008; Kutanan et al, 2011b; Kutanan et al., 2014b).
The significant negative values of Fu’s Fs (P < 0.01) could infer a previous demographic expansion in the MON_Sangkla and MON_Khorat populations. The very low raggedness index (less than 0.03) as well as the unimodal mismatch distribution graph for these two populations (Table 1 and Supplementary material 1) also provide congruent evidence for population growth and expansion in the MON_Sangkla and MON_ Khorat populations.
The BSP revealed expansion of the MON_Khorat and BON_Chaiyabhum populations, where they expanded approximately 2 and 1.25 kilo y ago (kya) in MON_Khorat and BON_Chaiyabhum, respectively. In the MON_Sankla population, a continuous expansion was observed during the pre-Neolithic expansion, but the population then declined after the Neolithic expansion (around 10 kya). The sizes of the MON_Lopburi, MON_Ratchaburi, and MON_Lamphun populations were likely to have been constant from Paleolithic to Neolithic times, but their effective population sizes were reduced after 5 kya, especially in the MON_Lamphun population, which showed a sharp reduction. Only the BON_Khorat population was found to have a relatively unchanged population size (Figure 1).
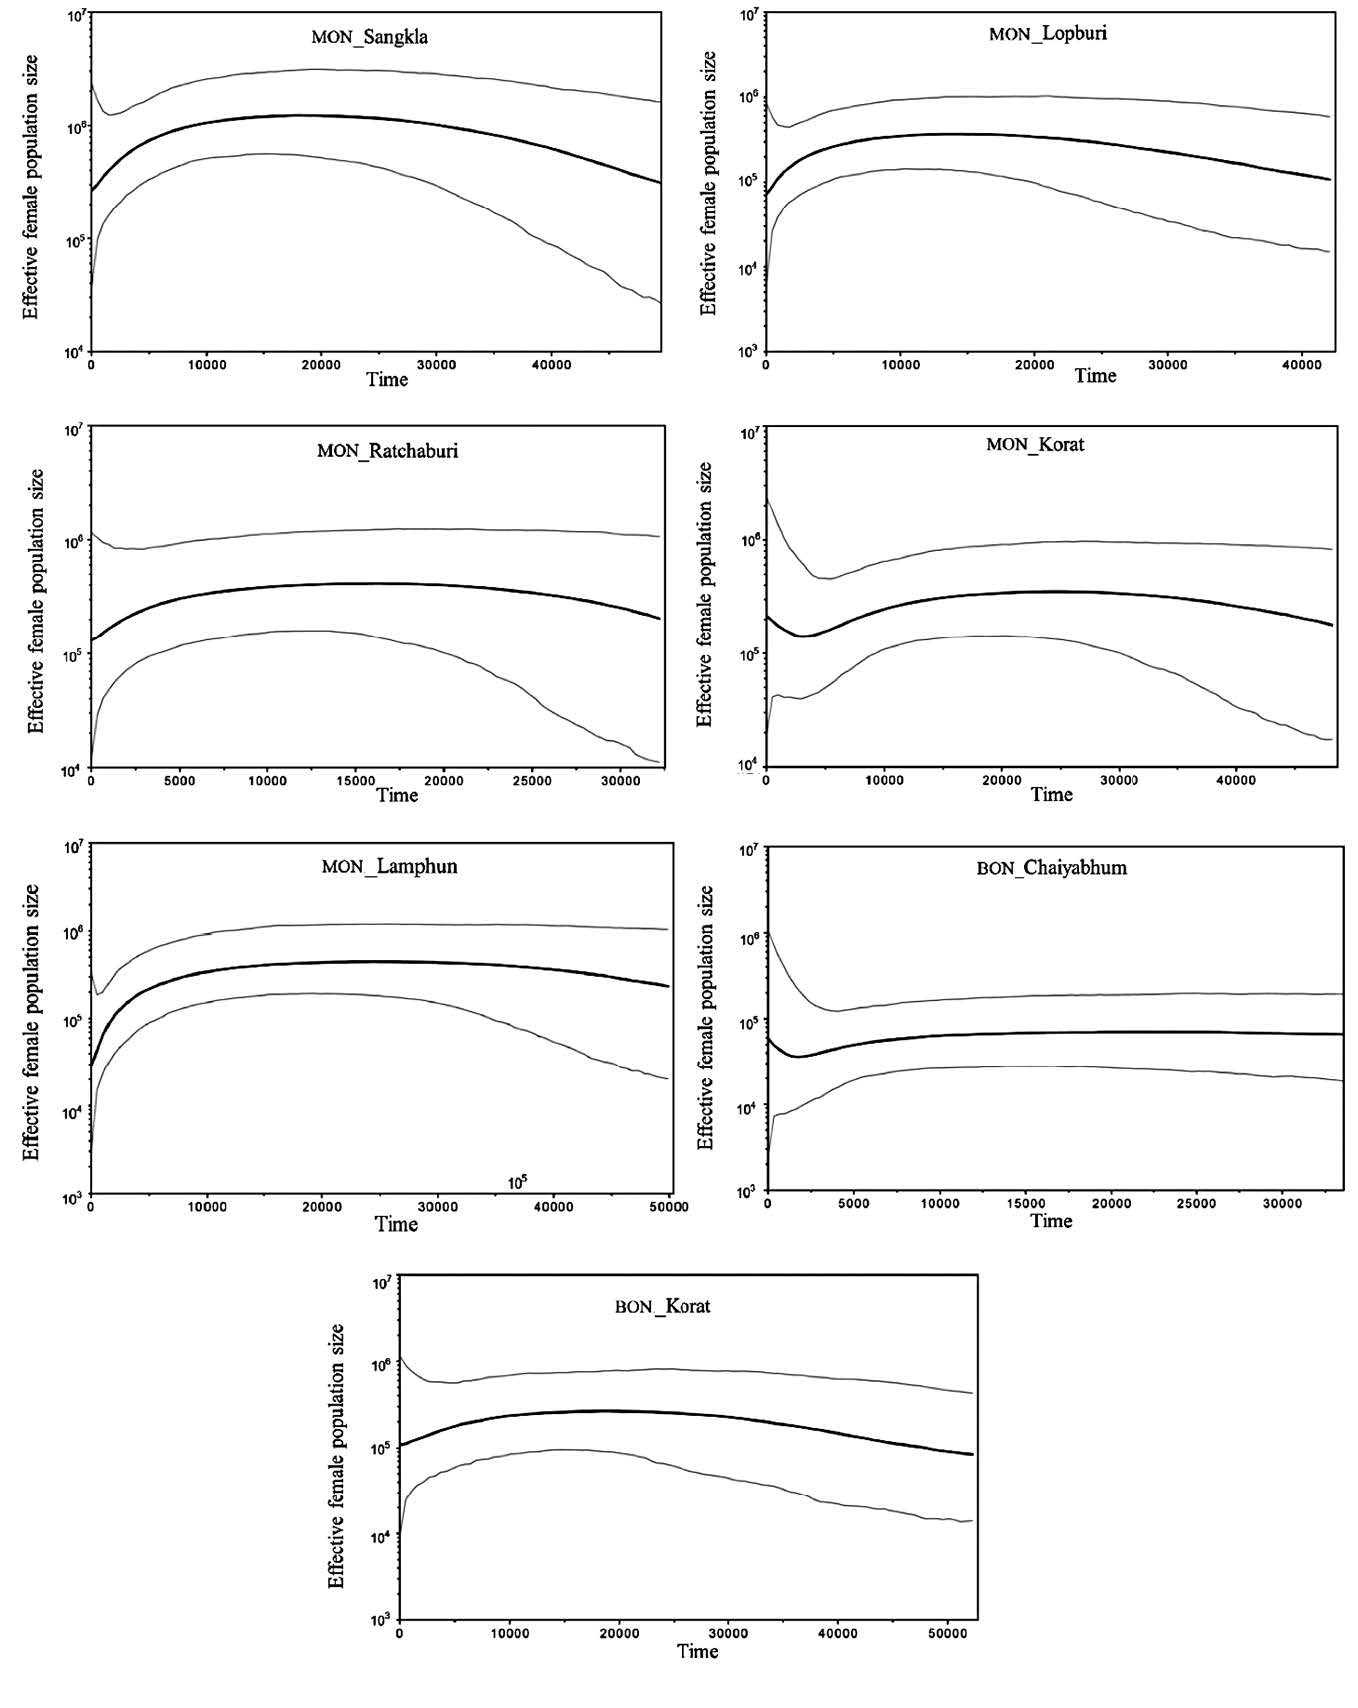
Figure 1. mtDNA Bayesian skyline plot (BSP) showing the size changes of seven populations in the analysis of the set1 data. The maternal effective size and the time from present in years are shown in the y-axis and x-axis, respectively. The solid line indicates the median estimate and the thin lines are the 95% highest posterior density edge. Population codes are embedded in Table 1.
Genetic relationship
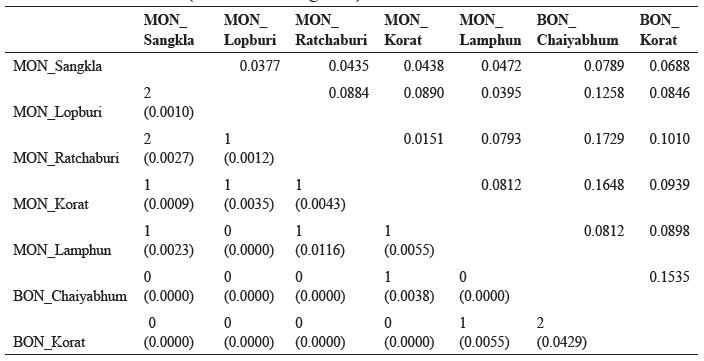
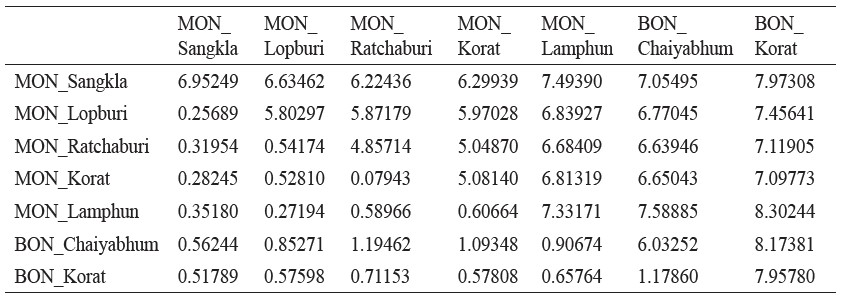
The pairwise  among 21 comparisons of the mtDNA data in set1 indicated that only one pair, MON_Ratchaburi and MON-Khorat, was not statistically significant. This pair had the lowest
  (0.0151) and MPD (5.0487) values (Table 3 and Supplementary material 2). To understand the broad picture of the population affinity among populations, we estimated the
  of set2 and then constructed a bi-plot MDS (Figure 2) and NJ tree (Figure 3).
Table 3. Shared haplotypes with matching probabilities expressed in parentheses (below the diagonal), and their genetic distances  based on pairwise differences (above the diagonal).
The MDS plot (Figure 2) revealed no specific tight groups but it seemed likely that almost all of the Kra-Dai populations were clustered together and with some Austroasiatic and Sino-Tibetan populations around the axis center, showing a genetic similarity. The exceptions were the differentiated populations of Saek (SK), Lue from Nan Province (LU1 and LU2), and Yuan from Saraburi Province (YU4). The influence of genetic drift within populations has been reported previously for these four Kra-Dai populations (Kampuansai et al., 2007; Kutanan et al., 2014b). Almost all of the Austroasiatic and Sino-Tibetan populations were dispersed from the central cluster, reflecting the genetic heterogeneity of these populations. Among the Mon groups, most of them clustered within the center cloud, especially the MON_Lamphun. However, the MON_Ratchaburi and MON_Korat populations showed more distant positions from the other Mon populations, but were genetically closely related.
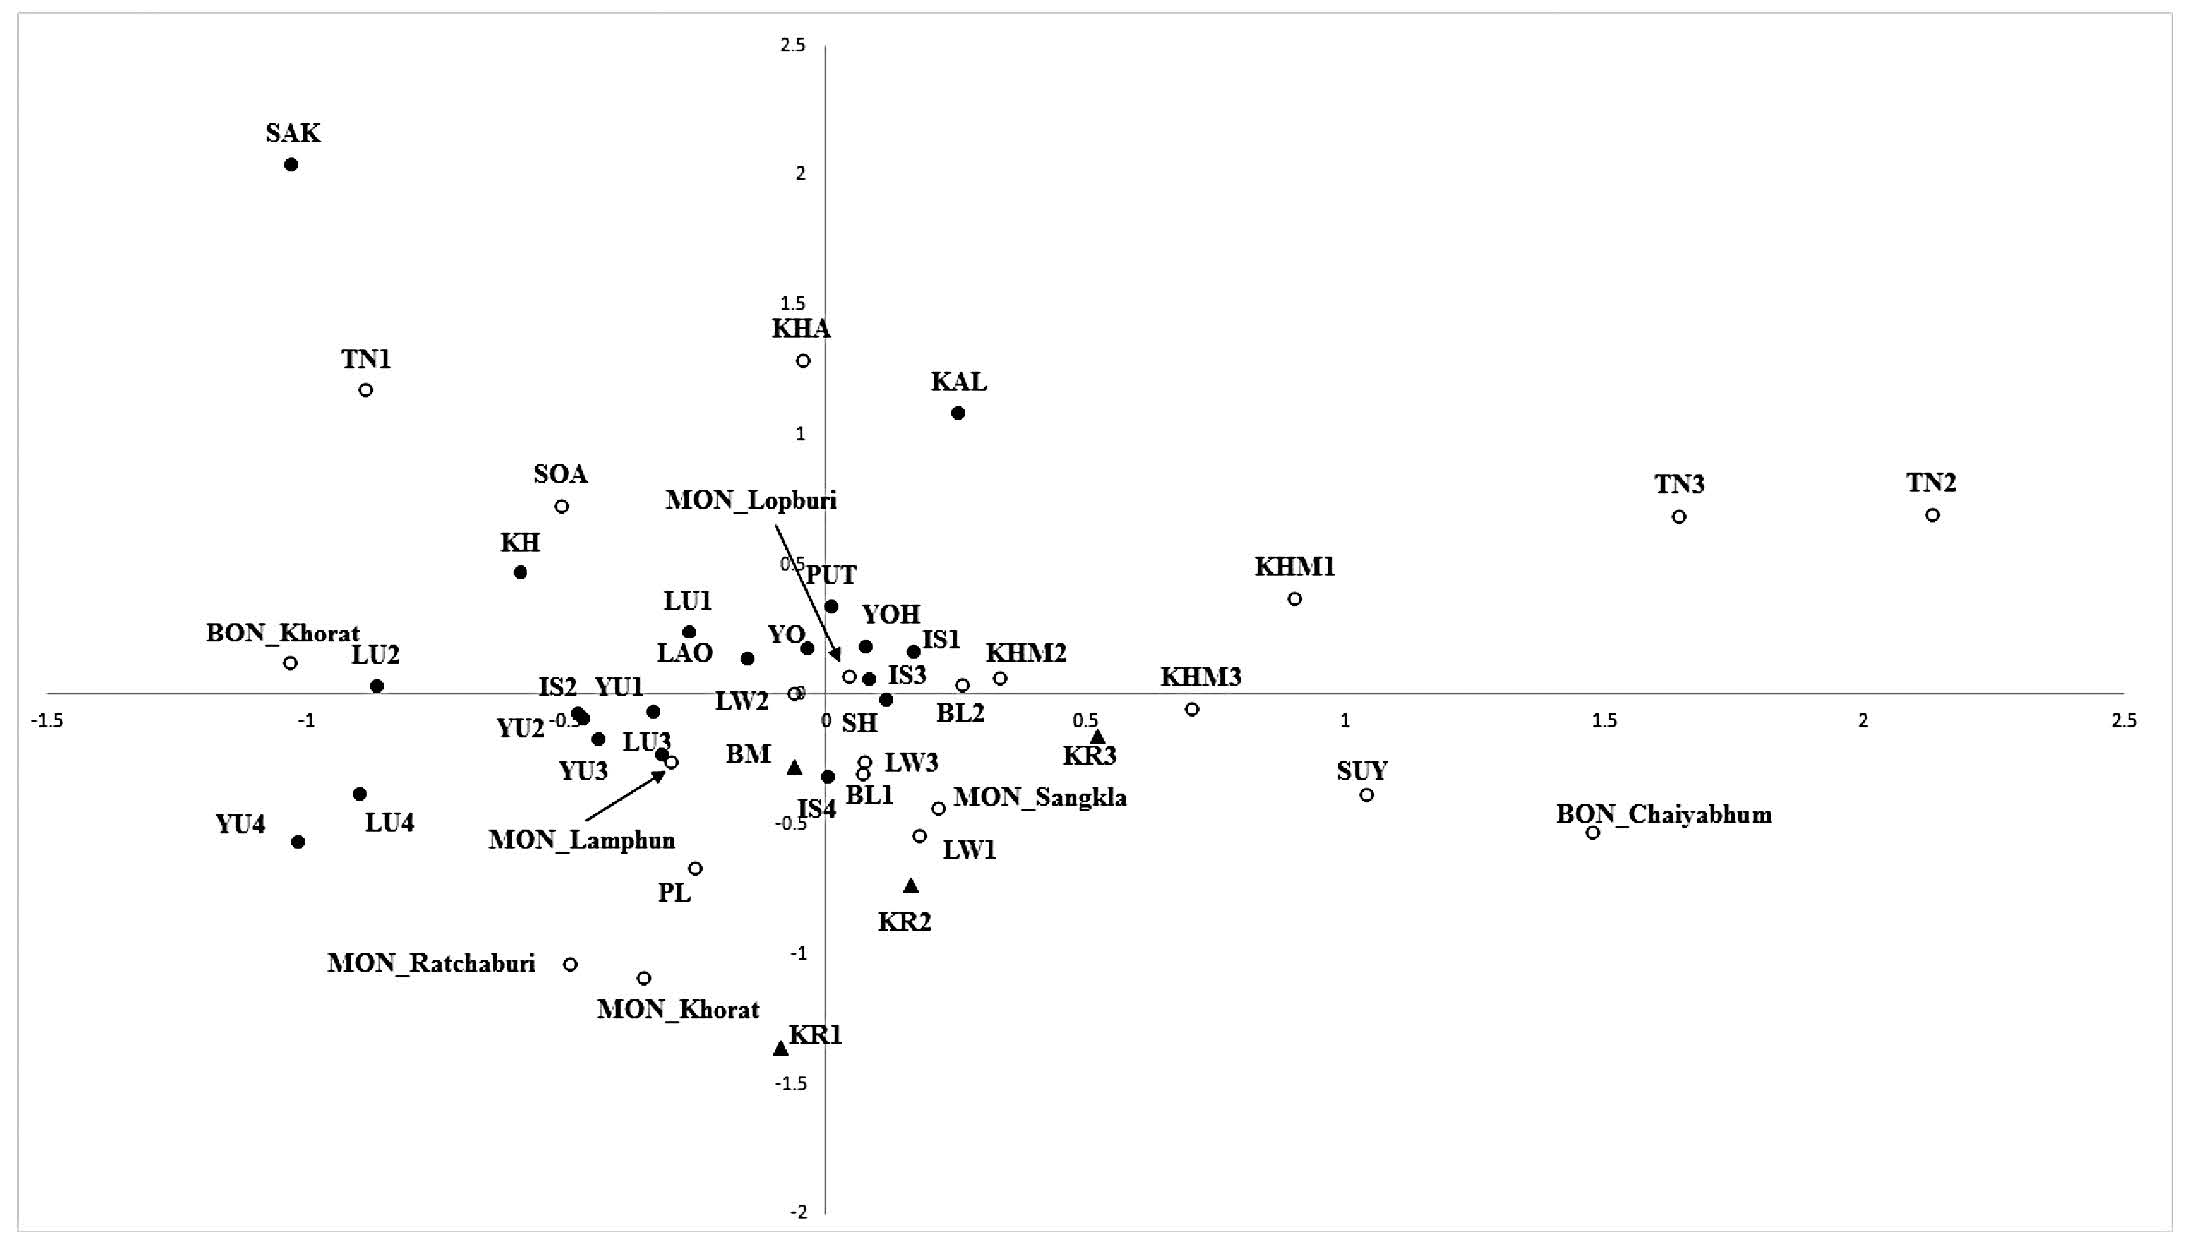
Figure 2. Bi-plot multi-dimensional scaling (MDS) plot constructed from the genetic distance  matrix. Full and blank circles represent Kra-Dai and Austroasiatic speaking populations and triangles represents Sino-Tibetan speaking groups. Population abbreviations are given in Table 2.
Four clusters of populations were visually observed in the NJ tree (Figure 3). The two clusters that were comprised of Austroasiatic populations (clusters 2 and 3) were predominant. The other two clusters were principally Kra-Dai populations (cluster 4) or linguistically mixed populations (cluster 1). The Mon populations were heterogeneous and dispersed in three clusters, but the MON_Lopburi, MON_Ratchaburi, and MON_Korat populations clustered together in cluster 2, with the MON_Ratchaburi and MON_Korat populations having the closest genetic relatedness. Interestingly, although the MON_Sangkla population located in the Austroasiatic cluster (cluster 3), within this cluster they were genetically closer to the Burmese and Karen. The MON_Lamphun population also showed genetic affinity to the Kra-Dai speaking groups. The Nyah Kur populations are also genetically divergent, in that the BON_Chaiyabhum populations were in the same cluster as the other Austroasiatic groups (cluster 3), while the BON_Khorat population fell in the same branch with linguistically different groups (cluster 4).
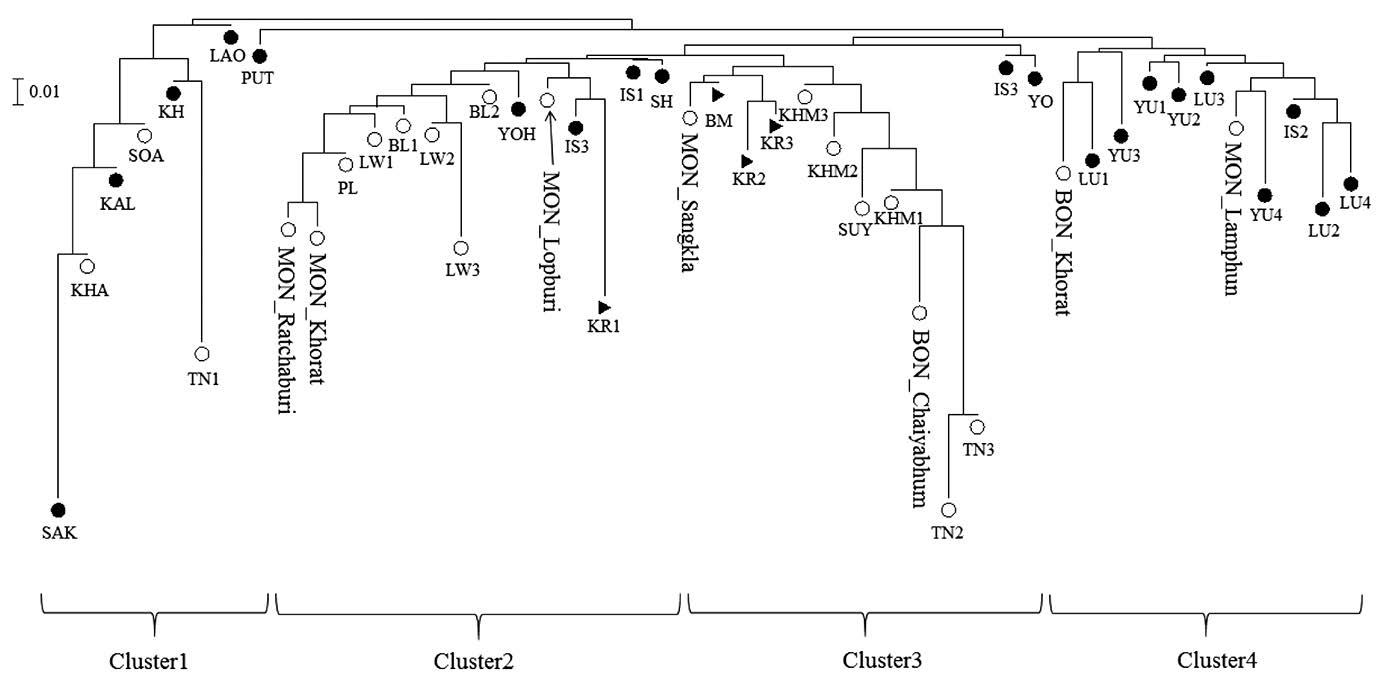
Figure 3. Neighbor joining (NJ) tree constructed from the genetic distance  matrix. Full and blank circles represent Kra-Dai and Austroasiaticspeaking populations, respectively and triangles represent Sino-Tibetan speaking groups. Population abbreviations are given in Table 2.
The AMOVA analysis revealed that population groupings based upon language can describe the genetic structure of the studied populations, since the amount of observed variation among groups (0.75%) was statistically significant (Table 4). The average  value among Austroasiatic populations (0.0991) was higher than the overall
  (0.0722), and was much higher than that for the Kra-Dai (0.0476) and Sino-Tibetan (0.0453) groups. When considering the average
  of ethnolinguistic Mon, an intermediate value (0.0566), lower than the other Austroasiatic groups but higher than the Kra-Dai groups, was observed. The AMOVA analysis indicated the genetic homogeneity of the Kra-Dai and Sino-Tibetan speaking groups and the genetic heterogeneity of the Austroasiatic group.
Table 4. Result of AMOVA.
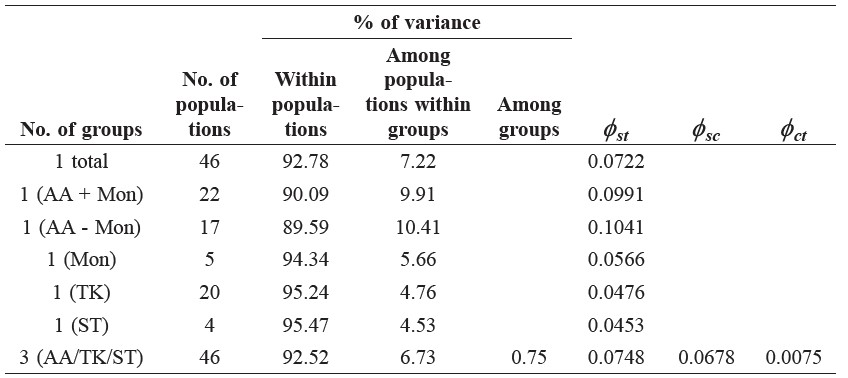
Note: AA = Austroasiatic groups, TK = Kra-Dai groups and ST = Sino-Tibetan groups.
DISCUSSION
As revealed by the maternal genetic comparison, the five Mon populations are genetically distinct from their Nyah Kur relatives (Figures 2 and 3). If the Nyah Kur populations represent the ancient population of Dvaravati, our result suggests that the modern Mon are not direct genetic descendants of the Monic people that inhabited central Thailand before the 12th century A.D. This interpretation is consistent with the linguistic finding that the old Mon language of Dvaravati was distinct from the old Mon variety ancestor of all modern Mon dialects (Diffloth, 1984). The maternal divergence between the present-day Mon and the Nyah Kur is expected, because they descended from different Monic populations. While all the present-day Mon groups in Thailand migrated from Myanmar only a few centuries ago (Ocharoen, 1998), the Nyah Kur are direct descendants of the ancient Dvaravati population of central Thailand (Diffloth, 1984).
More interestingly, a genetic distinction has been observed in the two Nyah Kur groups. The Nyah Kur in Chaiyabhum (BON_Chaiyabhum) is grouped with other Austroasiatic speaking populations, especially the Khmer (KHM) and the Suay (SUY), while their relatives in Nakhon Ratchasima (BON_Khorat) clustered with various ethnolinguistic groups speaking Kra-Dai languages (Figure 3). While the low haplotype diversity among the Nyah Kur in Chaiyabhum might have been shaped by a founder effect and/or inbreeding owing to population isolation, which is also supported by the stability of the population size (Figure 1), external gene flow and population expansion might play an important role in driving the high MPD and π values in the Nyah Kur population in Nakhon Ratchasima (Table 1). This strongly suggests that the Nyah Kur in Chaiyabhum represents the ancient Monic lineage that has been lost in the Nyah Kur in Nakhon Ratchasima due to intermarriage with Kra-Dai speaking populations. This hypothesis is further supported by the clustering of the Chaiyabhum group with the western Thai Mon from Kanchanaburi, who only migrated from Karen State in Myanmar in the 1980s (Bauer, 1990). Because of their recent arrival in Thailand and their geographical distance from the Nyah Kur, the Kanchanaburi Mon’s genetic similarity to the Nyah Kur in Chaiyabhum is unlikely to be due to gene flow.
As for the Mon, the genetic heterogeneity among the five groups, as indicated by their scattered positions in the MDS plot (Figure 2) and the NJ tree (Figure 3), suggests different histories of genetic admixture. Overall, the intermediate  values of the Mon (Table 3) are characteristic of the genetic structure of admixed populations (Cavalli-Sforza and Bodmer, 1971), as observed in many other human populations (Passarino et al., 2002; Sans et al., 2002; Wen et al., 2004c; Montinaro et al., 2015). The Mon in Lamphun, not surprisingly, are most closely related to the Yuan- and Lue-speaking groups (YU1-4 and LU1-4), who are their neighbours in northern Thailand. Close genetic affinity between the northern Thai Mon (MON5) and the Kra-Dai speaking groups in northern Thailand (Figures 2 and 3) supports the genetic exchange between them. This pattern was similar to a previous study utilizing uniparentally inherited nuclear markers (Kutanan et al., 2011a), which reported a sex-biased admixture in the northern Thai Mon. This genetic admixture is probably the result of the assimilation policy promoted by the Thai government during the 20th century A.D.
In contrast, the Kanchanaburi Mon population clustered with the BM, KR1, and KR2 populations, indicating a genetic exchange among the ethnolinguistic groups along the Thai-Myanmar border. The high prevalence of the Mahidol type G6PD deficiency in the Mon, Burmese, and Karen in Myanmar has been reported, while the Vientiane-type G6PD mutation was widely observed in the Thai, Lao, and Khmer (Iwai et al., 2001; Matsuoka et al., 2005; Nuchprayoon et al., 2008). This finding thus supports the close genetic relationship among the Mon, Burmese, and Karen in Myanmar.
Furthermore, the MON groups in Lopburi, Ratchaburi, and Nakhon Ratchasima showed a relatively close genetic relationship to the Karen in northern Thailand (KR1), the Thai Isan (IS3) in the lower part of northeastern Thailand (IS2-3), the Shan (SH), and a number of Austroasiatic-speaking populations (PL1-2, BL1-2, and LW1-2) further north (Figure 2). The clearest case of genetic admixture among the three Mon groups is in the Lopburi Mon population, which is located in the central cloud of the MDS plot (Figure 3). Interestingly, the Ratchaburi and Nakhon Ratchasima Mon populations showed the closest genetic relationship among the five Mon groups (Table 3 and Figure 3), suggesting that they migrated to Thailand in the same wave before splitting to settle in different areas (Ocharoen, 1998). However, it is unclear why these Mon groups are genetically closer to the Austroasiatic-speaking groups in the north than to the western Mon.
Several studies investigating global population expansion based on the mtDNA genome have reported a lack of any major population expansion after the Neolithic expansion (10 kya) (Atkinson et al., 2008; Gignoux et al., 2011). In the Han Chinese mtDNA genome, population expansion began before the Neolithic time, which stimulated the development of agriculture to produce enough food (Zheng et al., 2011). The female effective population size, based on the HVR-I sequence of Cambodian aborigines, started to decline at 5 kya, but then suddenly increased during the last 1 kya (Zhang et al., 2013). Based on the BSP (Figure 1), the maternal population sizes of almost all of the Mon populations, with the exception of the MON_Khorat one, were unchanged or perhaps increased until their diminution during the last 5 to 1 kya. The MON_Khorat population initially expanded around 2 kya, and this trend has continued from their migration into Thailand to the present time. Although the maternal population size of the MON_Sangkla declined after the Neolithic expansion, a continuous demographic expansion during the pre-Neolithic expansion might have caused genetic variation to accumulate, as indicated by the demographic expansion and BSP results (Table 1 and Figure 1). Our results of population expansion seem to be more consistent with the Cambodian populations than the Han Chinese, reflecting a similar population history among the Southeast Asian populations. However, the use of less informative genetic markers in the present study, in which only HVR-I sequence was analyzed, and in studies of the Khmer, should be noted, in contrast to the full mitochondrial genome sequencing of the Han Chinese.
CONCLUSION
The results of this study provided additional information on the maternal genetic ancestry of the modern Mon in Thailand. The genetic structures of the five Mon populations studied revealed genetic heterogeneity that likely resulted from population admixture. While the Mon in western, central, and northeastern Thailand show a genetic connection to Sino-Tibetan groups, possible maternal genetic exchange between the Mon in northern Thailand and their neighbouring Kra-Dai speaking groups was observed. Furthermore, the modern Mon and their Monic relatives, the Nyah Kur, have distinct maternal genetic structures, which have possibly resulted from different population histories in which the modern Mon are genetically related to the Mon in Myanmar and the Nyah Kur descended from the Dvaravati Mon. However, the present study relied on sequences from only the HVR-I region of the mtDNA, and so future work analyzing mtDNA haplogroup lineages from the rest of the mtDNA genome, as well as Y chromosomal variations, could elucidate a more comprehensive and accurate genetic history of the Mon in Thailand.
ACKNOWLEDGEMENTS
We are grateful to all the volunteers for providing their buccal samples and village chiefs for coordination. We appreciate Dr. Alvin Yoshinaga for English correction. MS was supported by Naresuan University (Grant number R2559B076). Chiang Mai University funded JK under the CMU Mid-Career Research Fellowship program, while WK was financially supported by Khon Kaen University under the Incubation Research project.
REFERENCES
Andrews, R.M., I. Kubacka, P.F. Chinnery, R.N. Lightowlers, D.M. Turnbull, and N. Howell. 1999. Reanalysis and revision of the Cambridge reference sequence for human mitochondrial DNA. Nature Genetics. 23: 147. doi: 10.1038/13779
Atkinson, Q.D., R.D. Gray, and A.J. Drummond. 2008. mtDNA variation predicts population size in humans and reveals a major southern Asian chapter in human prehistory. Molecular Biology and Evolution. 25: 468-474. doi: 10.1093/molbev/msm277
Bauer, C. 1990. Language and ethnicity: The Mon in Burma and Thailand. In: Wijeyewardene G (eds) Ethnic groups across national boundaries in Mainland Southeast Asia, Institute of Southeast Asian Studies, Singapore.
Black, M.L., K. Dufall, C. Wise, S. Sullivan, and A.H. Bittles. 2006. Genetic ancestries in northwest Cambodia. Annals of Human Biology. 33: 620-627. doi: 10.1080/03014460600882561
Bodner, M., B. Zimmermann, A. Röck, A. Kloss-Brandstätter, D. Horst, B. Horst, S Sengchan, T. Sanguansermsri, J. Horst, T. Krämer, P.M. Schneider, and W. Parson. 2011. Southeast Asian diversity: First insights into the complex mtDNA structure of Laos. BMC Evolutionary Biology. 11: 49. doi: 10.1186/1471-2148-11-49
Cavalli-Sforza L.L., and W.F. Bodmer. 1971. The Genetics of Human Populations. Freeman, San Fransisco.
Darriba, D., G.L. Taboada, R. Doallo, and D. Posada. 2012. “jModelTest 2: more models, new heuristics and parallel computing”. Nature Methods. 9(8): 772. doi: 10.1038/nmeth.2109
Diffloth, G. 1984. The Dvaravati Old Mon Language and Nyah Kur, Chulalongkorn University, Bangkok.
Drummond, A.J., A. Rambaut, B. Shapiro, and O.G. Pybus. 2005. Bayesian coalescent inference of past population dynamics from molecular sequences. Molecular Biology and Evolution. 22: 1185-1192. doi: 10.1093/molbev/msi103
Drummond, A.J., G.K. Nicholls, A.G. Rodrigo, and W. Solomon. 2002. Estimating mutation parameters, population history and genealogy simultaneously from temporally spaced sequence data. Genetics. 161: 1307-1320.
Drummond, A.J., M.A. Suchard, D. Xie, and A. Rambaut. 2012. Bayesian phylogenetics with BEAUti and the BEAST 1.7. Molecular Biology and Evolution. 29: 1969-1973. doi: 10.1093/molbev/mss075
Excoffier, L., P. Smouse, and J. Wuattro. 1992. Analysis of molecular variance inferred from metric distance among DNA haplotypes: application to human mitochondrial DNA restriction data. Genetics. 131: 479-491.
Excoffier, L., and H.E.L. Lischer. 2010. Arlequin suite ver 3.5: A new series of programs to perform population genetics analyses under Linux and Windows. Molecular Evolution Research. 10: 564-567. doi: 10.1111/j.1755-0998.2010.02847.x
Fu, Y.X. 1997. Statistical tests of neutrality of mutations against population growth, hitchhiking and background selection. Genetics. 147, 915-925.
Gignoux, C.R., B.M. Henn, and J.L. Mountain. 2011. Rapid, global demographic expansions after the origins of agriculture, Proceedings of the National Academy of Sciences of the United States of America. 108: 6044-6049. doi: 10.1073/pnas.0914274108
Guillou, E. 1999. The Mons: A civilization of Southeast Asia. In J.V. Di Crocco (ed and tran). The Siam Society Under the Royal. Bangkok.
Harpending, H.C. 1994. Signature of ancient population growth in a low-resolution mitochondrial DNA mismatch distribution. Human Biology. 66: 591-600.
Huffman, F.E. 1990. Burmese Mon, Thai Mon, and Nyahkur: A synchronic comparison. Mon-Khmer Studies. 16-17: 31-84.
Iwai, K., A. Hirono, H. Matsuoka, F. Kawamoto, T. Horie, K. Lin, I.S. Tantular, Y.P., Dachlan, H. Notopuro, N.I. Hidayah, A.M. Salim, H. Fujii, S. Miwa, and A. Ishii. 2001. Distribution of glucose-6-phosphate dehydrogenase mutations in Southeast Asia. Human Genetics. 108: 445-449. doi: 10.1007/s004390100527
Kampuansai, J., G. Bertorelle, L. Castri, S. Nakbunlung, M. Seielstad, and D. Kangwanpong. 2007. Mitochondrial DNA variation of Tai speaking peoples in northern Thailand. Science Asia. 33: 443-448. doi: 10.2306/scienceasia1513-1874.2007.33.443
Kampuansai, J., W. Kutanan, S. Phuphanitcharoenkul, D. Kangwanpong. 2012. A suggested Khmuic origin of the hunter-gatherer Mlabri in northern Thailand: evidence from maternal DNA lineages. Thai Journal of Genetics. 5(2): 203-215.
Kampuansai, J., S. Mheetong, and W. Kutanan. 2013. The role of founder effect on genetic structure of the Lawa in Mae Hong Son Province. KKU Research Journal. 18(3): 472-483.
Kutanan, W., J. Kampuansai, S. Fuselli, S. Nakbunlung, M. Seielstad, G. Bertorelle, and D. Kangwanpong. 2011a. Genetic structure of the Mon-Khmer speaking groups and their affinity to the neighbouring Tai populations in Northern Thailand. BMC Genetics. 12: 56. doi: 10.1186/1471-2156-12-56.
Kutanan, W., J. Kampuansai, V. Colonna, S. Nakbunlung, P. Lertvicha, M. Seielstad, G. Bertorelle, and D. Kangwanpong. 2011b. Genetic affinity and admixture of northern Thai people along their migration route in northern Thailand: evidence from autosomal STR loci. Journal of Human Genet. 56:130-137. doi: 10.1038/jhg.2010.135
Kutanan, W., S. Srithawong, A. Kamlao, and J. Kampuansai. 2014a. Mitochondrial DNA- HVR1 variation reveals genetic heterogeneity in Thai-Isan peoples from the lower region of Northeastern Thailand. Advance Anthropology. 4: 7-12. doi: 10.4236/aa.2014.41002
Kutanan, W., S. Ghirotto, G. Bertorelle, S. Srithawong, K. Srithongdaeng, N. Pontham, and D. Kangwanpong. 2014b. Geography has more influence than language on maternal genetic structure of various northeastern Thai ethnicities. Journal of Human Genetics. 59: 512-520. doi: 10.1038/jhg.2014.64
Librado, P., and J. Rozas. 2009. DnaSP v5: A software for comprehensive analysis of DNA polymorphism data. Bioinformatics. 25: 1451-1452. doi: 10.1093/bioinformatics/btp187
Lertrit, P., S. Poolsuwan, R. Thosarat, T. Sanpachudayan, H. Boonyarit, C. Chinpaisal, and B. Suktitipat. 2008. Genetic history of south-east Asian populations as revealed by ancient and modern human mitochondrial DNA analysis. American Journal of Physical Anthropology. 137: 425-440. doi: 10.1002/ajpa.20884
Matsuoka, H., C. Nguon, T. Kanbe, A. Jalloh, H. Sato, S. Yoshida, M. Hirai, M. Arai, D. Socheat, and F. Kawamoto. 2005. Glucose-6-phosphate dehydrogenase (G6PD) mutations in Cambodia: G6PD Viangchan (871G>A) is the most common variant in the Cambodian population. Journal of Human Genetics. 50(9): 468-472. doi: 10.1007/s10038-005-0279-z
Montinaro, F., G.B.J. Busby, V.L. Pascali, S. Myers, G. Hellenthal, and C. Capelli. 2015. Unravelling the hidden ancestry of American admixed populations. Nature Communication. 6: 6595. doi:10.1038/ncomms7596
Nuchprayoon, I., C. Louicharoen, and W. Charoenwej. 2008. Glucose-6-phosphate dehydrogenase mutations in Mon and Burmese of southern Myanmar. Journal of Human Genetics. 53(1): 48-54. doi: 10.1007/s10038-007-0217-3
Ocharoen, S. 1998. Mons in Thailand, Thailand Research Research Fund (In Thai), Bangkok.
Oota, H., W. Settheetham-Ishida, D. Tiwawech, T. Ishida, and M. Stoneking. 2001. Human mtDNA and Y-chromosome variation is correlated with matrilocal versus patrilocal residence. Nature Genetics. 29: 20-21. doi: 10.1038/ng711
Passarino, G., G.L. Cavalleri, A.A. Lin, L.L. Cavalli-Sforza, A.L. Børresen-Dale, and P.A. Underhill. 2002. Different genetic components in the Norwegian population revealed by the analysis of mtDNA and Y chromosome polymorphisms. European Journal of Human Genetics. 10: 521-529. doi: 10.1038/sj.ejhg.5200834
Pon Nya, M. 2001. Ethnic identity and political autonomy of the Mon. p. 169-202. In P. McCormick, M. Jenny, and C. Baker (ed) The Mon over two millennia: Monuments, manuscripts, movements, Institute of Asian Studies, Chulalongkorn University, Bangkok.
Sans, M., T.A. Weimer, M.H. Franco, F.M. Salzano, N. Bentancor, I. Alvarez, N.O. Bianchi, and R. Chakraborty. 2002. Unequal contributions of male and female gene pools from parental populations in the African descendants of the city of Melo, Uruguay. American Journal of Physical Anthropology. 118: 33-44. doi: 10.1002/ajpa.10071
Saraya, D. 1999. (Sri) Davravati: The initial phrase of Siam’s history, Muang Boran Publishing House, Bangkok.
Schurr T.G., R.I. Sukernik, Y.B. Starikovskaya, and D.C. Wallace. 1999. Mitochondrial DNA variation in Koryaks and Itel’men: population replacement in the Okhotsk sea-Bering sea region during the Neolithic. American Journal of Physical Anthropology. 108: 1-39. doi: 10.1002/(SICI)1096-8644(199901)108:1<1::AID-AJPA1>3.0.CO;2-1
Soares, P., L. Ermini, N. Thomson, M. Mormina, T. Rito, A. Röhl, A. Salas, S. Oppenheimer, B. Macaulay, and M.B. Richards. 2009. Correcting for purifying selection: an improved human mitochondrial molecular clock. American Journal of Human Genetics. 84: 740-759. doi: 10.1016/j.ajhg.2009.05.001
Summerer, M., J. Horst, G. Erhart, H. Weißensteiner, S. Schönherr, D. Pacher, L. Forer, D. Horst, A. Manhart, B. Horst, T. Sanguansermsri, and A. Kloss-Brandstätter. 2014. Large-scale mitochondrial DNA analysis in Southeast Asia reveals evolutionary effects of cultural isolation in the multi-ethnic population of Myanmar. BMC Evolutionary Biology. 14: 17. doi: 10.1186/1471-2148-14-17.
Tajima, F. 1989. Statistical method for testing the neutral mutation hypothesis by DNA polymorphism. Genetics. 123: 585-595.
Tamura, K., J. Dudley, M. Nei, and S. Kumar. 2007. MEGA4: Molecular evolutionary genetics analysis (MEGA) software version 4.0. Molecular Biology and Evolution. 24: 1596-1599. doi: 10.1093/molbev/msm092
Wen, B., X. Xie, S. Gao, H. Li, H. Shi, X. Song, T. Qian, C. Xiao, J. Jin, B. Su, D. Lu, R. Chakraborty, and L. Jin. 2004c. Analyses of genetic structure of Tibeto-Burman populations reveals sex-biased admixture in southern Tibeto-Burmans. American Journal of Human Genetics. 74: 856-865. doi: 10.1086/386292
Xu, S., D. Kangwanpong, M. Seielstad, M. Srikummool, J. Kampuansai, and L. Jin. 2010. Genetic evidence supports linguistic affinity of Mlabri - a hunter-gatherer group in Thailand. BMC Genetics. 11: 18. doi: 10.1186/1471-2156-11-18
Zhang, X., X. Qi, Z. Yang, B. Serey, T. Sovannary, L. Bunnath, H.S. Aun, H. Samnom, H. Zhang, Q. Lin, M. van Oven, H. Shi, and B. Su. 2013. Analysis of mitochondrial genome diversity identifies new and ancient maternal lineages in Cambodian aborigines. Nature Communication. 4: 2599. doi:10.1038/ncomms3599
Zheng, H.X., S. Yan, Z.D. Qin, Y. Wang, J.Z. Tan, H. Li, and L. Jin. 2011. Major Population Expansion of East Asians Began before Neolithic Time: Evidence of mtDNA Genomes. PloS One. 6(10): e25835. doi: 10.1371/journal.pone.0025835
Supplementary material 1
Mismatch distributions of the HVR-I sequences of the seven studied Mon populations. The dotted lines indicate the observed distributions and the solid lines indicate the expected distributions under the constant size population model and the sudden population growth-decline model.
Supplementary material 2
Population average pairwise differences between populations (PiXY) (above diagonal), average pairwise differences within populations (PiX) (diagonal elements) and corrected average pairwise differences (PiXY-(PiX+PiY)/2) (below diagonal)
Jatupol Kampuansai1Ψ, Metawee Srikummool2Ψ, Pittayawat Pittayaporn3 and Wibhu Kutanan4*
1 Department of Biology, Faculty of Science, Chiang Mai University, Chiang Mai 50200, Thailand
2 Department of Biochemistry, Faculty of Medical Science, Naresuan University 65000, Phitsanulok, Thailand
3 Department of Linguistics, Faculty of Arts, Chulalongkorn University, Bangkok 10330, Thailand
4 Department of Biology, Faculty of Science, Khon Kaen University, Khon Kaen 40002, Thailand
*Corresponding author. E-mail: wibhu@kku.ac.th
ΨThese authors contributed equally.
Total Article Views