 ISSN: 2822-0838 Online

Identifying the Origin of Forensic Soil Evidence Using Amplified Ribosomal DNA Restriction Analysis of its Bacterial Community
Venus Naknim, Wibhu Kutanan and Khemika Lomthaisong*Published Date : 2019-08-23
DOI : 10.12982/cmujns.2016.0009
Journal Issues : Number2 ,May - August 2016
ABSTRACT
The objective of this study was to identify the origin of forensic soil evidence using amplified ribosomal DNA restriction analysis (ARDRA). A mock crime scene was set up and four types of soil samples were collected: 1) from shoes “walked” within the mock crime site (KKU8), 2) from the mock crime site itself (KKU1-KKU5), 3) from nearby the mock crime site (KKU6, KKU7), 4) and from distant irrelevant areas (NM, BP, TP). Soil bacterial DNA was extracted and 16S rDNA sequence was subsequently amplified by PCR technique. The amplicons were then separately digested with three different restriction enzymes: RsaI, MboI, and HindIII. The digested DNA fragments were separated by 3% agarose electrophoresis. Approximately 116 and 112 DNA fragments were found on the restriction profiles of RsaI and MboI, respectively. In contrast, no restriction fragments were observed on the profiles of HindIII digestion. Hence, double digestion of 16S rDNA with RsaI and MboI was performed, producing nearly 124 bands of fragmented DNA. Two clustering analyses, dendrogram and Principal Coordinated Analysis (PCoA), were conducted in order to depict the restriction profile groups produced either by single or double digestion. Three groups of soil samples were identified over all digestion profiles in which KKU8 was clustered in the same group as KKU1-KKU7, indicating the same soil sample origin. The results suggested that a single digestion profile of soil bacterial 16S rDNA was plausibly sufficient to determine the origin of soil for forensic investigation purposes.
Keywords: Bacterial community structure, 16S rDNA, Forensic marker, DNA marker fingerprint, Clustering analysis
INTRODUCTION
When a crime is committed, soil residue is one potential piece of evidence that may be found on clothes, shoes, or vehicles belonging to the suspect. Identification of a soil’s origin is useful for forensic investigation in order to link the suspect with the crime scene. Previous research has studied the origin of soil by comparing its physical and chemical properties – for example, comparing soil color after drying and heating (Sugita and Marumo, 1996), analyzing fibers associated with chemical and physical analyses (Bull et al., 2006), and examining soil element composition by SEM-EDS (Cengiz et al., 2004). In addition, the analyses of biological properties, e.g., pollens, diatoms, microorganisms (Bull et al., 2006), and amoeba (Swindles and Ruffell, 2009) have successfully been utilized as key markers for soil identification.
To determine the origin of soils using microorganisms, several studies have relied on techniques that can differentiate between microbial communities, because their diversity is affected by soil environmental conditions (Lauber et al., 2008; Massenssini et al., 2015). The characteristics of colonies appearing on the culture were formerly used to distinguish soil microorganisms. However, some microorganism species cannot be cultured. In these cases, DNA analysis offers an alternative approach to identifying soil microorganisms. The sequencing of 16S rDNA has been widely employed for this purpose, as the sequence on this region is species specific. Many studies have successfully reported microbial species identification using 16S rDNA sequencing (Norashirene et al., 2013; Okolie et al., 2013; Garnica-de et al., 2014). However, this technique is complicated, containing many steps, i.e., single colony isolation, 16S rDNA amplification, DNA sequencing, and DNA sequence comparison analysis (O’Donnell and Gorres, 1999). Therefore, it may not be suitable for forensic investigations in the field, for which less complex and/or quicker yielding techniques are preferred, including terminal restriction fragment length polymorphism (T-RFLP) (Tipayno et al., 2012; Giebler et al., 2014; Canfora et al., 2015), denaturing gradient gel electrophoresis (DGGE) (Matsuyama et al., 2007; Gao et al., 2015), temperature gradient gel electrophoresis (TTGE) (Batisson et al., 2009), and single-strand conformation polymorphism (SSCP) (Schmalenberger et al., 2008). These techniques are simple, by the same principle that can separate bacterial species based on sequence polymorphisms; however, ARDRA as an alternative method has been widely promoted.
Restriction analysis of ribosomal DNA, also known as amplified ribosomal DNA restriction analysis (ARDRA), is a powerful tool for identifying bacteria (Rodas et al., 2003; Krizova et al., 2006) and investigating bacterial diversity (de Albuquerque et al., 2006; Shah, 2014) – including in the study of bacterial community structure in soil and/or soil organisms (Smit et al., 1997; Kostanj sek et al., 2002; Santos et al., 2011). In the case of forensic soil identification, Horswell et al. (2002) used ARDRA to analyze the 16S rDNA of soil bacteria by detecting the fluorescent labeled terminal fragment of RFLP (T-RFLP). Later, Quaak and Kuiper (2011) statistically analyzed the T-RFLP profiles of 16S rDNA from soil bacteria to determine soil origin. DGGE technique has also been used to identify soil origin (Lerner et al., 2006). Both techniques, T-RFLP and DGGE, are reliable techniques for forensic soil identification. However, T-RFLP requires a DNA analyzer and DGGE requires difficult gradient gel preparation, both of which are troublesome. Hence, simpler methods, such as ARDRA, may be more suitable for soil origin identification in some laboratories.
The objective of this study was to use the ARDRA technique to compare soil evidence from shoes taken from a mock crime scene with soil from the mock crime scene as well as irrelevant areas, to test whether the method was reliable enough to forensically tie the soiled shoes back to the crime scene. The restriction profiles of soil bacterial 16S rDNA, either single or double digestion, were identified. Clustering analysis of restriction profiles, which categorizes similar restriction profiles within the same group, was subsequently performed, utilizing both unweighted pair group with mathematical averages (UPGMA) and Principal Coordinated Analysis (PCoA) methods, in order to examine the origin of soil samples.
MATERIAL AND METHODS
Soil sampling
A mock crime scene (10x10 m) was set up at Khon Kaen University, Khon Kaen, Thailand. Soil samples (each 10x10x5 cm) were collected from this area by random sampling. Five samples (KKU1-KKU5) were taken directly from the mock crime site, two samples (KKU6-KKU7) were taken from nearby the mock crime site, and one sample (KKU8) was soil evidence taken directly from shoes worn by a volunteer who walked within the mock crime site (Figure 1). Three samples (NM, BP, and TP) were taken from three irrelevant urban areas distant from the mock crime scene: Muang District (NM), Ban Ped District (BP) and Tha Phra District (TP) of Khon Kaen Province. The soil samples were examined visually to classify physical characteristics. KKU1 to KKU8 and TP samples were black-brown loam, while black loam was observed at NM.
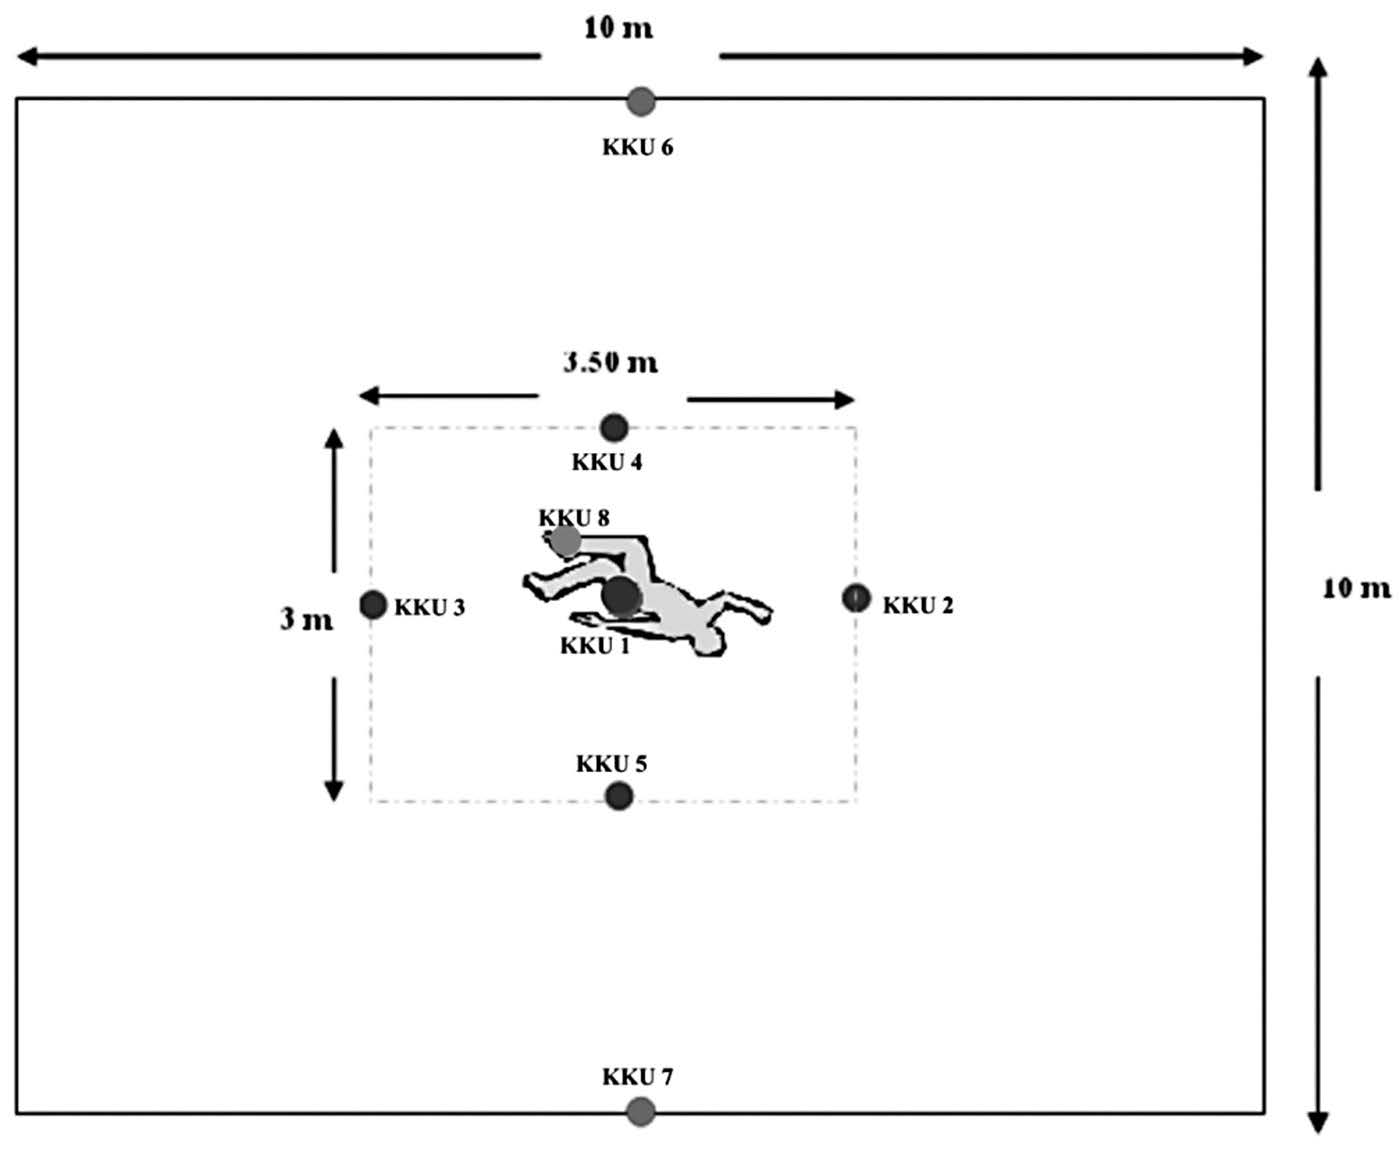
Figure 1. Location of soil samples from the simulation site.
DNA extraction
DNA was extracted from soil bacterium using the NucleoSpin® kit (Macherey-nagel, Germany) according to the manufacturer’s instruction. Briefly, 500 mg of soil sample was added to the NucleoSpin® Bead Tube. Lysis buffer was subsequently added, mixed, and spun down to precipitate the contaminants. The supernatant was filtered through NucleoSpin® Inhibitor Removal Column. The filtrate was then adjusted for binding conditions, before being loaded onto the binding column. The binding column was centrifuged and washed several times. Centrifugation was then performed to dry the binding column. The binding DNA was finally eluted from the column. DNA concentration was determined by Nanodrop (Bio-Active, Thailand), whilst the size of DNA was investigated by gel electrophoresis on 1% agarose.
Amplification of soil bacterium 16S rDNA
The extracted DNA was then used as a template for 16S rDNA amplification. The length of approximately 1.4 kb was expected to amplify using universal 16S rDNA primer pair: forward primer FAM63f (5’-CAG GCC TAA CAC ATG CAA GTC-3’) and reverse primer 1389r (5’-ACG GGC GGT GTG TAC AAG-3’), as described by Quaak and Kuiper (2011). The PCR reaction containing 50 ng bacterial DNA, 0.4 μM of each forward and reverse primer, and 1X PCR Mastermix was prepared. Sterile deionized water was then added to achieve a total volume of PCR reaction of 50 μl. The PCR condition was set with initial denaturation at 94°C for 2 min, followed by 30 cycles of denaturation at 94°C for 1 min, annealing at 57°C for 1 min and extension at 72°C for 2 min. The final extension step was set at 72°C for 10 min. The PCR products were next examined on 1.5% agarose gel to ensure that the PCR reaction was successful. The rest of the PCR products were separated by agarose gel electrophoresis. The PCR products were excised from the agarose gel. DNA extraction from the agarose gel was performed by NucleoSpin® Gel and PCR Clean-up (Macherey-Nagel, Germany).
Restriction analysis
The purified PCR product was single digested by FastDigest enzymes, including RsaI, MboI, and HindIII (Thermo Scienctific, Lithuania). The digestion procedure followed the manufacturer’s instructions. Briefly, the reaction of purified 20 μl PCR product, 2 μl FastDigest enzyme, 2 μl 10xFastDigest buffer, and 6 μl of distilled water was incubated at 37°C for 5 min. For double digestion, 2 μl of FastDigest enzymes RsaI and MboI (1 μl each) were used in the reaction mixture containing 20 μl PCR product, 2 μl 10xFastDigest buffer, and 6 μl distilled water. The reaction was then incubated at 37°C for 10 min. After digestion, the aliquot of reaction (10 μl) was taken to perform gel electrophoresis on 3% agarose (NuSieve® 3:1 Agarose) to analyze fragmented difference. The gel was stained with ethidium bromide (10 mg/ml) and the profiles were visualized and photographed by Gel Documentation (Bio-Active, Thailand).
Cluster analysis
The 16S rDNA restriction profiles of all samples were compared manually. The presence and absence of DNA bands detected from each sample were designated as 1 and 0, respectively. Clustering analysis was performed by dendrogram and Principal Coordinated Analysis. The matrix of similarity coefficients was calculated by NT-SYS program and then the matrix was transformed to make a dendrogram, using an unweighted pair group with mathematical averages algorithm. The accuracy of the dendrogram indicated by the copenetic correlation was also analyzed. Principal Coordinated Analysis was conducted by a covariance matrix with data standardization by GENALEX 6.3 software (Peakall and Smouse, 2006)
RESULTS
16S rDNA amplification
The bacterial DNAs from 11 soil samples were used as template for 16S rDNA amplification. The size of the PCR product was 1.4 kb, which was found in all samples. The actual size of the PCR product was consistent with the expected size. Unspecific DNA was not found, except for those of smear DNAs. These results indicated successful 16S rDNA amplification from soil bacteria.
16S rDNA restriction profiles
The purified PCR products of 16S rDNA were digested by restriction enzyme. Single digestion by each of three restriction enzymes – RsaI, MboI, and HindIII –was investigated. No restriction fragments were observed after digestion with HindIII, indicating that XhaI does not have a restriction site in the sequences of these soil bacterial 16S rDNAs (data not shown). The restriction profiles of bacterial 16S rDNA generated by RsaI, MboI, and RsaI+MboI digestion are shown in Figure 3. Most of the DNA fragments observed by RsaI digestion were 150 to 500 bp. For MboI digestion, the obviously evident DNA fragments were 200-700 bp; the smear of DNA fragments sized above 1,000 bp may possibly have resulted from incomplete digestion by MboI. In addition, the trace of genomic DNA template from PCR products cleaved by restriction enzyme may have caused the appearance of some bands over 1,400 bp. Interestingly, the smear band disappeared when double digestion by RsaI+MboI was performed. The DNA fragments produced by RsaI+MboI digestion were mostly less than 500 bp. In addition, double digestion produced more DNA bands than the single digestion.
Cluster analysis
Dendrogram. The 16S rDNA restriction profiles produced by either single or double digestion of the eleven soil samples were compared for genetic relatedness by clustering analysis with the UPGMA method. The similarity indexes of soil samples analyzed from the restriction profiles of RsaI, MboI and RsaI+MboI ranged from 0.30 to 1.00, 0.16 to 1.00, and 0.18 to 1.00, respectively. The dendrograms showed that the restriction profiles of the soil samples were clustered into three groups (Figure 4). Group 1 contained samples (KKU1-KKU8) taken from the mock crime scene. NM and BP were in group 2, while TP was separately placed in group 3. Interestingly, the samples taken from the irrelevant areas were clustered in different groups than the mock crime scene samples. The accuracy of the constructed dendrogram was evaluated by cophenetic correlation (r) analysis. The r values of the RsaI, MboI, and RsaI+MboI digested profiles were 0.9740, 0.9977, and 0.9671, respectively. Theoretically, the positive r values are close to 1.0000, indicating correspondence between the correlation coefficient and similarity coefficient values. Therefore, the constructed dendrograms were acceptable.
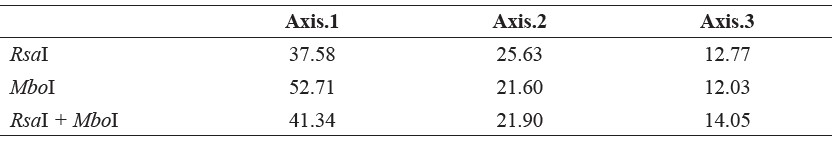
Principal Coordinated Analysis (PCoA). Principal Coordinated Analysis can provide more insight into genetic clustering among the studied restriction profiles. The PCoA constructed from the RsaI profile showed that the group of KKU1-KKU8 was segregated from NM, BP, and TP on axis 1, which explained 37.58% of the variation. Interestingly, axis 2, with percentage variation of 25.63%, separated the KKU1-KKU8 group into two clusters: KKU1-KKU3 and KKU4-KKU8 (Figure 4a). In addition, TP was split from NM and BP on axis 3, which explained 12.77% of the variation (Figure 4b). Axis 1 and 3 of the PCoA generated from the MboI profile exhibited rather similar clustering as the PCoA from RsaI,while KKU1-KKU4 and KKU5-KKU8 were distantly located in the plot on axis 2. The variances of distance matrix of axes 1, 2, and 3 were 52.71%, 21.60% and 12.03%, respectively (Figure 4b). The PCoA generated from the RsaI+MboI profile indicated genetic separation of the KKU group and the remaining samples (NM, BP, and TP) on axis 1, which explained variation of 41.34%. The TP was located higher up on the plot, with percentage variation of 21.09%, whereas KKU3, KKU4, NM, and BP were separated from the remaining samples on axis 3, which explained 14.05% of the variation (Figure 4c). The PCoA results were generally consistent with the dendrogram result, in which three groups were identified: KKU1-KKU8; NM and BP; and TP.
Table 1. Percent variation on axes 1, 2, and 3 from Principal Coordinated Analysis (PCoA) constructed by restriction profile.
DISCUSSION
In this study, soil evidence from shoes (KKU8) was compared with soil samples taken from the mock crime site (KKU1-KKU5), an area nearby the mock crime site (KKU6, KKU7), and irrelevant areas distant from the mock crime site (NM, BP, TP) using ARDRA technique. DNA from the soil bacterial community were extracted from each soil sample and then the bacterial 16S rDNA sequences were amplified. Amplicons were digested by either single or double digestion of restriction enzymes, HindIII, RsaI, and MboI, and their fingerprints were analyzed by clustering method. Earlier studies reported that 16S rDNA sequences of soil bacteria had no HindIII restriction site, therefore the 16S rDNA sequences from the most commonly found soil bacteria, e.g., Actinomyces (Accession number: AB042784) and Bacillus (Accession number: EF206345) were in silico digested with HindIII using RestrictionMapper program. We also found no HindIII restriction site (data not shown), which might be explained by the absence of a HindIII restriction site. In contrast, RsaI and MboI were able to digest soil bacterial 16S rDNA sequences, producing fragment sizes less than 500 bp by RsaI digestion and bigger than 500 bp by MboI digestion. Our results corresponded to a previous study that found the size of RsaI digested fragments to be mostly less than 500 bp (Urakawa et al., 1997). Moreover, a previous study demonstrated that streptococcus species could be identified by RFLP analysis using a combination of restriction enzymes (Barsotti et al., 2002). The 16S rDNA profiles were also investigated by RsaI+MboI digestion, which produced fragments concentrated in sizes less than 500 bp, with fragments less than 200 bp clearly visible. Interestingly, these small fragments were hardly seen in the RsaI or MboI digested profiles, suggesting that double digestion produced more DNA fragments of smaller size, increasing the power of discrimination among bacterial DNA fingerprints.
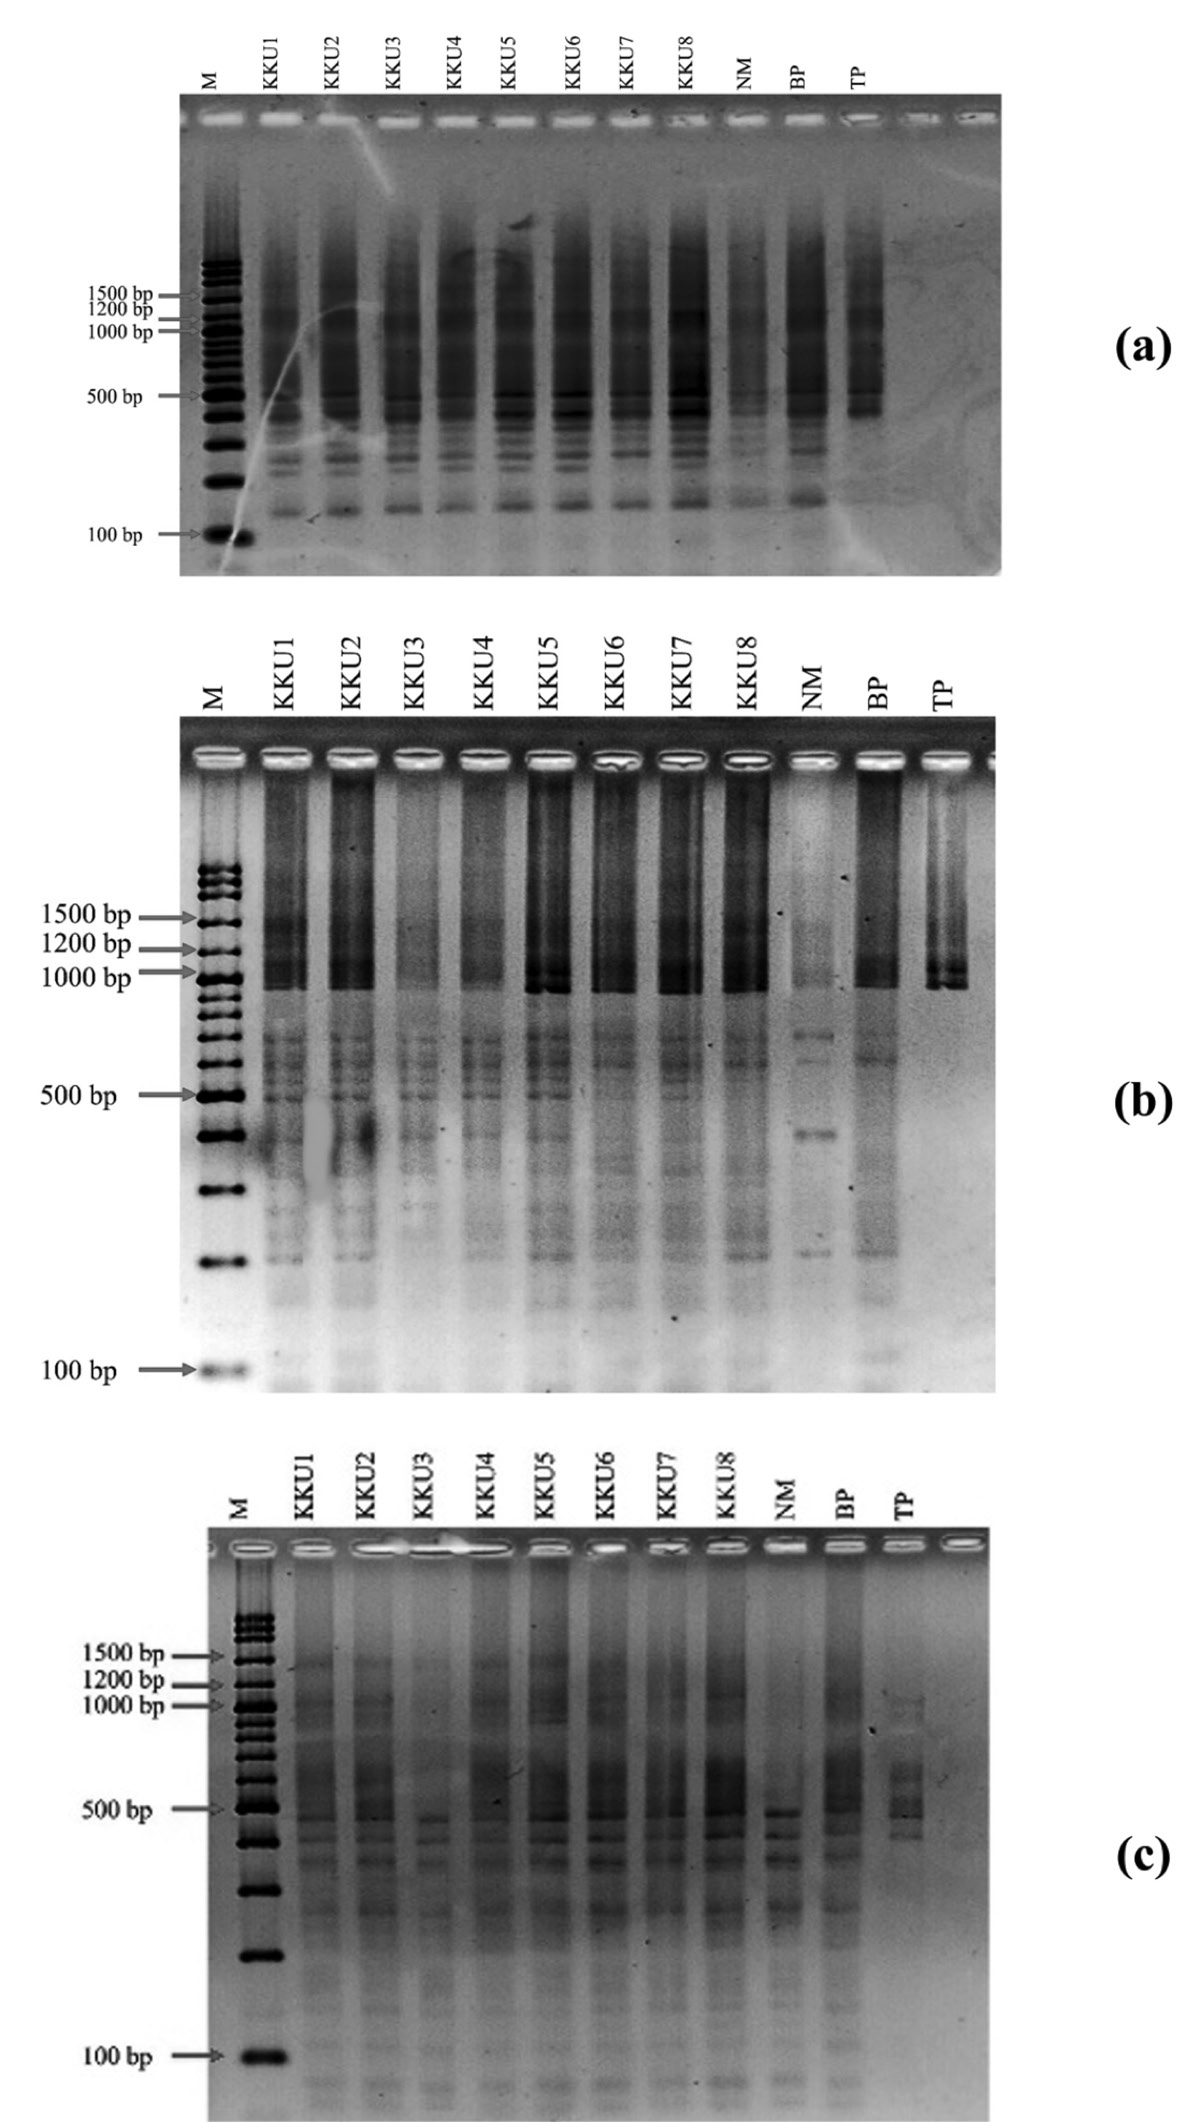
Figure 2. The restriction profiles of soil bacterial 16S rDNA produced by single digestion of RsaI (a), MboI (b), and double digestion of RsaI+ MboI (c).
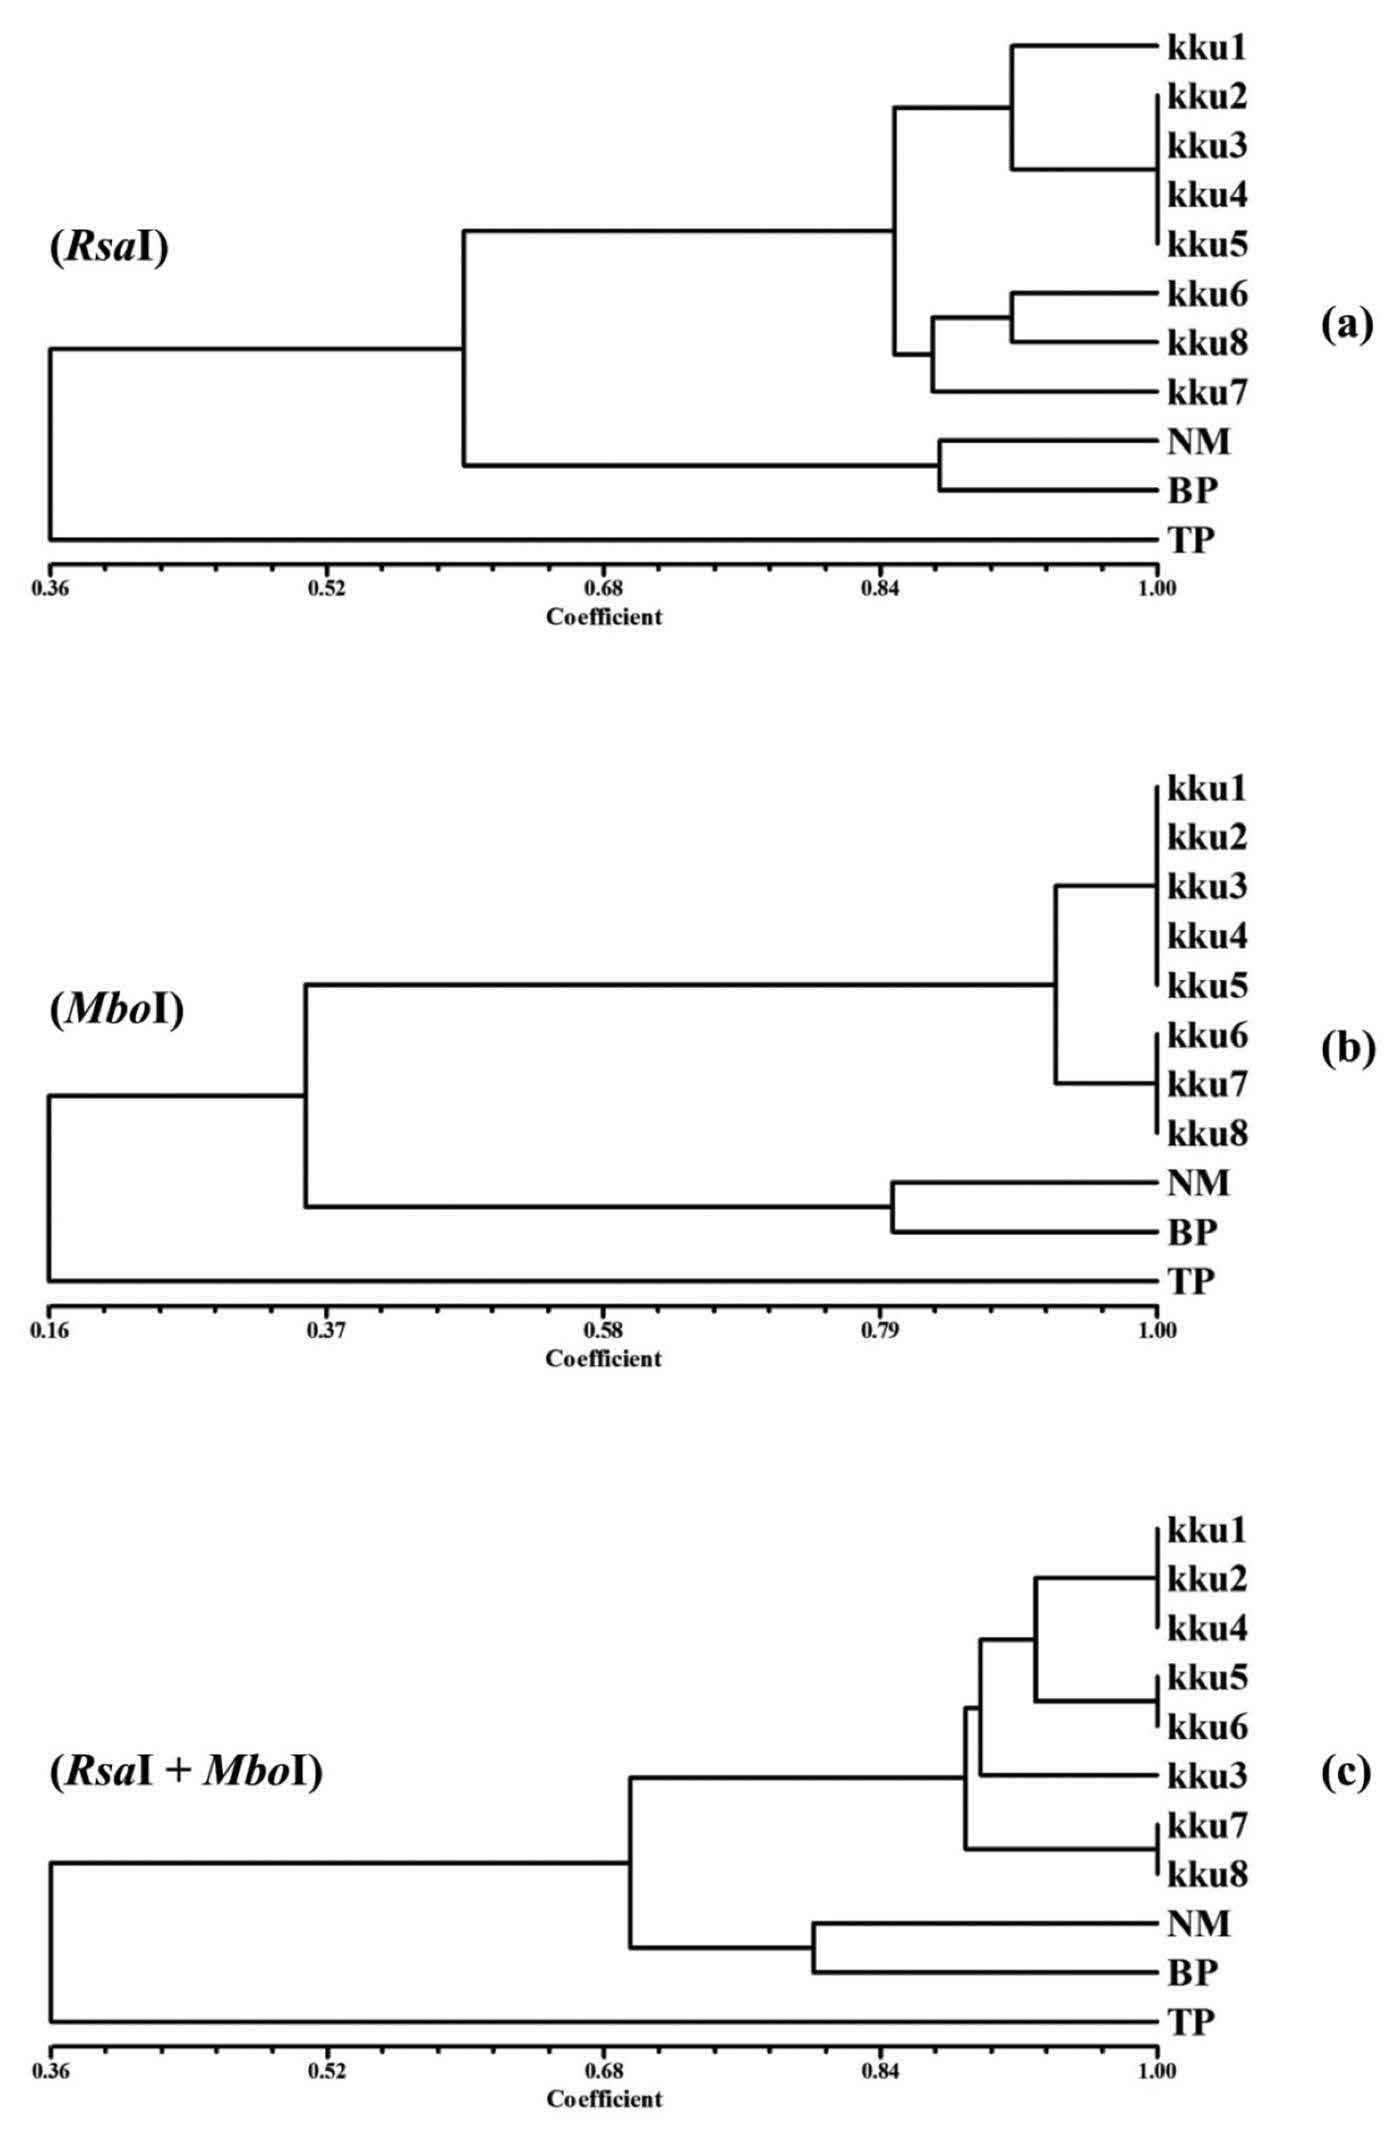
Figure 3. Genetic similarity of restriction profiles retrieved from RsaI (a), MboI (b), and RsaI+MboI (c) digestion of 16S rDNA bacterial community in soil samples.
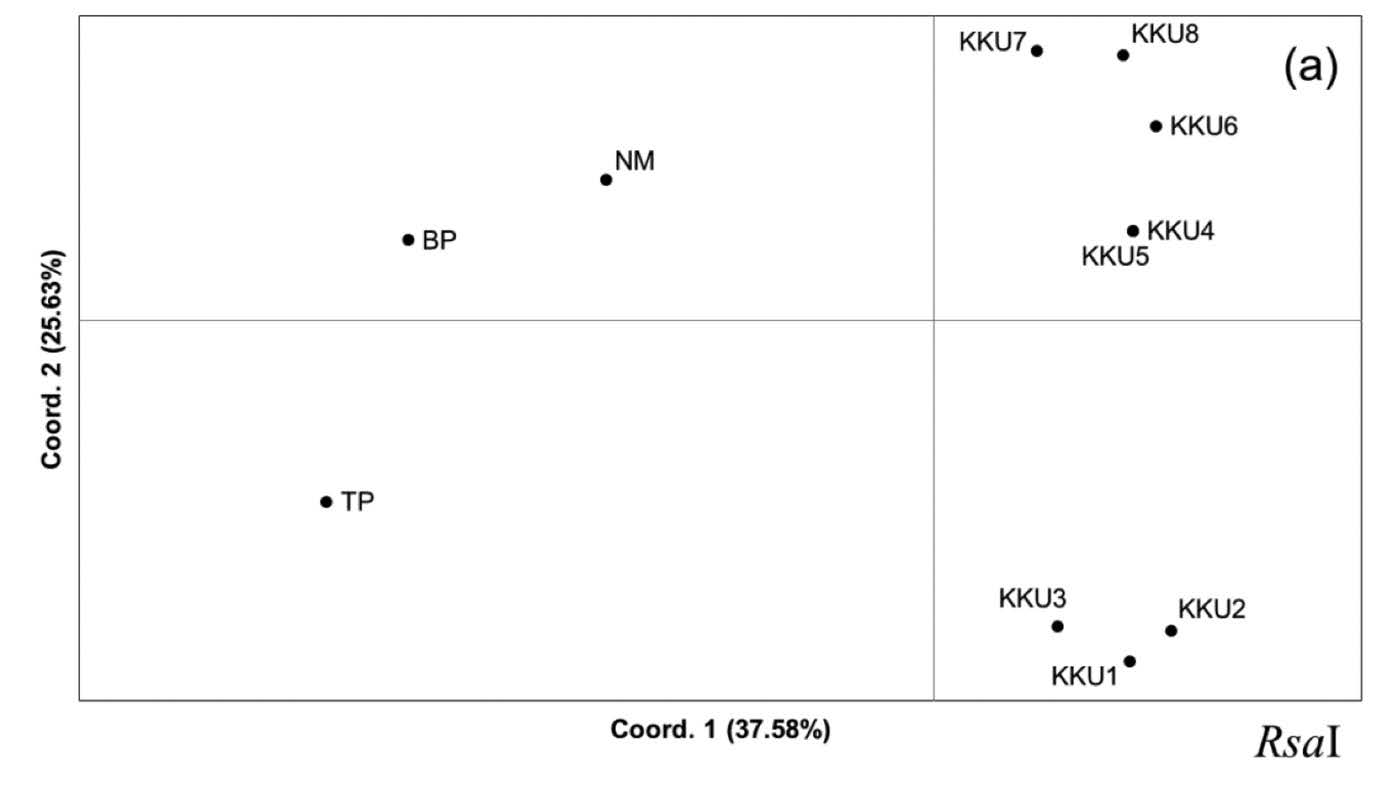
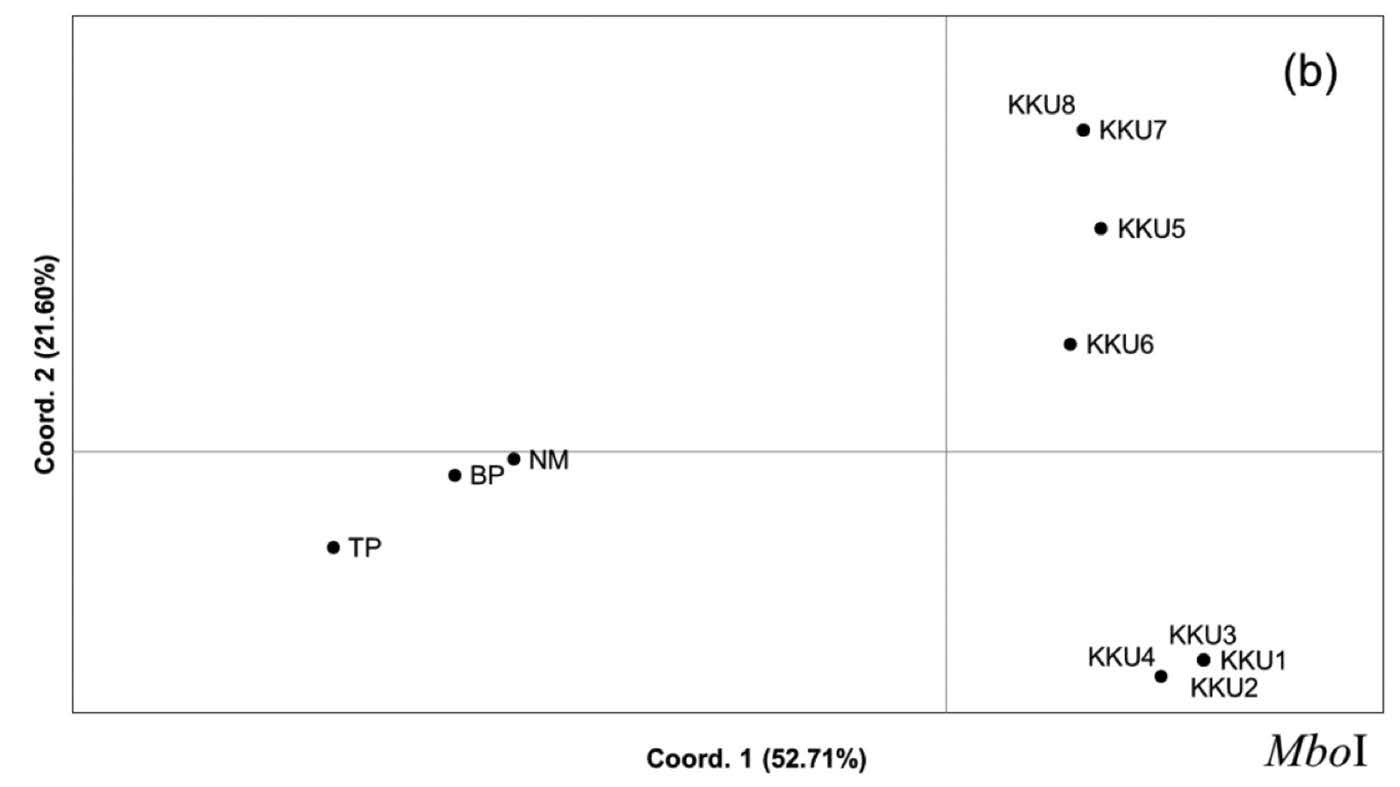
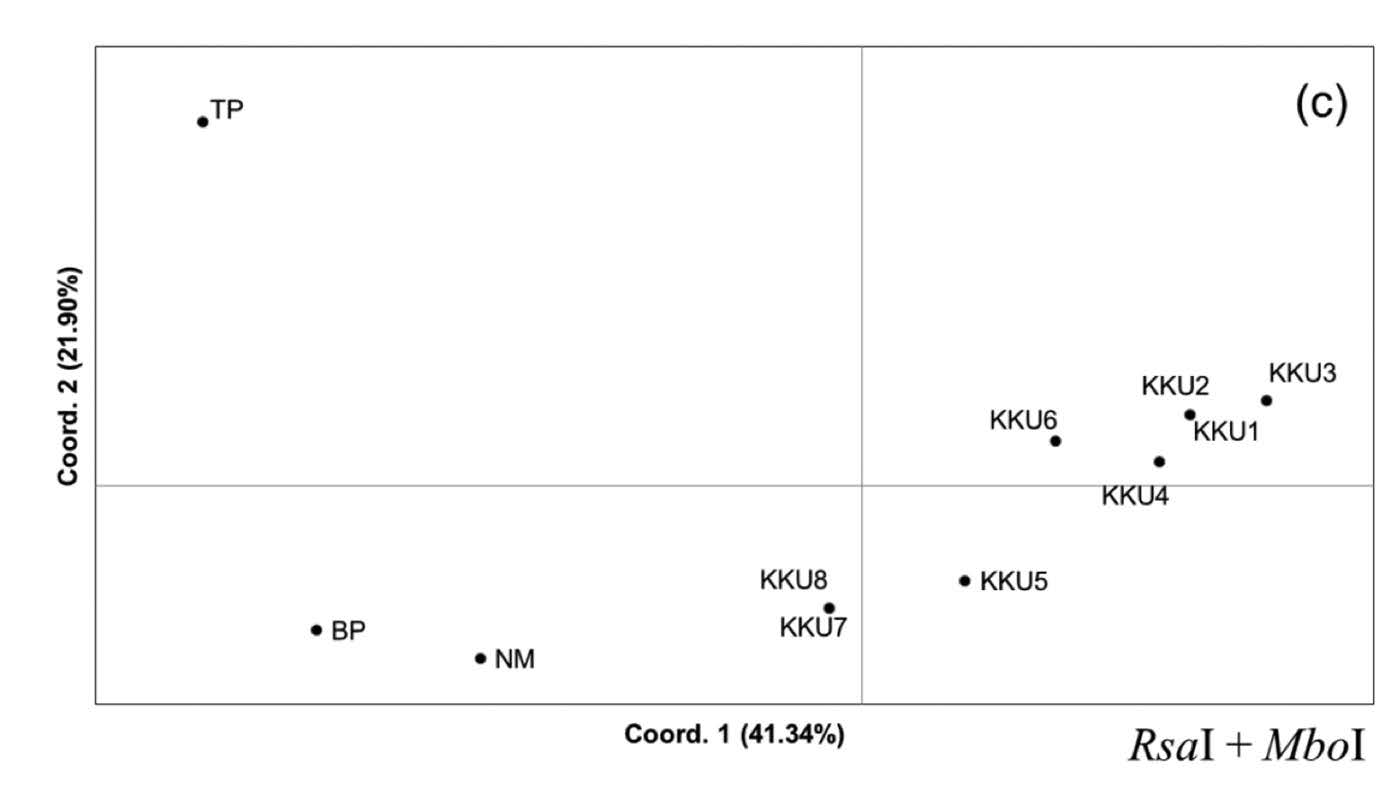
Figure 4. Principal Coordinated Analysis (PCoA) was performed using a covariance matrix with data standardization. Two-dimensional plots of the PCoA between axes 1 and 2 and between axes 1 and 3, constructed from the restriction profiles of RsaI, MboI, and RsaI+MboI, are depicted in Figures 5a, 5b, and 5c, respectively.
To determine the origin of the soil samples, similarities of each digested DNA profile were calculated and depicted by dendrogram. All digested profiles showed three groups of soil samples, with soil samples from the mock crime scene (KKU1-KKU8) strikingly clustered together in the same group. Interestingly, even the TP and KKU samples, which had the same physical characteristics, were categorized to different groups. These results indicated that the origin of soil could be identified by determining the soil bacterial community using ARDRA technique.
The accuracy of each constructed dendrogram was then evaluated for cophenetic correlation (r) value. The r values showed good construction of all dendrograms. The r of the dendrogram constructed by the MboI digested profile had the highest value, suggesting that single digestion of soil bacterial 16S rDNA was sufficient to identify the origin of soil evidence. When the present results using ARDRA were compared with a similar study on forensic soil investigation, but using DGGE (Sanachai et al., 2015), both techniques were able to categorize soil samples to three groups, with similar members in each group. Hence, these two methods used to examine the 16S rDNA profiles of soil bacterial community are equally effective on soil origin investigation. In addition, Smalla et al. (2007) compared 16S rDNA profiles of soil bacteria obtained by DGGE, T-RFLP, and SSCP and reported identical results from each method.
The ARDRA technique can be applied to other regions of DNA, in addition to 16S rDNA – e.g., internal transcribed spacer (ITS) – in forensic soil investigations. A previous study has shown that two genotypes of Fomes fomentarius were discriminated by ITS-RFLP analysis (Judova et al., 2012). In addition, Viaud et al. (2000) successfully analyzed the diversity of soil fungi by restriction analysis of ITS. Therefore, a combination of ITS-RFLP and ARDRA might be employed to enhance the efficiency of soil identification, and warrants future investigation. This study examined the clustering of 16S rDNA restriction profiles by dendrogram and PCoA. Previously, Bevivinot et al. (2014) successfully used these analyses to differentiate soil microbial communities by their DGGE pattern. Observed results in this study showed identical results generated from both algorithms in which three groups of soil samples were specified. The soil evidence from shoes was clustered in the same group as those at the mock crime site and nearby the mock crime site, reflecting the similar origin of soil samples. Hence, this study has proven that ARDRA is a reliable method to link the forensic soil evidence back to its origin by comparing soil bacterial community structure from its 16S rDNA restriction profiles. Compared to the DGGE method (Sanachai et al. 2015), ARDRA is simpler and less time consuming. Therefore, ARDRA offers an alternative method for forensic soil identification.
REFERENCES
Barsotti, J.D., D. Decoret, and F.N.R. Renaud. 2002. Identification of Streptococcus mitis group species by RFLP of the PCR-amplified 16S-23S RDNA intergenic spacer. Research in Microbiology. 153: 687-691.
Batisson, I., O. Crouzet, P. Besse-Hoggan, M. Sancelme, J.F. Mangot, C. Mallet, and J. Bohatier. 2009. Isolation and characterization of mesotrione-degrading Bacillus sp. from soil. Environmental Pollution. 157: 1195-1201.
Bevivino, A., P. Paganin, G. Bacci, A. Florio, M.S. Pellicer, M.C. Papaleo, A. Mengoni, L. Ledda, R. Fani, A. Benedetti, and C. Dalmastri. 2014. Soil bacterial community response to differences in agricultural management along with seasonal changes in a Mediterranean region. PLOS ONE. 9: 1-14.
Bull, P.A., A. Parker, and R.M. Morgan. 2006. The forensic analysis of soil and sediment taken from the cast of a footprint. Forensic Science International. 162: 6-12.
Canfora, L., G.L. Papa, L.V. Antisari, G. Bazan, C. Dazzi, and A. Benedetti. 2015. Spatial microbial community structure and biodiversity analysis in “extreme” hypersaline soils of a semiarid Mediterranean area. Applied Soil Ecology. 93: 120-129.
Cengiz, S., A.C. Karaca, I. Cakir, H.B. Uner, and A. Sevindik. 2004. SEM-EDS analysis and discrimination of forensic soil. Forensic Science International. 141: 33-37.
De Albuquerque, J.P., F.F. da Mota, I. von der Weid, and L. Seldin. 2006. Diversity of Paenibacillus durus strains isolated from soil and different plant rhizosperes
evaluated by ARDRA and gyrB-RFLP analysis. European Journal of Soil Biology. 42: 200-207.
Gao, Y.C., J.N. Wang, S.H. Guo, Y.L. Hu, T.T. Li, R. Mao, and D.H. Zeng. 2015. Effects of salinization and crude oil contamination on soil bacteria community structure in the Yellow River Delta region, China. Applied Soil Ecology. 86: 165-173.
Garnica-de, M.L., J.A. Saez-Nieto, J.A. Santos, and C. Gonzolo. 2014. Diversity of gram-negative catalase-negative cocci in sheep bulk tank milk by comparative 16S rDNA sequence analysis. International Diary Journal. 34: 142-145.
Giebler, J., L.Y. Wick, H. Harms, and A. Chatzinotas. 2014. Evaluating T-RFLP protocols to sensitively analyse the genetic diversity and community changes of soil alkane degrading bacteria. European Journal of Soil Biology. 65: 107-113.
Horswell, J., S.J. Cordinger, E.W. Maas, T.M. Martin, B.W. Sutherland, T.W. Speir, B. Nogales, and A.M. Osborn. 2002. Forensic comparison of soils by bacterial community DNA profiling. Journal of Forensic Science. 47: 350-353.
Judova, J., K. Dubikova, S. Gaperova, J. Gaper, and P. Pristas. 2012. The occurrence and rapid discrimination of Fomes fomentarius genotypes by ITSRFLP analysis. Fungal Biology. 116: 155-160.
Kostanjsek, R., J. Strus, and G. Avgustin. 2002. Genetic diversity of bacteria associated with the hindgut of the terrestrial crustacean Porcellio scaber (Crustacea: Isopoda). FEMS Microbiology Ecology. 40: 171-179.
Krizova, J., A. Spanova, and B. Rittich. 2006. Evaluation of amplified ribosomal DNA restriction analysis (ARDRA) and species-specific PCR for identification of Bifidobacterium species. Systematic and Applied Microbiology. 29: 36-44.
Lauber, C.L., M.S. Strickland, M.A. Bradford, and N. Fierer. 2008. The influence of soil properties on the structure of bacterial and fungal communities across land-use types. Soil Biology and Biochemistry. 40: 2407-2415.
Lerner, A., Y. Shor, A. Vinokurov, Y. Okon, and E. Jurkevitch. 2006. Can denaturing gradient gel electrophoresis (DGGE) analysis of amplified 16S rDNA of soil bacterial populations be used in forensic identification?. Soil Biology and Biochemistry. 38: 1188-1192.
Massenssini, A.M., V.H.A. Bonduki, C.A.D. Melo, M.R. Totola, F.A. Ferreira, and M.D. Costa. 2015. Relative importance of soil physic-chemical characteristics and plant species identity to the determination of soil microbial community structure. Applied Soil Ecology. 91: 8-15.
Matsuyama,T., Y. Nakajima, K. Matsuya, M. Ikenaga, S. Asakawa, and M. Kimura. 2007. Bacterial community in plant residues in a Japanese paddy field estimated by RFLP and DGGE analyses. Soil Biology and Biochemistry. 39: 463-472.
Norashirene, M.J., H.U. Sarah, M.H. Khairiyah, and S. Nurdiana. 2013. Biochemical characterization and 16S rDNA sequencing of lipolytic thermophiles from Selayang hot spring, Malaysia. IERI Procedia. 5: 258-264.
O’Donnell, A.G., and H.E. Gorres. 1999. 16S rDNA methods in soil microbiology. Current Opinion in Biotechnology. 10: 225-229.
Okolie, P.I., C.N. Opara, E.C. Emerenini, and S.V.A. Uzochkwu. 2013. Evaluation of bacterial diversity in palm wine by 16S rDNA analysis of community DNA. Nigerian Food Journal. 31: 83-90.
Peakall, R. O. D., and P. E. Smouse. Genalex 6: genetic analysis in Excel. 2006. Population genetic software for teaching and research. Molecular Ecology Notes. 6: 288-295.
Quaak, C.A.F., and I. Kuiper. 2011. Statistical data analysis of bacterial t-RFLP profiles in forensic soil comparisons. Forensic Science International. 210: 96-101.
Rodas, A.M., S. Ferrer, and I. Pardo. 2003. 16S-ARDRA, a tool for identification of lactic acid bacteria isolated from grape must and wine. Systematic and Applied Microbiology. 26: 412-422.
Sanachai, A., S. Katekaew, and K. Lomthaisong. 2015. Forensic soil investigation from the 16S rDNA profiles of soil bacteria obtained by denaturing gradient gel electrophoresis. Chiang Mai Journal of Science. (In press)
Santos, M.J., J.P., Sousa, I., Tiago, A. Verissimo, and M.F. Lemos. 2011. Amplified ribosomal DNA restriction analysis as a routine tool to assess toxicant driven changes in hindgut bacterial populations of Porcellio dilatatus (Crustacea: Isopoda). Journal of Environmental Monitoring. 13: 2102-2104.
Schmalenberger, A., C.C. Tebbe, M.A. Kertesz, H.L. Drake, and K. Kusel. 2008. Two-dimensional single strand conformation polymorphism (SSCP) of 16S rRNA gene fragments reveals highly dissimilar bacteria communities in an acidic fen. European Journal of Soil Biology. 44: 495-500.
Shah, M. 2014. Amplified ribosomal DNA restriction analysis as a tool to characterize microbial community structure of activated sludge of common effluent treatment plant. International Journal of Environmental Bioremediation and Biogegradation. 2: 197-201.
Smalla, K., M. Oros-Sichler, A. Milling, H. Heuer, S. Baumgarte, R. Becker, G. Neuber, S. Kropf, A. Ulrich, and C.C. Tebbe. 2007. Bacterial diversity of soils accessed by DGGE, T-RFLP and SSCP fingerprints of PCR-ampified 16S rRNA gene fragments: Do the different methods provide similar results?. Journal of Microbiological Methods. 69: 470-479.
Smit, E., P. Leeflang, and K. Wernars. 1997. Detection of shifts in microbial community structure and diversity in soil caused by copper contamination using amplified ribosomal DNA restriction analysis. FEMS Microbiology Ecology. 23: 249-261.
Sugita, R., and Y. Marumo. 1996. Validity of color examination for forensic soil identification. Forensic Science International. 83: 201-210.
Swindles, G.T., and A. Ruffell. 2009. A preliminary investigation into the use of testate amoebae for discrimination of forensic soil samples. Science and Justice. 49: 182-190.
Tipayno, S., C.G. Kim, and T. Sa. 2012. T-RFLP analysis of structural changes in soil bacterial communities in response to metal and metalloid contamination and initial phytoremediation. Applied Soil Ecology. 61: 137-146.
Urakawa, H., K. Kita-Tsukamoto, and K. Ohwada. 1997. 16S rDNA genotyping PCR/RFLP (restriction fragment length polymorphism) analysis among the family Virbionaceae. FEMS Microbiology Letters. 152: 125-132.
Viaud, M., A. Pasquier, and Y. Brygoo. 2000. Diversity of soil fungi studied by PCR-RFLP of ITS. Mycological Research. 104: 1027-1032.
Venus Naknim1, Wibhu Kutanan2 and Khemika Lomthaisong1*
1 Forensic Science Program, Faculty of Science, Khon Kaen University, Khon Kaen 40002, Thailand
2 Department of Biology, Faculty of Science, Khon Kaen University, Khon Kaen 40002, Thailand
*Corresponding author. E-mail: khemlo@kku.ac.th
Total Article Views