 ISSN: 2822-0838 Online

Analysis of Catalyst Ink Compositions for Fabricating Membrane Electrode Assemblies in PEM Fuel Cells
Korawat Wuttikid, Nat Worayos and Konlayut Punyawudho*Published Date : 2017-10-01
DOI : https://doi.org/10.12982/CMUJNS.2017.0022
Journal Issues : Number 4 ,October-December 2017
ABSTRACT
Determining the optimal catalyst ink formula for manufacturing membrane electrode assemblies (MEAs) in proton exchange membrane (PEM) fuel cells is important to optimizing their performance. The proper catalyst inks maintain the optimal balance of mass and ion transport in the catalyst layers. Catalyst inks are composed mainly of a carrier, Nafion solution, and a Pt/C catalyst. We investigated the optimal catalyst ink formula by varying these components during fabrication of MEAs by 20-kHz ultrasonic spraying. Various carriers (isopropyl alcohol (IPA), tetrahydrofuran (THF), and ethanol) and Nafion concentrations were investigated when using Pt/C 20% catalyst with a constant Pt loading of 0.3 mg/cm2. The catalyst layers of the fabricated MEAs were analyzed using both in-plane and cross-sectional scanning electron microscopy (SEM) images. The thickness of the catalyst layer depended on the type of carrier, with IPA, THF, and ethanol yielding thicknesses of 28, 22, and 18 μm, respectively. Polarization curves were used to determine the fuel cell performance. MEAs fabricated with ethanol preformed better than with IPA or THF; yielding a current density of 697.02 mA/cm2 at a cell potential of 0.6 V. The optimal Nafion concentration was 20, 25, and 30 wt% for ethanol, IPA, and THF, respectively.
Keywords: PEM fuel cell, Membrane electrode assembly, Carrier, Nafion
INTRODUCTION
Proton Exchange Membrane Fuel Cells (PEMFCs) are a promising and environmentally friendly technology. Since PEMFC products are the electricity and water generated from the electrochemical reaction between the supplied reactant gases (H2 and O2 or air), PEMFCs provide high efficiency and low noise. Moreover, they also operate at low temperature and pressure (Barbir, 2005).
The electrochemical reactions in PEMFCs take place in the Membrane Electrode Assembly (MEA), their most vital component. Normally, MEAs are fabricated by coating the electrode or catalyst layers on both sides of the electrolyte membrane surface. A three-region boundary, comprising the pores, ionomer, and catalyst regions, is the key factor determining the mass and ion transport and, consequently, PEMFC performance. The parameters influencing the catalyst layer morphology and three-region boundary are the catalyst coating technique and the catalyst ink components, which normally comprise the carrier, ionomer, and catalyst. The carrier determines the pore shape (the first region of the three-region boundary) in the catalyst layers (Shin et al., 2002; Saha et al., 2010), because when the catalyst ink is deposited on the membrane surface, the carrier suddenly evaporates out of the catalyst layer, leaving the pores behind. The amount of ionomer (i.e., Nafion solution) and catalyst affects the second and the third regions of the three-region boundary. Although the catalyst is an electron conductor and is beneficial for increasing the kinetic reaction rate, excessive concentrations lead to mass transport problems in the catalyst layers (Huang et al., 2012; Ahn et al., 2013). Nafion residing in catalyst layers facilitates proton conductivity and retains moisture. But excessive Nafion causes mass transport resistance (Passos et al. 2006; Lee and Hwang 2008; Huang et al. 2012; Ahn et al. 2013; Punyawudho et al. 2014). Therefore, balancing the three-region boundary by varying the proportions of catalyst layer components is critical to obtaining the highest catalyst utilization and PEMFC performance. When different carrier types are mixed with Nafion, the catalyst inks can become one of three states: solution, colloid, or precipitate state. These states are depending on the dielectric constant of the carrier (Shin et al., 2002; Therdthianwong et al., 2010). Each state affects the catalyst layer morphology, particularly the agglomeration of catalysts.
Thus, the choice of carrier and Nafion concentration determines the catalyst layer morphology and, consequently, PEMFC performance. Pollet (2009) applied an ultrasonic-spray coating technique to fabricate MEAs. However, information on the most appropriate carriers to use with Nafion in this coating technique is lacking. Therefore, this research aimed to optimize MEA performance by determining a suitable carrier with Nafion to fabricate MEA by ultrasonic spray technique.
MATERIALS AND METHODS
Membrane electrode assembly fabrication
To fabricate the MEA, the catalyst inks were prepared by mixing 20% Pt/C (Premetek), Nafion solution (5% v/v, DuPont), and three types of carriers (ethanol, tetrahydrofuran (THF), and isopropyl alcohol (IPA)). These three carriers were selected based on their properties as reported elsewhere (Shin et al., 2002; Therdthianwong et al., 2010; Saha et al. 2010; Millington et al., 2011). The catalyst inks are colloids for dielectric constants between 3.0 and 10.0 and solutions for dielectric constants greater than 10 (Table 1).
Table 1. The physical properties of carriers.
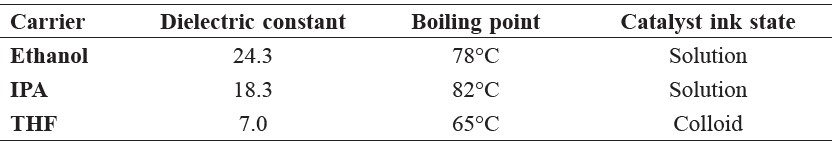
The amount of Nafion was varied (20, 25, 30, or 35 wt%) with each carrier type. Pt loading was controlled at 0.3 mg/cm2. All components were put into a beaker and sonicated for 30 minutes. Catalyst ink was fed at a flow rate of 0.25 cm2/min though an ultrasonic nozzle that vibrated at 25 kHz. The catalyst ink was directly sprayed onto the electrolyte membrane (XL 100, DuPont), which had a reactive area of 25 cm2. The fabrication was performed in the same way for the anode and cathode, as described in more detail in Punyawudho et al. (2014). After the spraying processes, the MEAs were put into an oven at 85°C for 2 hours to evaporate the carriers and contaminants.
Single cell assembly and electrochemical testing
The MEA was sandwiched by carbon cloth gas diffusion layers (W1S1005, CeTech), followed by fiberglass-silicone composite gaskets; the three-channel serpentine flow field plates were also assembled with both anode and cathode as a single cell. A fuel cell test station (Model 890E, Scribner Associated) was used to test MEA performance. The polarization curves were obtained using the constant potential mode. The overall cell resistances were obtained during polarization. The cell temperature and humidity were set at 75°C and 95%, respectively. The hydrogen-to-air stoichiometry ratio was set at 1.2 : 2.0. To investigate the catalyst layer morphology of the MEAs, a scanning electron microscope photographed the surface and cross-sectional pieces of the catalyst layers formed by Nafion (30 wt %) with each solvent type (THF, ethanol, and IPA).
RESULTS
Morphology of catalyst layers
The catalyst layer morphologies of each MEA showed that sphere-shaped catalyst agglomerates formed on the surfaces of the catalyst layers (Figure 1). The amount and size of the catalyst agglomerates formed by THF were higher than those formed by IPA and ethanol inks.
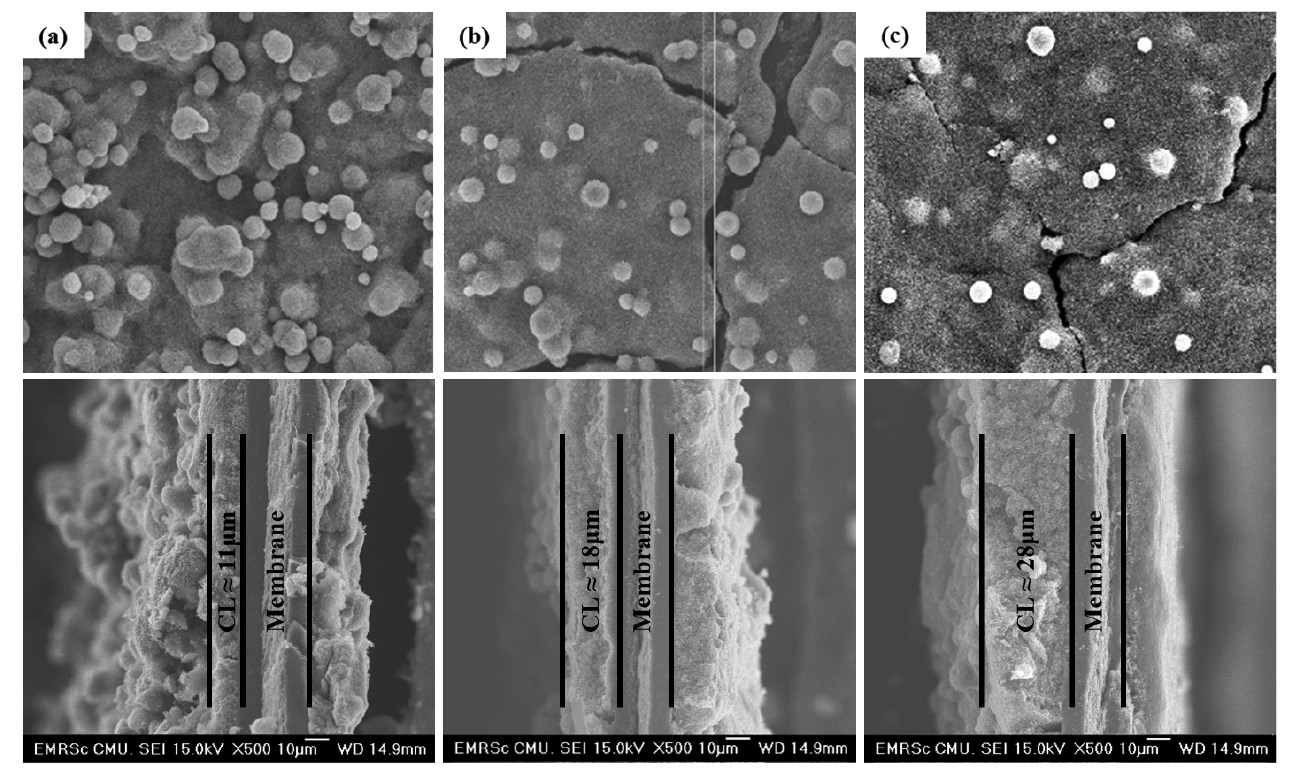
Figure 1. SEM image of the surface and cross-section of MEAs formed with the carriers: (a) THF, (b) ethanol, and (c) IPA at 500× magnification.
The cross-sectional images of MEAs fabricated with THF, ethanol, and IPA carriers are shown in Figure 1 (bottom); they are 11, 18, and 28 μm thick, respectively.
Performance testing of membrane electrode assembly
Figure 2 shows the polarization curves of MEAs fabricated by (a) IPA, (b) THF, and (d) ethanol with the different amounts of Nafion (20, 25, 30, and 35 wt%). These performances are shown on the left hand scale. The overall cell resistances were also recorded and plotted against the right hand scale. For all MEAs, as the Nafion increased, overall resistance slightly decreased.
The polarization curves of MEAs fabricated by IPA show that the current density peaked (591.03 mA/cm2) with Nafion of 25 wt% at 0.6 V (Figure 2a). Using THF as the carrier. The current density peaked at 505.18 mA/cm2 at 30 wt% (Figure 2b). Ethanol of 20 wt% yielded the highest current density (697.02 mA/cm2) (Figure 2c).
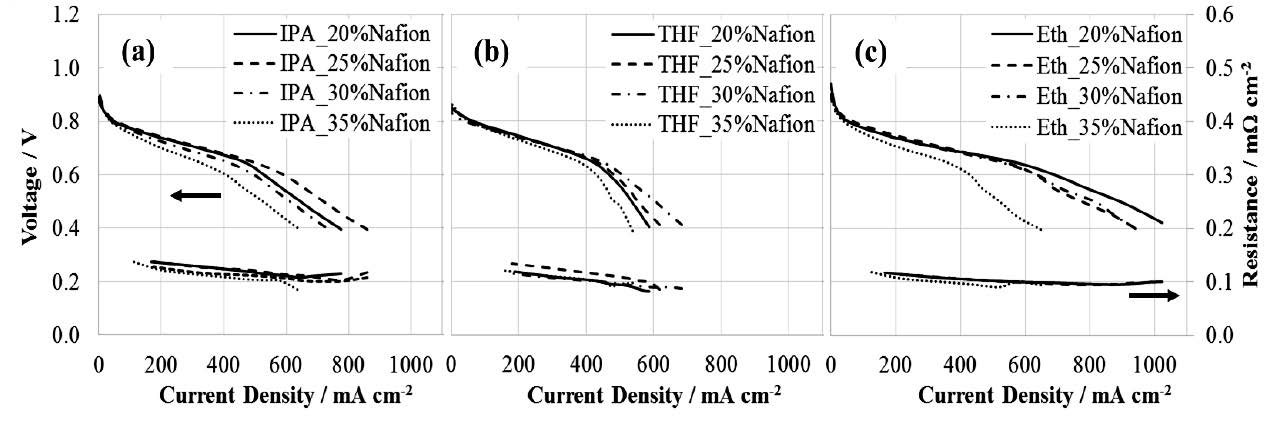
Figure 2. Polarization curves of MEAs produced from each carrier: (a) IPA, (b) THF, and (c) ethanol with different Nafion concentrations.
DISCUSSION
This study investigated the catalyst layer morphologies and polarization curves of MEAs fabricated by ultrasonic (20 kHz) spray technique using different quantities of Nafion with three different carriers – ethanol, IPA, and THF. We obtained similar catalyst clusters to Pollet (2010) – spherical with droplet sizes of 10–100 μm. The catalyst clusters formed by colloid inks were larger than those formed by solution inks, similar to Shin et al. (2002) and Saha et al. (2010). We produced agglomerations of the catalysts; THF yielded the largest agglomeration with the thinnest catalyst layer, due to its higher density and colloidal property. In contrast, the catalyst inks produced from ethanol or IPA produced thicker catalyst layers because of their solution property, which better facilitated catalyst distribution during spraying. Furthermore, their better distribution meant more void space in the catalyst layers, which directly relates to the mass transport of reactant gases and water. Excessive thickness of the catalyst layers may not be a benefit, because of the longer pathway for transporting reactive gases. However, excessive thinness of the catalyst layers could also be a drawback, because the spaces may be too small for transporting reactive gases.
We found that the optimal amount of Nafion varied by carrier. As explained by many researchers (Passos et al., 2006; Lee and Hwang, 2008; Huang et al., 2012; Ahn et al., 2013; Punyawudho et al., 2014), insufficient Nafion in the catalyst layers results in insufficient proton conductors and low catalyst utilization; excessive Nafion leads to a mass transport problem (due to increased hydrophilic capability that causes water to flood the catalyst layers) and reduced catalyst utilization (the Nafion covers and, thereby, reduces the active surfaces of the catalyst). As Nafion is an electron insulator, in excess it increased electron resistance. The optimal amount of Nafion led to the highest performance by balancing the charge, electron, and mass transportation. However, for enhancing fuel cell performance, this was not a significant factor compared to other variables, such as mass transport, water management, and charge transport over the catalyst layers.
The MEA fuel cells performed best when produced using IPA or ethanol as the carrier compared to THF. This agrees well with the SEM results that showed greater catalyst agglomeration with THF due to its colloidal property. Catalyst agglomeration reduced the Pt surface area, leading to lower fuel cell performance; solution inks (IPA or ethanol carrier) gave a higher Pt surface area and better performance, due to the greater distribution of catalyst. Of the solution inks, ethanol led to better performance, particularly at high current densities (greater than 600 mA/cm2), indicating more efficient mass transport.
We analyzed the PEM fuel cell performance using only the polarization curve from the fuel cell test station (Model 890E, Scribner Associated); the analysis would be improved, if we had intensively measured the electrochemical surface areas of CL using cyclic voltammetry.
In summary, the polarization of fuel cells fabricated using ethanol as a carrier had the highest current density of 697.02 mA/cm2 at a cell potential of 0.6 V under H2/air operation.
This experiment only studied the effect of varying the amount of Nafion with three different carriers as catalyst inks to fabricate MEAs by ultrasonic spray. This, however, is not the only factor that determines catalyst morphology, active surface areas of catalyst layers, and MEA performance; catalyst type and loading are also important. In addition, this study selected 20 wt% Pt/C for MEA fabrication, while 10, 40, 60, 80 wt% Pt/C are also available commercially. We will investigate varying this in a future study.
ACKNOWLEDGEMENTS
The authors would like to acknowledge the financial support from the Research University Network (RUN) Thailand under Energy Cluster, the National Research Council of Thailand (NRCT), and Chiang Mai University. The authors would also like to thank the Association of Thai Professionals in America and Canada (ATPAC) for their help and collaboration.
REFERENCES
Ahn, S.H., Jeon, S., and Park, H.Y. 2013. Effects of platinum loading on the performance of proton exchange membrane fuel cells with high ionomer content in catalyst layers. International Journal of Hydrogen Energy. 38(23): 9826-9834. https://doi.org/10.1016/j.ijhydene.2013.05.123
Barbir, F. 2005. PEM Fuel Cell: Theory and Practice. In Elsavier Academic Press, Burlington, USA.
Huang, T.H., Shen, H.L., Jao, T.C., Weng, F.B., and Su, A. 2012. Ultra-low Pt loading for proton exchange membrane fuel cells by catalyst coating technique with ultrasonic spray coating machine. International Journal of Hydrogen Energy. 37(18): 13872-13879. https://doi.org/10.1016/j.ijhydene.2012.04.108
Lee, D., and Hwang, S. 2008 Effect of loading and distributions of Nafion ionomer in the catalyst layer for PEMFCs. International Journal of Hydrogen Energy. 33(11): 2790-2794. https://doi.org/10.1016/j.ijhydene.2008.03.046
Millington, B., Du, S., and Pollet, B.G. 2011 The Effect of materials on proton exchange membrane fuel cell electrode performance. Journal of Power Sources. 196(21): 9013–9017. https://doi.org/10.1016/j.jpowsour.2010.12.043
Passos, R.R., Paganin, V.A., and Ticianelli, E.A. 2006. Studies of the performance of PEM fuel cell cathodes with the catalyst layer directly applied on Nafion membranes. Electrochimica Acta. 51(25): 5239-5245. https://doi.org/10.1016/j.electacta.2006.01.044
Pollet, B.G. 2009. A novel method for preparing PEMFC electrodes by the ultrasonic and sonoelectrochemical techniques. Electrochemistry Communications. 11(7): 1445-1448. https://doi.org/10.1016/j.elecom.2009.05.027
Pollet, B.G. 2010. The use of ultrasound for the fabrication of fuel cell materials. International Journal of Hydrogen Energy. 35(21): 11986-12004. https://doi.org/10.1016/ j.ijhydene.2010.08.021
Punyawudho, K., Blom, D.A., Van Zee, J.W., and Monnier, J.R. 2010. Comparison of different methods for determination of Pt surface site concentrations for supported Pt electrocatalysts. Electrochimica Acta. 55(19): 5349-5356. https://doi.org/10.1016/j.electacta.2010.04.062
Punyawudho, K., Vorayos, N., Zhang, Y., Shimpalee, S., and Monnier, J.R. 2014. Identification and quantification of performance losses for PEM fuel cells as determined by selective chemisorption and ESA measurements. International Journal of Hydrogen Energy. 39(21): 11110-11119. https://doi.org/10.1016/j.ijhydene.2014.04.187
Saha, Sudan, M., Paul, D.K., Peppley, B.A., and Karan, K. 2010 Fabrication of catalyst-coated membrane by modified decal transfer technique. Electrochemistry Communications. 12(3): 410-413. https://doi.org/10.1016/ j.elecom.2010.01.006
Shin, S.J., Lee, J.K., and Ha H.Y. 2002. Effect of the catalytic ink preparation method on the performance of polymer electrolyte membrane fuel cells. Journal of Power Sources. 106(1–2). Proceedings of the Seventh Grove Fuel Cell Symposium: 146-152. https://doi.org/10.1016/S0378-7753(01)01045-X
Therdthianwong, A., Ekdharmasuit, P., and Therdthianwong, S. 2010. Fabrication and performance of membrane electrode assembly prepared by a catalyst-coated membrane method: effect of solvents used in a catalyst ink mixture. Energy Fuels. 24(2): 1191-1196. https://doi.org/10.1021/ef901105k
Korawat Wuttikid, Nat Worayos and Konlayut Punyawudho*
Department of Mechanical Engineering, Faculty of Engineering, Chiang Mai University, Chiang Mai 50200, Thailand
*Corresponding author. E-mail: konlayutt.p@cmu.ac.th
Total Article Views