 ISSN: 2822-0838 Online

Proteomic Analysis of DNA Starvation/Stationary Phase Protection Proteins from Extended Spectrum β – Lactamase Producing Escherichia coli
Siriwoot Sookkhee*, Banyong Khantawa, and Wachiraphorn SrihinkongPublished Date : 2019-08-23
DOI : https://doi.org/10.12982/CMUJNS.2017.0018
Journal Issues : Number 3 , July-September 2017
ABSTRACT
Escherichia coli, especially the extended-spectrum β-lactamase producing E. coli (ESBL-EC), is the most frequent cause of urinary tract infections. They are not only resistant to β - lactams, but also may be resistant to other drugs, such as ciprofloxacin (CIP). This study aims to identify the proteins related to its CIP resistance using proteomic analysis by isolating ESBL-EC from urine specimens, and comparing the significantly different intracellular proteins extracted from these high-resistant isolates, with or without ciprofloxacin. Among 2,072 uropathogenic E. coli that were screened, 1,644 (79.34%) were confirmed as ESBL-EC isolates. Based on the minimal inhibitory concentrations (MIC) of ceftazidime (CAZ) and ciprofloxacin, 193 isolates (12.12%) exhibited high-level resistance (CAZHRCIPHR). Fourteen isolates of (CAZHRCIPHR) and a representative isolate each of intermediate resistance (CAZICIPI) and resistance (CAZR CIPR) were selected to detect the different protein bands. They were cultured in Mueller Hinton broth (MHB) with various concentrations of CIP or without CIP. Intracellular protein of each selected isolate was separately extracted, detected, and compared by SDS – PAGE. Interestingly, we found a distinct intracellular protein band at approximately 19 kDa in the presence of ciprofloxacin after extracting from the MHB culture. Comparative analysis by 2-D gel revealed 10 protein spots at an interesting range of molecular weight; these were selected and further analyzed with LC-MS/MS. Proteomic identification showed that two of these protein spots matched a DNA starvation/stationary phase protection protein. This protein is responsible for protecting DNA from damage by ciprofloxacin. This protein may play a role in maintaining ciprofloxacin tolerance in ESBL-EC when MIC of ciprofloxacin is increased.
Keywords: ESBL, Escherichia coli, Ciprofloxacin, DNA starvation/stationary phase protection proteins, Proteomic analysis
INTRODUCTION
A urinary tract infection (UTI) is a bacterial infection, most commonly caused by Escherichia coli, of the urinary tract. Cystitis, pyelonephritis, and urethritis are the most common manifestations of UTI. Uropathogenic E. coli have been reported as increasingly resistant to β - lactams and fluoroquinolones (Péan et al., 2001). Hirakata et al. (2005) reported that the resistance rates to ciprofloxacin (CIP) of extended-spectrum β-lactamase producing E. coli (ESBL-EC) and non-ESBL-EC strains were 81.0 and 41.0%, respectively. The main mechanisms of fluoroquinolone resistance in ESBL-EC may be topoisomerase substitution of gyrA or parC, efflux upregulation, porin loss, and plasmid-mediated quinolone resistance (PMDR) of qnr alleles or qepA (Redgrave et al., 2014). Identifying the proteins that influence the high resistance of ESBL-EC to fluoroquinolones, including ciprofloxacin may help explain the bacteria’s resistance mechanism.
Neither changes in the protein pattern of ESBL-EC in response to CIP nor information about the differential proteome profiles of ESBL-EC in the presence or absence of CIP have been reported. Therefore, the aims of the present study were to isolate ESBL-EC from urine specimens, determine CIP resistance, and detect intracellular proteins extracted from these high resistant isolates that were cultured in the presence of CIP using SDS-PAGE. We also characterized and identified the interesting protein spots using proteomic analysis.
MATERIALS AND METHODS
Collecting the bacteria samples
Two thousand and seventy-two non-duplicated isolates of E. coli were recovered from urine specimens of patients of the Division of Central Laboratory, Maharaj Nakorn Chiang Mai Hospital, Chiang Mai, Thailand. The urine specimens were collected using both the midstream-voided and catheter-voided techniques. Briefly, 10 μl of each specimen was streaked on MacConkey agar in the T-streak manner and incubated at 37°C for 24 hr. Normally, a urinary tract infections is caused by a single strain. Therefore, an isolated colony grown on each plate was collected for further characterization. Although samples were collected from each individual over many days, we only used the first collected sample (the first day of collection) from each for the present study. They were isolated on Tryptic Soy Agar and further biochemically identified. The recovered isolates were separately inoculated in Tryptic Soy Broth supplemented with 20% glycerol, then aliquoted and kept at -20°C until use.
Screening and confirming ESBL production
ESBL production was screened using double disk diffusion. Disks containing amoxicillin/clavulanic acid (AMC 30 μg/disk) were placed on a swabbed plate 2 cm from ceftazidime (CAZ 30 μg/disk) and cefotaxime (CTX 30 μg/disk) disks, and then incubated at 37°C for 18 hr. The inhibition zone of each disk was determined and interpreted for the susceptibility of CAZ and CTX according to the guidelines of the Clinical and Laboratory Standards Institute (CLSI) (CLSI, 2013). As ESBL inhibits clavulanic acid (CLA), a keyhole phenomenon or synergistic inhibition zones should be observed between the disks – CAZ and AMC, or CTX and AMC – when ESBL has been produced. To confirm this, ESBL inhibition of CLA was carried out by comparing disks containing β-lactam only and β-lactam plus CLA. CAZ and CTX, and the combination disks with CLA (CAZ/CLA 30 μg/disk and CTX/CLA 30 μg/disk) were placed on the swabbed plate, and then incubated at 37°C for 18 hr. ESBL production was confirmed if the sizes of the inhibition zones between the CAZ or CTX and the disk plus CLA differed by more than 5 mm (Apfalter et al., 2007). Only ESBL-EC isolates were selected for further study.
We studied the multidrug resistance of ESBL-EC following the antimicrobial susceptibility guidelines of CLSI (CLSI, 2013) using other antimicrobial disks, namely, ampicillin (AM 10 μg/disk), cephalothin (CR 30 μg), gentamycin (GM 10 μg), amikacin (KN 30 μg), trimethoprim/sulfamethoxazole (STX 25 μg), ciprofloxacin (CIP 5 μg), and imipenem (IPM 30 μg). The minimal inhibitory concentration (MIC) of multidrug-resistant ESBL-EC isolates to CAZ and CIP was determined.
Selecting high-resistant isolates of ESBL-EC
The present study aimed to select the ESBL-EC isolates that demonstrated high resistance to CAZ and CIP, and to determine their minimal inhibitory concentration was studied. Agar dilution technique was performed to classify the susceptibility of ESBL-EC isolates, depending on their MIC. Tested antimicrobials, CAZ and CIP, were two-fold serially diluted, then incorporated into the molten MHA, mixed by gentle rotation, and poured into petri dishes. A plate without any antimicrobial agent was used as a negative control to check for growth of the tested isolates. Each isolate was spotted onto the surface of MHA agar plates that contained various drug concentrations. MIC is the lowest concentration of antibiotic that completely inhibits growth of the tested isolate. CIP and CAZ susceptibility was classified as susceptible (S; ≤1, and ≤4 μg/mL), intermediate resistant (I; 2 and 8 μg/mL), resistant (R; 4-16 and 16-32 μg/mL), and highly resistant (HR; ≥32 and ≥64 μg/mL), respectively. CAZ and CIP E-strips (E-test®: ABBIODISK) were also carried out to confirm the MIC of the tested isolates. The concentration of the tested drug observed by the borderline of the inhibition zone was defined as the MIC. The isolates were considered highly resistant if the MIC value was beyond the optimal concentration in the strip. All highly resistant isolates, CAZHR CIPHR, were selected to further differentiate their intracellular proteins by comparing with each representative isolate in the groups of CAZI CIPI and CAZR CIPR. E. coli ATCC 25922 was used as the representative isolate of CAZS CIPS.
Extracting and determining intracellular proteins
To compare intracellular proteins, each tested isolate was cultured in MHB in the presence of three CIP concentrations (MIC/2, MIC/4, and MIC/8) and in MHB without CIP. To prepare 106 CFU/ml of suspension, each tested isolate that had been previously cultured in MHB with MIC/2 and MIC/4 of CIP was incubated for 30 hr; MHBs with MIC/8 of CIP and without CIP were incubated for 24 hr. Each culture was adjusted with MHB to acquire 0.125 at OD600. Ten microliters of suspension were diluted to 1 ml with MHB. Intracellular proteins of each culture were extracted using the PeriPrep™ Periplasting Kit (PeriPrep™ Periplasting Kit; Epicentre Biotechnologies). Briefly, cell precipitant was harvested by centrifuging at 1,000 g for 10 min. The supernatant was then removed. The cells were resuspended in 2 ml of PeriPrep Periplasting buffer for each gram of cells, either by vortexing or pipetting, until the cell suspension was homogeneous and then incubated for 5 min at room temperature. Cold purified water was added to the suspension, mixed by inversion, and set on ice for 10 min. This suspension was centrifuged at 4,000 g for 15 min at room temperature and then the supernatant (as the periplasmic fraction) was carefully transferred to the new tube, whereas the pellet (as spheroplastic fraction) was set on ice. The spheroplastic fraction was resuspended in lysis buffer and incubated at room temperature for 10 min. This fraction was purified by centrifuging at 4,000 g and 4°C for 15 min before transferring the supernatant into the new tube. EDTA (PeriPrep™ Periplasting Kit) was added to the spheroplastic fraction and stored at 4°C. Protein concentration of each extracted fraction was determined using Qubit® Fluorometer (Invitrogen™).
One-dimensional polyacrylamide gel electrophoresis
This study analyzed the sizes and patterns of the extracted proteins using SDS-PAGE gel. Each protein sample was separately mixed with the SDS-reducing buffer and heated at 97°C for 20 min. These denatured proteins were loaded into the wells of 4% SDS-polyacrylamide gel as the stacking gel and 12% SDS-polyacrylamide gel as the separating gel. Electrophoresis was performed in a vertical SDS-PAGE chamber (Mini -PROTEAN®IV cell: BIO-RAD Laboratory) under 80 and 100 volts for stacking and separating gels, respectively. The proteins were visualized by silver staining technique (PlusOne Silver Staining Kit; PlusOne™; Amersham Biosciences). SDS-PAGE gel was soaked in fixing solution for 60 min, the gel was removed and incubated with sensitizing solution for 60 min and then washed for 15 min four times by sterile distilled water with gentle shaking. The gel was incubated with the silver solution and shaken for 60 min in the dark. The gel was washed for 1 min two times and then incubated in the developing solution with shaking and left until the visualized protein bands appeared. The gel was immediately added into the stopping solution and left for 60 min. The gel was then incubated in the preserving solution and shaken at least 60 min. The gel was dried and kept at room temperature.
Two-dimensional polyacrylamide gel electrophoresis
The protein samples were desalted four times using a 2D clean-up reagent kit (Ettan™; Sample Preparation Kits; Amersham Biosciences). In the first dimension, the isoelectrofocusing (IEF) was performed in IPG gradient strips pH 3-10 for a length of 7 cm (Immobiline™; DryStrip; Amersham Biosciences). Fifty micrograms of cleaned proteins were loaded directly onto the strip in a strip holder and then placed into the rehydration buffer at room temperature for 12 hrs. Then, the IPG strip was rinsed with deionized water for 1 second and placed in the electrophoresis chamber (Multiphor II Electrophoresis System; Pharmacia Biotech AB™; Uppsala, Sweden). The acidic end of the IPG strip was pointed toward the anode and run for focusing. IEF was run in a step-and-hole mode at 300 volts at 0.2 kVh for 30 min; the gradient mode was run at 1,000 volts at 0.3 kVh for 30 min followed by a gradient mode at 5,000 volts at 4.0 kVh for 1 hr; and finally a step-and-hole mode at 5000 volts at 2.0 kVh for 2 hrs. The pH 3 -10 IPG strips were galvanized with 50 μA per strip at 20°C before equilibrating for 15 min twice in 10 ml equilibration buffer on a reciprocal shaker, then rinsed with deionized water for 1 second and placed on filter paper for a few minutes to drain off the excess equilibration buffer. In the second dimension, the molecular sizes were analysed by SDS-PAGE. The equilibrated IPG strips were placed on the top of the vertical 12.5% SDS-polyacrylamide gel (RapidGel™; 40% acrylamide/Bis-Acrylamide 19:1; Amersham Biosciences) and overlaid with 2 ml of warm agarose solution (BIO-RAD®; BIO-RAD Laboratory). Electrophoresis was done in the SDS-PAGE chamber at 100 volts constant current in 1X SDS electrophoresis buffer pH 8.3 until the bromophenol blue tracking dye migrated to the lower end of the gel. The overlaid agarose sealing solution was removed from the polyacrylamide gel (Shevchenko et al., 1996). Separated proteins in the gel were immobilized by fixing with acetic acid-methanol solution. These proteins were visualized using silver stain.
Preparing samples for mass spectrometry
The samples were prepared for LC-MS/MS analysis using a slightly modified procedure of the in-gel digestion technique (Encarnación et al., 2005). Protein spots from silver stained preparative 2-D gels were selected and excised. Protein spots were destained, reduced, and alkylated; the protein was extracted with trypsin. For mass spectrometry analysis, the volume was adjusted to 20 μl. The peptides were desalted before obtaining the mass spectra of the peptide mixture.
Liquid chromatography coupled with tandem mass spectrometry (LC-MS/MS)
The tryptic peptides were prepared for LC-MS/MS analysis by treating with trifluoroacetic acid to 0.1% supplemented with acetonitrile to 30% (Stamm and Norrby 2001). Peptides were eluted for each gradient from 2% to 60% buffer B (buffer A: 0.1% formic acid/water; buffer B: 0.1% formic/acetonitrile; flow rate: 100 μl/min). Peptide ions were detected from 400 to 1600 amu (1 μscan) followed by one data-dependent MS/MS scan (2 μscans each, isolation width 2 amu, dynamic exclusion for 180 seconds). The mass spectrometer was set to acquire a conventional scan over the m/z range 400-1,600 amu. The most intense peak was selected for MS/MS experiments. SEQUEST was used to match MS/MS spectra to peptides in a database containing sequences downloaded from the National Center for Biotechnology Information (NCBI). Peptide hits from multiple runs were compared using CONTRAST. Proteins were considered detected if they were identified by at least half tryptic status and more than two peptides.
The quality of the search results was interpreted using their observed and expected pI values, molecular sizes, the specific percentage of amino acid coverage, mass accuracy, and the probability of obtaining the same Mascot score resulting in a random match. The percentage of coverage indicated the portion of protein sequence covered by matched peptides to the whole length of the protein sequence. Mascot scores of 59 or higher indicated significant search results. More than 95% probability indicated the results that were not false positive. Protein scores with higher Mascot scores represented better matches.
RESULTS
Screening and confirming ESBL production
We recovered 2,072 E. coli isolates from the urine specimens. According to ESBL screening and confirmation tests, 1,644 isolates (79.34% of all tested isolates) were ESBL-EC. They were susceptible to imipenem. Nearly all (1,593 isolates or 96.89%) of the 1,644 ESBL-EC isolates were proposed as multidrug-resistant isolates.
Selecting highly resistant ESBL-EC isolates
According to their MIC of CIP assayed by agar dilution, these isolates could be divided into three groups, highly resistant, CIPHR (193 isolates, or 12.12%); resistant, CIPR (1,241 isolates, or 77.90%); and intermediate resistant, CIPI (159 isolates, or 9.98%). The tested CIPHR isolates were divided into three groups according to their susceptibility to CAZ, namely, CAZHRCIPHR (14 isolates), CAZR CIPHR (175 isolates), and CAZICIPHR (4 isolates). Only five of the CAZHRCIPHR isolates – E. coli 8/14, 21/7, 23/9, 24/5, and 26/40 – possessed the highest MIC. They were selected for further study. In addition, the isolate exhibiting the highest MIC in the CAZICIPI group (isolate 23/5) and CAZRCIPR group (isolate 23/48) were selected as representative samples of those groups; they were selected for further study to detect the different protein bands after culturing in the presence of various CIP concentrations or without CIP.
One-dimensional polyacrylamide gel electrophoresis
SDS-PAGE results showed no significant difference among the periplasmic protein bands at various CIP concentrations (data not shown). For the spheroplastic proteins of all CAZHRCIPHR isolates, an interesting band at the molecular size range of 17-26 kDa was observed in the presence of CIP at MIC/2, MIC/4, MIC/8, but was not detected in the group where CIP was absent. This protein band in these isolates was further separated by 2D-PAGE. This band was not detected in the groups with any CIP concentrations of isolates 23/5, 23/48, and ATCC 25922 strains, which are representative isolates of CAZICIPI, CAZRCIPR, and CAZSCIPS, respectively (Figures 1-2).
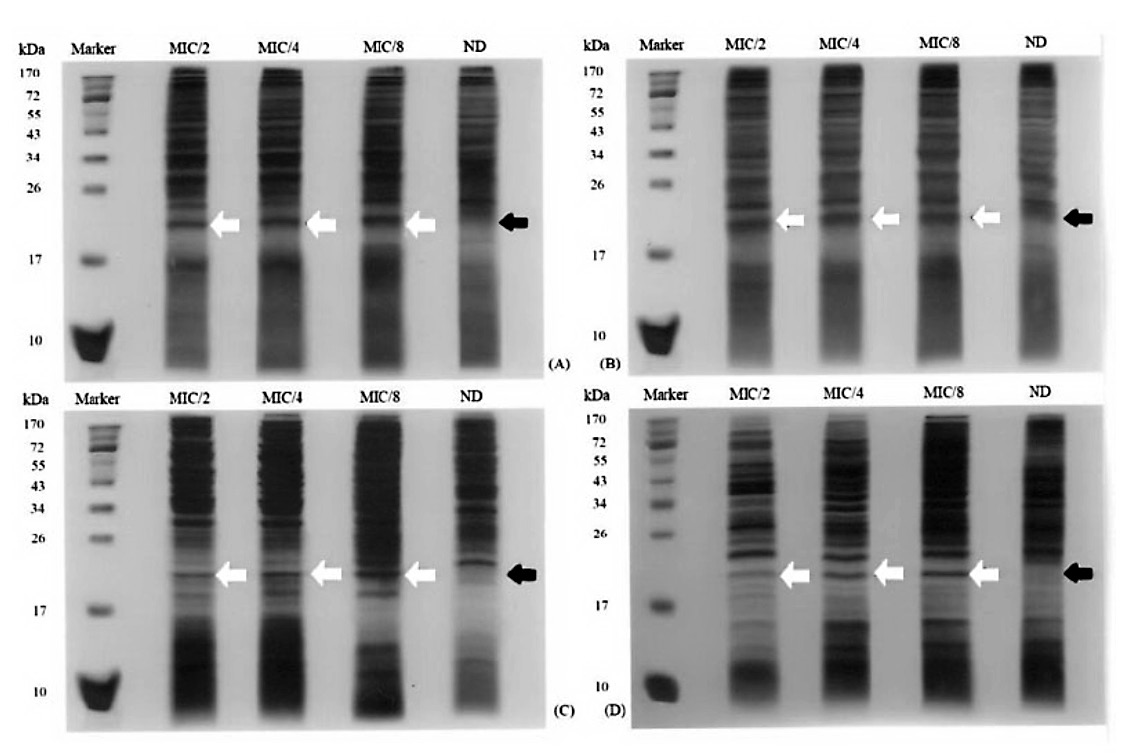
Figure 1. The spheroplastic protein patterns of E. coli (A) 23/9, (B) 24/5, (C) 8/14, and (D) 26/40 extracted from their cultures with various CIP concentrations.
Note: ND, no drug. Arrows indicate the presence (white arrows) or absence (black arrows) of an interesting band.
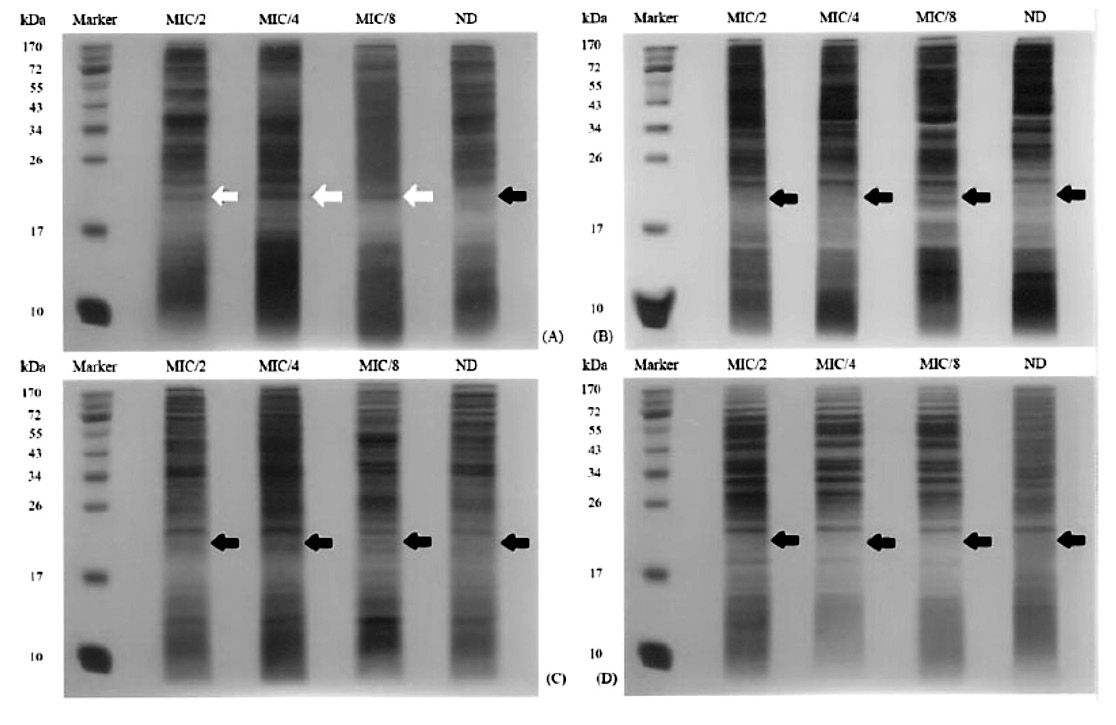
Figure 2. The spheroplastic protein patterns of E. coli (A) 21/7, (B) 23/48, (C) 23/5, and (D) ATCC 25922 extracted from their cultures with various CIP concentrations.
Note: ND, no drug. Arrows indicate the presence (white arrows) or absence (black arrows) of an interesting band.
Two-dimensional polyacrylamide gel electrophoresis
As shown in Figures 3 and 4, by comparing 2-DE gels among the tested proteins that were exposed to various CIP concentrations, we found some distinct protein profiles in 2-DE gels of spheroplastic proteins of 4 CAZHRCAZHR isolates, namely 23/9, 24/5, 26/40, and 8/14, that were cultured with MIC/2 of CIP. Ten individual distinct protein spots at molecular sizes ranging from 17-26 kDa were observed (arrows in figures). On the other hand, these protein spots were not significantly different at MIC/2, MIC/4, and MIC/8 of CAZHRCAZHR isolate 23/9 (Figure 5). Therefore, after image analysis, we selected these protein spots of this isolate at MIC/2 for LC-MS/MS analysis (Figure 6).
Liquid chromatography coupled with tandem mass spectrometry (LC-MS/MS)
After 2-DE analysis, these protein spots were excised from the coomassie stained 2-DE gels and then analyzed using LC-MS/MS. As shown in Figure 6, 10 protein spots were identified, corresponding to five identified spot proteins. There was no signal or significant match in spots No. 1, 7, 8, 9, 10. The analyzed gel spots, NCBI accession numbers, protein matched and source species, p, score, isoelectric points (pI), molecular masses, and % protein sequence coverage are listed in Table 1. The protein spot identifications were accepted if their Mascot scores and % coverage were greater than 55 and considered significant (P < 0.05). Table 1 lists the LC-MS/MS identified protein spots of CAZHRCAZHR isolates 23/9 at MIC/2. The identified proteins ranged from theoretical pI 4.4 (spot 3) to 5.7 (spot 6) and from theoretical MW 20 kDa (spot 2) to 16 kDa (spot 4). The mass spectrometry data from spot No. 6 were matched to DNA starvation/stationary phase protection protein of E. coli O157:H7 and DNA protection during starvation protein of E. coli B7A with the highest Mascot score and sequence coverage of 138.32 and 83.23%, respectively. The expected pI and molecular size for this protein agreed with the position observed on the 2-D gel. In this case, DNA starvation/stationary phase protection protein (Dps) may be responsible for the presence of toxic eradication found in the culture of E. coli with CIP.
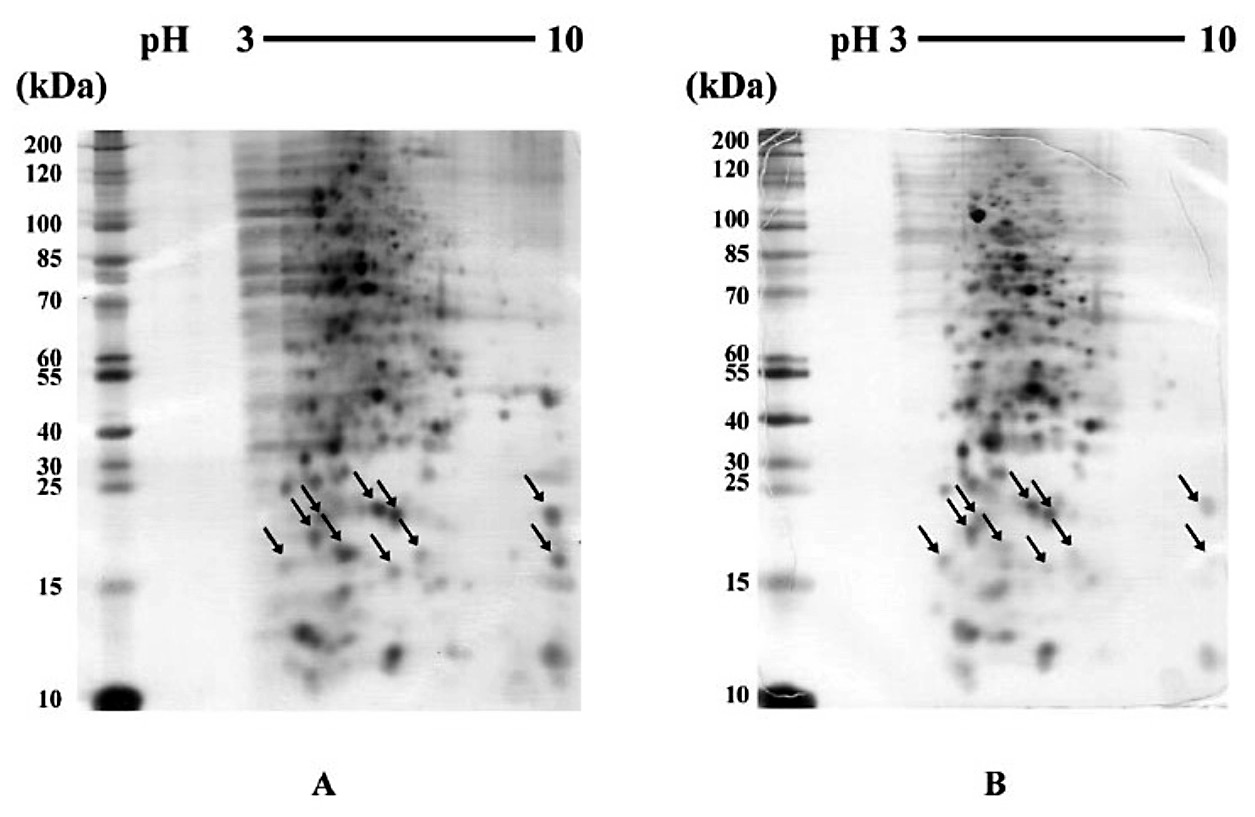
Figure 3. 2D patterns of CAZHRCAZHR E. coli (A) 23/9 and (B) 24/5 extracted from their cultures with MIC/2 of CIP. Arrows indicate the selected protein spots.
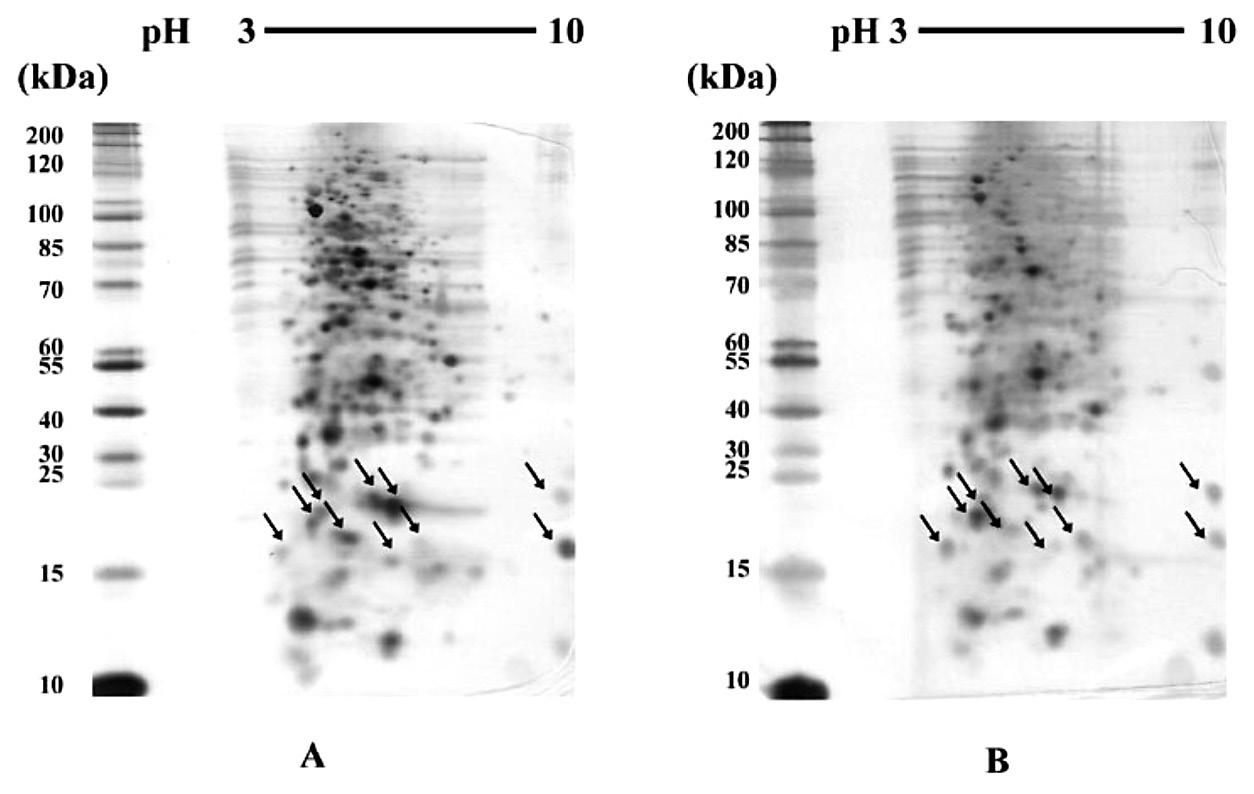
Figure 4. 2D patterns of CAZHRCAZHR E. coli (A) 26/40 and (B) 8/14 extracted from their cultures with MIC/2 of CIP.
Note: Arrows indicate the selected protein spots.
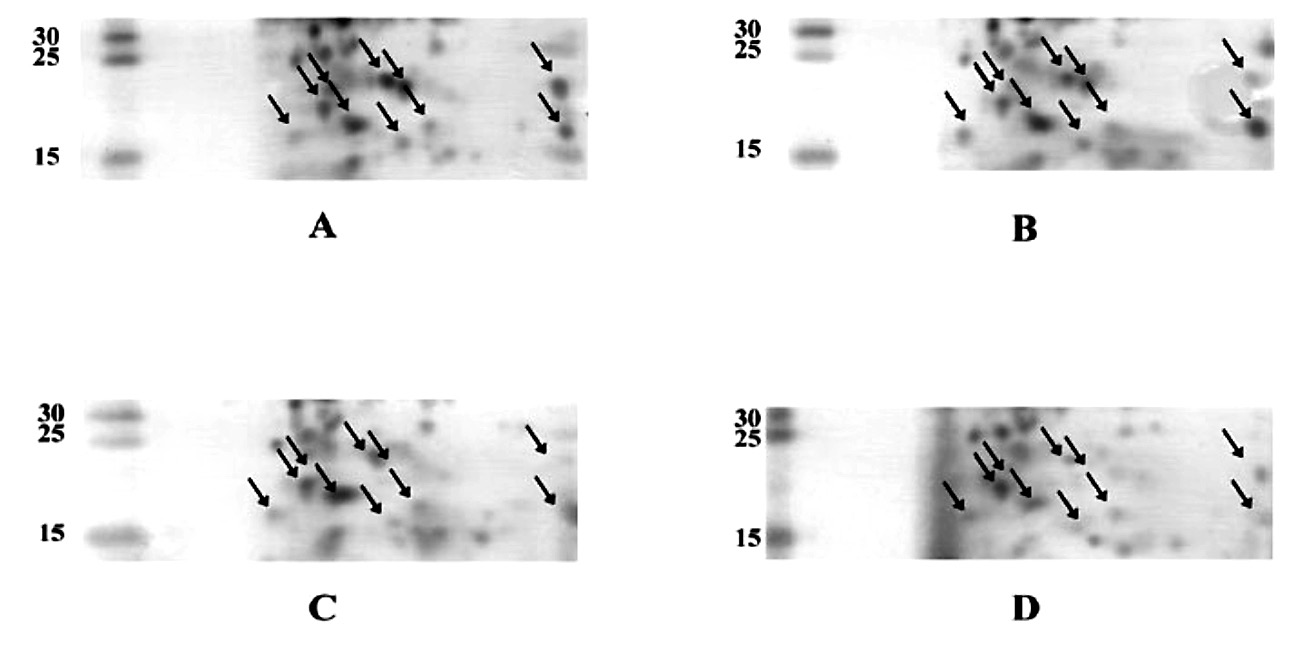
Figure 5. 2D patterns of the spheroplastic proteins of E. coli 23/9 extracted from the cultures with (A) MIC/2, (B) MIC/4, (C) MIC/8, and (D) without of CIP.
Note: Arrows indicate the selected protein spots.
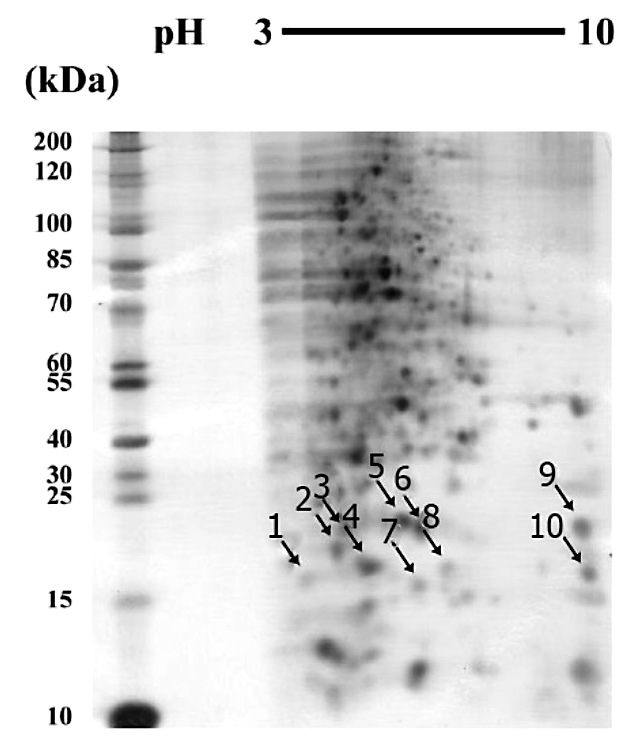
Figure 6. Selected protein spots (arrows) from 2D gel of E. coli 23/9 extracted from the culture with MIC/2 of CIP.
DISCUSSION
E. coli are responsible for more than 80% of all UTIs and cause symptomatic UTI (Hedlund et al., 2001). Biochemically, E. coli are motile; produce indole substances; ferment glucose, sucrose, and lactose; and produce gas and lysine decarboxylase. They cannot utilize citrate as a carbon source nor produce acetoin or urease. Many antibiotics used in UTIs are usually capable of reaching and maintaining high urinary concentrations that are much greater than the MIC of the causative E. coli. However, the emergence and spread of ESBL-producing organisms resulted in limited therapeutic options for killing them. In the present study, all E. coli isolates were resistant to β-lactams, including ceftazidime, cefotaxime, cephalothin, and ampicillin, but they were susceptible to imipenem. This is probably because these antibiotics have been widely used in treating community-acquired UTI. This suggests that members of carbapenems, imipenem, ertapenem, meropenem, and doripenem could be used to treat ESBL-EC infections. However, the increasing emergence of carbapenem-resistant Enterobacteriaceae has also reported.
CIP is one of the therapeutic choices for infections caused by ESBL-producing Enterobacteriaceae. This antibiotic acts by inhibiting bacterial DNA gyrase and topoisomerase IV. These enzymes can cleave one DNA double helix, pass a second DNA molecule (or a different region of the first DNA molecule) through the break, and relegate the broken DNA. DNA tracking machinery somehow is affected by these intermediates, resulting in multiple subsequent effects, such as chromosome fragmentation, the inhibition of DNA synthesis, and death. Resistance
to CIP has been commonly reported to have amino acid substitutions in the chromosomal quinolone resistance determining regions (QRDRs) in GyrA (Ser83 and Asp87) subunits of DNA gyrase and ParC (Ser80 and Glu84) subunits of topoisomerase IV (Jacoby, 2005; Fu et al., 2013). Plasmid-mediated quinolone resistance (PMQR) genes, including qnr, and efflux pumps, are known to confer low-level CIP resistance (Hong et al., 2009). Quinolone target protection by Qnr proteins are widely distributed in Enterobacteriaceae worldwide. FQ resistance may also arise because of reduced intracellular drug accumulation caused by porin loss or active efflux pump. QepA, a fluoroquinolone-specific efflux pump, has been identified in E. coli (Yamane et al., 2007).
Table 1. Results from LC-MS/MS ion fragmentation, database searches using the Mascot and NCBInr database, and the Mascot score for the best match.
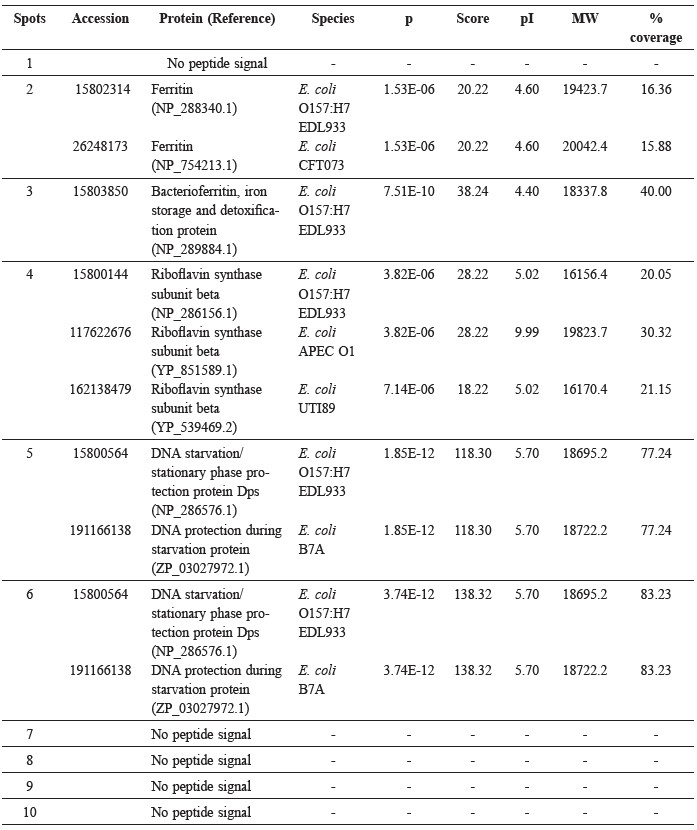
Note: Accession, accession number of the protein; Reference, the header information from the Fasta database that describes the entry; P (pro), the probability of the best peptide match (the peptide with the lowest score); Score, a score for the SEQUEST results (the higher score, the better match to the searched sequence). The score is given as S = -10*log(P), where P is the probability that the observed match is a random event. It is an indication of match quality; a value less than 59 is considered a non-significant hit; % coverage: the percentage of the protein sequence covered by the identified peptides to the whole protein sequence.
The protein profiles in response to various stress mechanisms, such as, sensitivity to antibiotics or modifications and proteomics related to antibiotic resistance (Li et al., 2007), could represent a valid and integrative approach to analyzing molecular mechanisms involved in antibiotic resistance and to developing new therapeutic and diagnostic strategies (Roncada et al., 2009). Identifying cellular proteins and proteomes can be used to determine the proteins expressed when cells are exposed to inducers, repressors, or stresses of bacteria; to describe the phenomenon; or better understand protein responses under different chemical challenges. This study used the proteomic approach to study cellular response of ESBL-EC to any changes in growth conditions in the presence of CIP. We used overnight E. coli cultures in the stationary phase, because our previous preliminary data (not shown) revealed no significant difference in the protein band patterns between the untreated and drug-treated groups at each stage. Therefore, we used gel-based proteomics to study the protein patterns in response to various CIP
concentrations in the tested isolates.
Results from SDS-PAGE showed that the different protein bands of tested CAZHRCAZHR ESBL-EC isolates were within a range of 17-26 kDa. In the 2-DE gels, most of the cytoplasmic protein spots, especially for isolate 23/9, were located within in those ranges and between pI 4.0-7.0. The theoretical molecular masses and pI values of the identified protein spots were close to those values observed in the 2-DE gel. In our study, as shown in Table 1, among the identified protein spots, spots No. 2 and 3, with a low pI and theoretical MW of 18 kDa, were
matched with the low protein coverage of ferritin and bacterioferritin, which are responsible for iron storage and detoxification. The next identified spot (No.4) was matched to proteins in the group of riboflavin synthase subunit beta; although the protein scores were not significant. The identified protein spots No. 5 and 6 from the 2-DE gel were matched to proteins belonging to DNA starvation/stationary phase protection protein or Dps of E. coli O157:H7 and DNA protection during starvation protein of E. coli B7A, with significance and high % coverage. CAZHRCAZHR ESBL-EC isolates exposed to CIP appeared to adapt by cytoplasmic production of DNA starvation/stationary phase protection protein (Dps).
E. coli Dps is a DNA-protecting protein family that expresses under nutritional and oxidative stress. In the stationary phase, Dps can compact the DNA characteristics of this growth phase of E. coli (Ali et al., 1999). Dps effectively protects DNA against oxidative cleavage, nucleases, UV light (Martinez and Kolter, 1997), and thermal shock (Nair and Finkel, 2004). It is responsible for the acid tolerance of E. coli K-12 and O157:H7 (Choi et al., 2000). Both oxidative stress and acid stress are associated with the production of hydroxyl radicals (OH-) via Fenton reactions. Dps interacts with DNA to rapidly form stable Dps-DNA co-crystals in the starvation and stationary phases of Dps-overexpressed E. coli isolates (Wolf et al., 1999). However, the actual mode of the Dps-DNA interaction has not been fully elucidated. Frenkiel-Krispin et al. (2001) proposed that Dps dodecamers cannot bind DNA directly, and that complex formation is mediated through ion bridges formed by Mg2+ in a particular range of cation concentrations. Zhao et al. (2002) hypothesized that Dps crystallization in vitro and binding of DNA promoted the same type of protein-protein interactions. Thus, in the hexagonal Dps crystal lattice, three adjacent dodecamers define holes that are lined by the lysine-rich N-termini. Dps afford DNA protection against oxidative damage by inhibiting formation of the toxic hydroxyl radicals. This is achieved by the removal of Fe (II) by rapid binding of Fe (II) at the highly conserved intersubunit ferroxidase center, Fe (II) oxidation by H2O2, and sequestration of Fe (III) within the protein cavity (Zhao et al., 2002). Dps self-aggregation is the driving force in the formation of large Dps-DNA complexes, yet additional proof that protein-protein interactions play a major role in nucleoid structuring (Figure 7). Zhao et al. (2002) hypothesized that this mechanism protects DNA from detrimental factors other than hydroxyl radicals, such as nucleases, UV and gamma radiation, high temperature, mutagens and some antibacterial agents (such as the ciprofloxacin in the present study). E. coli Dps has a higher affinity for DNA at acidic pH that mimics the stress responses encountered by E. coli, prolonged periods of starvation and acid stress challenges.
From the hypothesis, we did not find major changes in antibiotic resistance related to the proteins identified in the present study, suggesting that the adaptation to stress of the tested isolates may not be enough under the selected CIP concentrations to affect the activity of interesting proteins or to induce the expression of antibiotic resistance genes. Our study suggested that CIP can cause the stress condition in highly resistant E. coli, and significantly induce the production of Dps. This protein plays a role in the condensed structure between Dps and DNA, which may increase DNA packing and make transcription less accessible. However, further studies are required to understand the consequences of Dps upregulation.
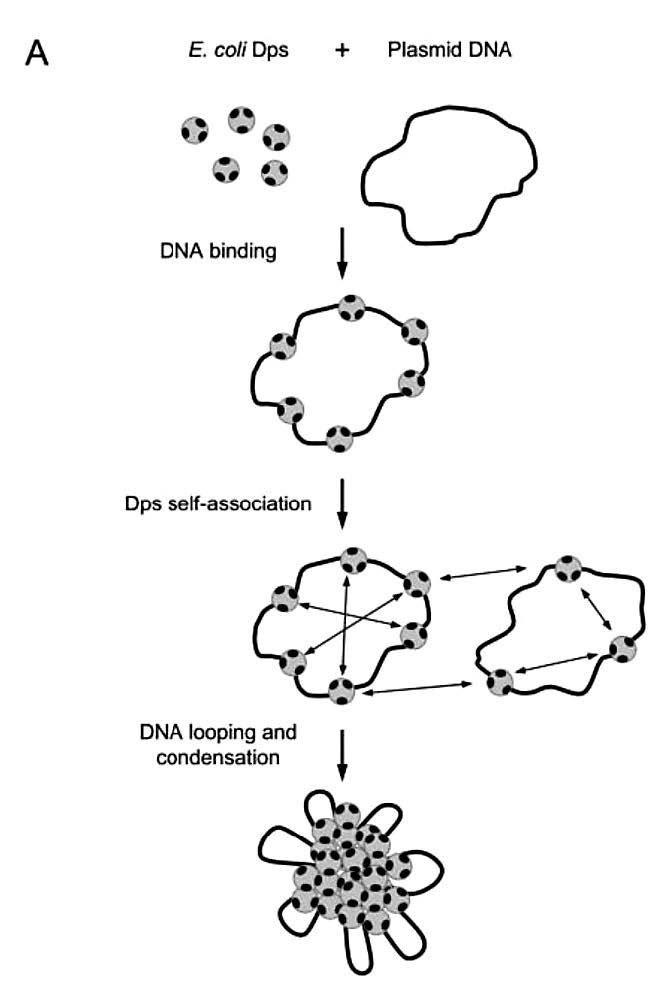
Figure 7. DNA condensation of E. coli (Ceci et al., 2004).
CONCLUSION
Uropathogenic E.coli is a significant source of urinary tract infections, especially the multidrug resistant strains. In the present study, ESBL-EC were recruited and determined for their resistant patterns to CAZ and CIP, respectively. In the highly resistant group, CAZHRCIPHR, SDS-PAGE and 2-D PAGE detected a significant protein band at 19 kDa. Ten protein spots were observed and selected for LC-MS/MS analysis. Proteomic data suggested that the distinct protein spots were DNA starvation/stationary phase protection protein (Dps).
ACKNOWLEDGEMENTS
We would like to express our sincere thanks to Assistant Professor Dr. Sumalee Pruksakorn and Associate Professor Prasit Tharavijitkul, Department of Microbiology, Faculty of Medicine, Chiang Mai University, for their invaluable guidance and encouragement. We wish to thank Mrs. Manassanun Bunchu and all colleagues at Division of Central Laboratory, Maharaj Nakorn Chiang Mai Hospital, for their help in collecting the bacteria. We are grateful to the Bioresources Research Laboratory, National Center for Genetic Engineering and Biotechnology for providing LC-MS/MS analysis.
REFERENCES
Ali, T.A., Iwata, A., Nishimura, A., Ueda, S., and Ishihama, A. 1999. Growth phase - dependent variation in protein composition of the Escherichia coli nucleoid. Journal of Bacteriology. 181: 6361-6370.
Apfalter, P., Assadian, O., Daxböck, F., Hirschl, A.M., Rotter, M.L., and Makristathis, A. 2007. Extended double disc synergy testing reveals a low prevalence of extended-spectrum β-lactamases in Enterobacter spp. in Vienna, Austria. Journal of Antimicrobial Chemotherapy. 59: 854-859. doi:10.1093/jac/dkm060
Ceci, P., Cellai, S., Falvo, E., Rivetti, C., Rossi, G.L., and Chiancone, E. 2004. DNA condensation and self-aggregation of Escherichia coli Dps are coupled phenomena related to the properties of the N-terminus. Nucleic Acids Research. 32: 5935-5944. doi: 10.1093/nar/gkh915
Choi, S.H., Baumler, D.J., and Kaspar, C.W. 2000. Contribution of dps to acid stress tolerance and oxidative stress tolerance in Escherichia coli O157:H7. Applied and Environmental Microbiology. 66: 3911-3916.
Clinical and Laboratory Standards Institute. 2013. Performance standards for antimicrobial susceptibility testing. Clinical and Laboratory Standards Institute. M100-S23. 23th informational supplement. Wayne, Pennsylvania, USA.
Encarnación, S., Hernández, M., Martinez-Batallar, G., Contreras, S., Vargas, M.C., and Mora, J. 2005. Comparative proteomics using 2 - D gel electrophoresis and mass spectrometry as tools to dissect stimulons and regulons in bacteria with sequenced or partially sequenced genomes. Biological Procedures. 7: 117-135. doi: 10.1251/bpo110
Frenkiel-Krispin, D., Levin-Zaidmanx, S., Shimoni, E., Wolf, S.G., Wachtel, E.J., Arad, T., Finkel, S.E., Kolter, R., and Minsky, A. 2001. Regulated phase transitions of bacterial chromatin: a non-enzymatic pathway for generic DNA protection. EMBO Journal. 20: 1184-1191. doi: 10.1093/emboj/20.5.1184
Fu, Y., Zhang, W., Wang, H., Zhao, S., Chen, Y., Meng, F., and Zhang, Y. 2013. Specific patterns of gyrA mutations determine the resistance difference to ciprofloxacin and levofloxacin in Klebsiella pneumoniae and Escherichia coli. BMC Infectious Diseases. 13: 8 doi: 10.1186/1471-2334-13-8
Hedlund, M., Duan, R.D., Nilsson, A., Karpman, D., and Svanborg, C. 2001. Fimbriae, transmembrane signaling, and cell activation. Journal of Infectious Diseases 183: S47-S50. doi: 10.1086/318851
Hirakata, Y., Matsuda, J., Miyazaki, Y., Kamihira, S., Kawakami, S., Miyazawa, Y., Ono, Y., Nakazaki, N., Hirata, Y., Inoue, M., Turnidge, J.D., Bell, J.M., Jones, R.N., and Kohno, S. 2005. Regional variation in the prevalence of extended-spectrum β-lactamase-producing clinical isolates in the Asia-Pacific region (SENTRY 1998-2002). Diagnostic Microbiology and Infectious Disease. 52: 323-329. doi: 10.1016/j.diagmicrobio.2005.04.004
Hong, B.K., Chi, H.P., Chung, J.K., Kim, E.C., Jacoby, G.A., and Hooper, D.C. 2009. Prevalence of plasmid-mediated quinolone resistance determinants over a 9-year period. Antimicrobial Agents and Chemotherapy. 53: 639-645. doi: 10.1128/AAC.01051-08
Ilari, A., Ceci, P., Ferrari, D., Rossi, G.L., and Chiancone, E. 2002. Iron incorporation into Escherichia coli Dps gives rise to a ferritin-like microcrystalline core. Journal of Biological Chemistry. 277: 37619-623. doi: 10.1074/jbc.M206186200
Jacoby, G.A. 2005. Mechanisms of resistance to quinolones. Clinical Infectious Diseases. 41: S120-S126. doi: 10.1086/428052
Li, H., Lin, X.M., Wang, S.Y., and Peng, X.X. 2007. Identification and antibody - therapeutic targeting of chloramphenicol-resistant outer membrane proteins in Escherichia coli. Journal of Proteome Research. 6: 3628-3636. doi: 10.1021/pr070307y
Martinez, A., and Kolter, R. 1997. Protection of DNA during oxidative stress by the nonspecific DNA-binding protein Dps. Journal of Bacteriology. 179: 5188-5194.
Nair, S., and Finkel, S.E. 2004. Dps protects cells against multiple stresses during stationary phase. Journal of Bacteriology. 186: 4192-4198. doi: 10.1128/JB.186.13.4192-4198.2004
Péan, Y., Goldstein, F.W., and Bels, F.D. 2001. Trends and epidemiology of antimicrobial resistance in Enterobacteriaceae isolated in community settings: the Vigil’Roc multicenter studies. Médecine et Maladies Infectieuses. 31: 622-628. doi: 10.1016/S0399-077X(01)00285-2
Redgrave L.S., Sutton, S.B., Webber, M.A., and Piddock, L.J.V. 2014. Fluoroquinolone resistance: mechanisms, impact on bacteria and role in evolutionary success. Trends in Microbiology. 22: 438-445. doi: 10.1016/j.tim.2014.04.007
Roncada, P., Deriu, F., Gaviraghi, A., Martino, P.A., and Bonizzi, L. 2009. Proteomic study of antibiotic resistance in Escherichia coli strains. Veterinary Research Communications. 33: 157-160. doi: 10.1007/s11259-009-9260-1
Shevchenko, A., Wilm, M., Vorm, O., and Mann, M. 1996. Mass spectrometric sequencing of proteins silver-stained polyacrylamide gels. Analytical Chemistry. 68: 850-858.
Stamm, W.E., and Norrby, S.R. 2001. Urinary tract infections: disease panorama and challenges. Journal of Infectious Diseases. 183: S1-S4.doi: 10.1086/318850
Wolf, S.G., Frenkiel, D., Arad, T., Finkel, S.E., Kolter, R., and Minsky, A. 1999. DNA protection by stress - induced biocrystallization. Nature. 400: 83-85. doi: 10.1038/21918
Yamane K., Wachino, J.I., Suzuki, S., Kimura, K., Shibata, N., Kato, H., and Shibayama, K. 2007. New plasmid mediated fluoroquinolone efflux pump, qepA, found in an Escherichia coli clinical isolate. Antimicrobial Agents and Chemotherapy. 51: 3354-3360. doi: 10.1128/AAC.00339-07
Zhao, G., Ceci, P., Ilari, A., Giangiacomo, L., Laue, T.M., Chiancone, E., and Chasteen, N.D. 2002. Iron and hydrogen peroxide detoxification properties of DNA-binding protein from starved cells. A ferritin-like DNA-binding protein of Escherichia coli. Journal of Biological Chemistry. 277: 27689-27696. doi: 10.1074/jbc.M202094200
Siriwoot Sookkhee1*, Banyong Khantawa2 and Wachiraphorn Srihinkong3
1 Department of Microbiology, Faculty of Medicine, Chiang Mai University, Chiang Mai 50200, Thailand
2 Microbiology Unit, Central Laboratory, Maharaj Nakorn Chiang Mai Hospital, Faculty of Medicine, Chiang Mai University, Chiang Mai 50200, Thailand
3 Division of Preventive Medicine, Directorate of Medical Services, Royal Thai Air Force, Bangkok 10220, Thailand
*Corresponding author. E-mail: ssookkhee@hotmail.com
Total Article Views