 ISSN: 2822-0838 Online

The Effect of Adding Chinese Food Supplements to Rice on Glycemic Response
Chiao-Hsin Yang, Meng-Hsueh Amanda Lin and Jenshinn Lin*Published Date : 2019-08-23
DOI : https://doi.org/10.12982/CMUJNS.2017.0016
Journal Issues : Number 3 , July-September 2017
ABSTRACT
Although an international table of glycemic index (GI) values has been published, most listed values pertain to single foods. However, in recent years, mixed-diet GI has been widely studied. This study determined the dose-response and mixture interaction effects of food processing supplements (gluten protein, canola oil, and dextrin fiber) combined with white rice on glycemic response and GI. Twelve healthy adults aged 18-26 years were fed a test or reference food containing 50 g of available carbohydrates. Venous blood samples were collected before the meal and at 15, 30, 45, 60, 90, and 120 min after the meal. The results showed that white rice has a GI value of 93.8±2.8. Supplementation with various amounts of lipids and dextrin reduced the GI slightly, whereas gluten supplementation significantly (p < 0.05) reduced the GI from 93.8 to 84.9 and 83.1, respectively. Analysis of the interaction of gluten, lipids, and dextrin on GI using three-way ANOVA revealed that significant effects on GI value were found with gluten (p < 0.01) and dextrin (p < 0.05). Moreover, adding a gluten protein and dextrin fiber mixture yielded a larger glycemic control effect than adding a lipid and dextrin fiber mixture did. In conclusion, adding gluten protein supplements to rice products may reduce overall postprandial glycemic response and induce a lower GI in healthy people.
Keywords: Glycemic index, White rice, Supplementation, Gluten protein, Dextrin fiber
INTRODUCTION
Otto and Niklas (1980) were the first to analyze the glycemic responses to various foods. Jenkin et al. (1981) originally conceived the glycemic index (GI). On a scale of 1 to 100, foods can be classified as low GI foods (≤ 55), medium GI foods (56 - 69), and high GI foods (≥70). GIs are typically obtained by dividing the incremental postprandial blood glucose level by the corresponding level after ingesting an equivalent carbohydrate portion (25 or 50 g) of a reference food (Jenkins et al., 1983). Foods with a high GI are more rapidly digested and absorbed, causing greater fluctuations in blood glucose per unit of carbohydrate than foods with a lower GI (Jenkins et al., 1987). Studies showed that long-term consumption of high GI foods not only increased the risk of obesity, type 2 diabetes, and diabetic complications, but may also lead to heart disease and some types of cancer (McKeown, 1994; Salmerón et al., 1997; Ludwig et al., 1999; Liu et al., 2000; Augustin et al., 2002; Pi-Sunyer, 2002; World Health Organization, 2003; Schulze et al., 2004; Ebbeling et al., 2005; Wolever, 2006).
Rice is a crucial cereal crop and a staple food for more than half of the world’s population, particularly for people living in some of the most populous countries, such as China, India, and Japan. Miller et al. (1992) classified rice as a high-GI food, with a GI ranging from 64 to 93 when freshly cooked. Differences in blood glucose responses to carbohydrates can be attributed to various factors, including the botanical source; food processing; food storage, which may cause retrogradation; physiochemical properties, particularly gelatinisation; particle size; the amylose: amylopectin ratio; and consumption in combination with other nutrients, such as fat, protein, and fiber (Frei et al., 2003; Bornet et al., 2007; Thompson et al., 2012; Sun et al., 2014). Although an international table of GI values has been published (Foster et al., 2002), most values denote the GI of single foods. However, in recent years, mixed-diet GI has been widely studied. Supplementing carbohydrates with fat and proteins reduces the glycemic response by delaying gastric emptying and stimulating insulin secretion (Nuttall and Gannon, 1991). Moreover, the effect of proteins on glycemic responses to glucose is related to dietary fiber intake (Moghaddam et al., 2006). Notably, soluble fiber has been shown to lower GI and glycemic responses postprandially (Gatenby et al., 1996).
White rice is the main staple food in Asian diets. Asians often consume white rice with meals that contain lipid, protein, and fiber; however, whether the involved interaction affects the GI value of white rice remains unclear. This study determined the individual dose-response and mixture interaction effects of gluten protein, canola oil, and dextrin fiber combined with white rice on glycemic response and GI. These supplements are particularly common additives used in food processing in Taiwan. Gluten is often used instead of meat in Asian cuisine, and an indigestible form of dextrin is often used as a fiber supplement. Canola oil is generally considered a healthy oil because it is particularly low in saturated fat. Our findings may clarify the effects of food factors on GIs and food processing, and thereby assist people who are sensitive to glycemic effects in developing an appropriate diet.
MATERIALS AND METHODS
Subjects
Twelve healthy adults (ethnic East Asians) consisting of 5 females and 7 males were recruited from National Pingtung University of Science and Technology. Before inclusion in the study, the participants were briefed on all aspects of the experiment, including their right to withdraw or suspend at any time, and were also provided with an opportunity to ask questions. This research project is in full compliance with the Declaration of Helsinki and has stated all foreseeable risks and stress that the study subjects may be exposed to. The Pingtung Christian Hospital Research Ethics Board approved the protocol, and all subjects provided their informed consent to participate by signing the approved consent form.
The recruited participants were weight-stable and not on any medication during the study period. All participants had normal fasting blood glucose levels. They were asked to restrict their intake of alcohol, beans and other legumes, and fried foods, and to refrain from unusual eating habits and activities before each test day (Brand-Miller, 2004; Lin et al., 2010). The mean age (±SEM) of the participants was 20 ± 1 years (range 18-26). The mean body mass index (kg/m2) was 22.0 ± 0.4 (range 20.0-24.0), with an average weight (kg) of 67.8±1.1 (range 49.0-75.0) and average height (cm) of 174.4±1.8 (range 147.0-183.0). The average fasting venous plasma glucose (mg/dL) was 74.0 ± 0.6 (range 69.5-76.5).
Test foods
The test meals included white rice, canola oil, gluten protein, and dextrin fiber. White rice, Kaohsiung 145 (a strain of Japonica rice that has starch with an amylose content of approximately 19.8% and carbohydrate content of 80%), was purchased from a white rice factory (Pingtung Sin Fang, Taiwan). Lipids, with a lipid content of 92%, were purchased in the form of canola oil from a local supermarket (Changhua, Taiwan). Gluten protein and dextrin fiber were purchased from Genfont Corporation (Taipei, Taiwan), with protein and fiber contents of 85.5% and 82%, respectively.
The chemical composition of the test food was analyzed using the standard method described in AOAC (2000). First, all the collected samples were dried to a constant weight. The crude protein contents were calculated from nitrogen contents obtained using the Kjeldahl method. A factor of 6.25 was used to convert the nitrogen value into that for protein. The crude fat contents were measured gravimetrically through extraction in diethyl ether and petroleum ether after hydrolysis with acid. All foods were measured in triplicate. Free sugars were measured
using an ion chromatograph system. Enzymatically available starch content was analyzed using the method of McCleary et al. (1994) and an assay kit (Megazyme, Bray, Ireland). The available carbohydrates were calculated as the sum of free sugars and enzymatically available starch. Glucose was used as a reference food for the GI test. All test meals contained 50 g of available carbohydrates, wherein the amount of available carbohydrates was equal to the total carbohydrates in the food minus the value of dietary fiber. Each subject was asked to consume glucose three times at the beginning, middle, and end of the study to reduce the effect of day-to-day variation in glucose tolerance (Brand-Miller, 2004). This procedure was followed in strict compliance with the protocol recommendations described in the ISO guidelines.
Experimental procedures
The subjects fasted 10-12 hours overnight and performed the test from 7:30 to 8:30 a.m. in the laboratory. They only ate the food we offered, and were not allowed to eat other vegetable or protein supplemented food. Each subject was randomly fed the equivalent of 50 g of available carbohydrate as either the test foods or the reference food. The test foods were freshly prepared on the morning of the test days. White rice (62.5 g of raw rice) was soaked preliminarily in water at a 1:1 rice to water ratio and then cooked using a rice cooker for 40 min (Tatung Co, TAC-10A-G., Ltd., Taiwan), yielding 107 g of steamed white rice. For the gluten and dextrin supplements, steamed white rice balls were produced using various amounts of gluten and dextrin, and reheated for 10 minutes. For the lipid supplement, steamed white rice was mixed with canola oil first and reheated for 10 minutes, and then formed into rice balls and served with 220 mL water while it was still warm.
Blood samples were taken before the subjects ate (at 0 min) and at 15, 30, 45, 60, 90, and 120 min after the meal (Wolever et al., 1991; American Diabetes Association, 2000; Brouns et al., 2005). The blood samples collected were processed as follows: a researcher withdrew intravenous blood (1.5 mL) by inserting a scalp needle into the subjects’ forearms. When blood samples were taken, the outer tube was filled with normal saline (0.9%) to prevent the scalp needle from clotting. The collected blood samples were placed in heparinized tubes and centrifuged at 12,500 ×g for 3 min at 4°C to separate the plasma. The plasma was subjected to principle analysis (glucose oxidase and peroxidase) by using a biochemical analyzer (Model YSI 7100; Multiparameter Bioanalytical System, Yellow Springs, USA) to determine the blood glucose levels. The peak rise was determined by subtracting the fasting glucose from the maximum glucose concentration. The two-hour glucose blood response curve was assessed using the trapezoidal rule; this involved using the incremental area under the curve (IAUC) to calculate the GI values (ignoring the area beneath the fasting concentration). The GI value for the test food was the ratio of the test food IAUC to the standard glucose IAUC, multiplied by 100.
Statistical analysis
The data obtained were first calculated in Microsoft Office Excel 2003 (Microsoft Corporation, Redmond, WA) and then represented as mean ± SEM. All the figures were produced using SigmaPlot version 12.5 (Systat Software Inc., San Jose, CA, USA). One-way ANOVA with Tukey’s post-hoc procedure was conducted at each time point for each sample to observe the difference of the samples against the control (white rice). One-way ANOVA with Tukey’s post-hoc procedure was performed to observe the difference between the groups. Three-way ANOVA was performed to calculate the p-value of sample interaction between gluten protein, lipids, and dextrin fiber according to the glycemic index result. All statistical analysis was performed using SPSS version 21.0 (IBM Corp., Armonk, NY, USA).
RESULTS
Coingestion of white rice with gluten protein, dextrin fiber, or lipids Postprandial glycemic response. Figure 1 depicts the measured postprandial glycemic response after the coingestion of white rice with gluten protein, dextrin fiber, or lipid. Of all the test foods, the glucose concentration of white rice supplemented with gluten tended to show the lowest response curve at every time point, whereas white rice (control) showed the highest response curve. The postprandial glycemic response peaked at 45 and 60 min for most of the test foods (Figure 1). The blood glucose response was considerably more stable after gluten supplementation than after lipid and dextrin supplementation. Compared with the control, supplementation with 10 g of gluten showed the most significant (p = 0.004) blood glucose-lowering effect at 60 min (Figure 1A). Moreover, 5 g and 10 g of gluten significantly affected blood glucose reduction (at 60 min, p = 0.038; at 90 min, p = 0.045, respectively) compared with the control. White rice supplemented with 10 g of dextrin showed significant blood glucose reduction at 60 min (p = 0.045) and 5 g at 120 min (p = 0.037) (Figure 1B). However, white rice supplemented with lipids did not show a significant blood glucose reduction effect at any time point (Figure 1C).
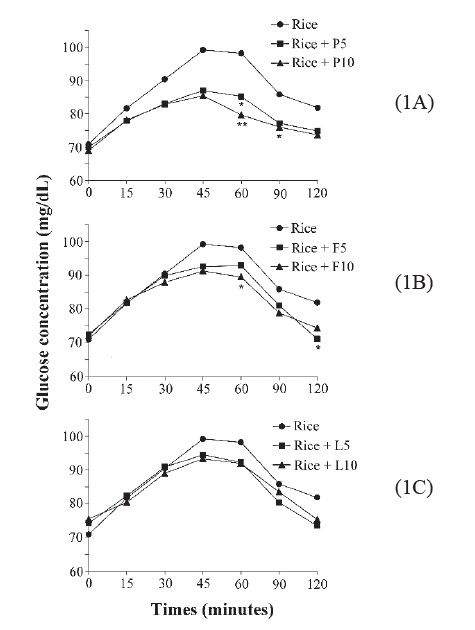
Figure 1. The postprandial glycemic response peaked at 45 and 60 min for most of the test foods.
Glycemic index. The GI of the test meals is shown in Figure 2. The GIs are ranked as white rice alone (93.8±2.8), white rice with 5 and 10 g of lipid (89.7±2.4 and 90.3±2.1, respectively), white rice with 5 and 10 g of dextrin (89.3±2.6 and 88.1±2.1, respectively), and white rice with 5 and 10 g of gluten (84.9±1.7 and 83.1±1.6, respectively). Of the three nutrient components, dextrin showed a larger GI-lowering effect than did lipids, as indicated by the nonsignificant effect of white rice supplemented with lipid on reducing the overall glycemic response. A significant reduction (p < 0.05) was observed only in white rice supplemented with 5 and 10 g of gluten, which reduced the GI values by 8.9% and 10.7%, respectively.
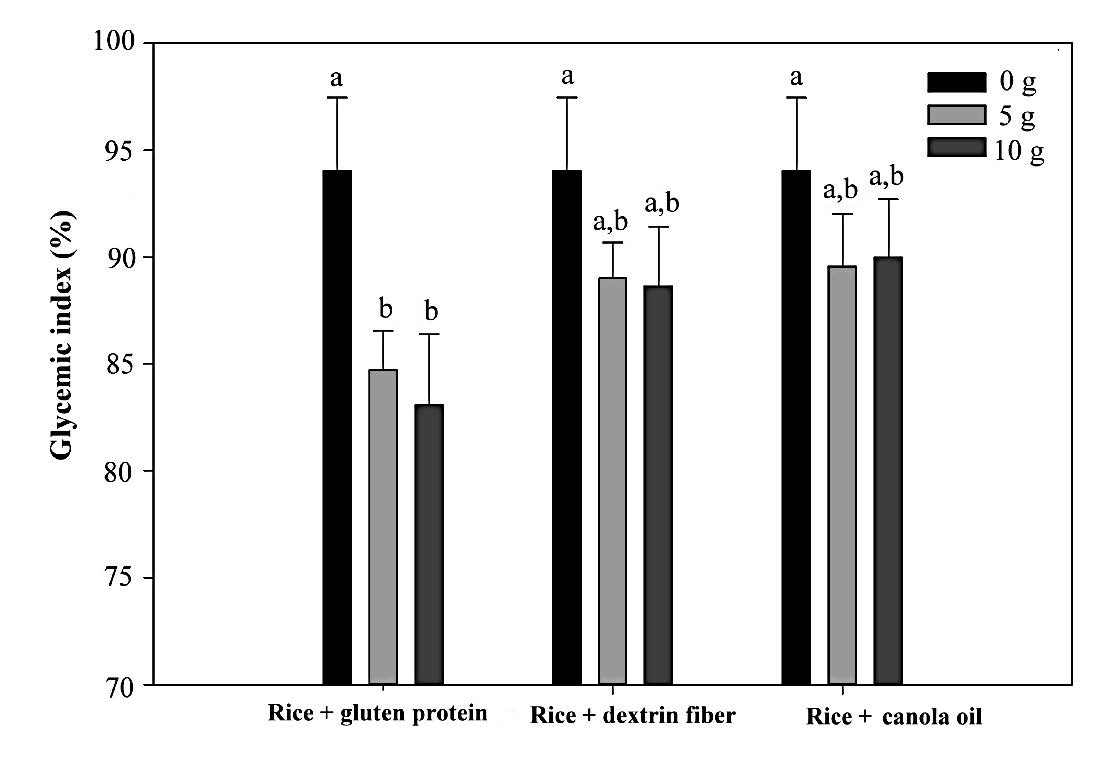
Figure 2. The GI of the test meals.
Coingestion of white rice with a gluten protein, lipids, and dextrin fiber mixture
Postprandial glycemic response. Figure 3 shows the postprandial glucose response of two types of test food combination. The combination of gluten and dextrin, as shown in Figure 3A, yielded the most significant reduction in the postprandial glucose response. Every combination at a concentration of 5 and 10 g significantly reduced the postprandial glucose response after 60 min of digestion. Moreover, a significant reduction was observed for white rice supplemented with 10 g of gluten and 10 g of dextrin after 90 min of digestion. The combination of 10 g of lipid and 10 g of gluten significantly reduced the glucose response after 60 min of digestion (Figure 3B). However, no significant decrease was observed for any lipid or dextrin combination (Figure 3C).
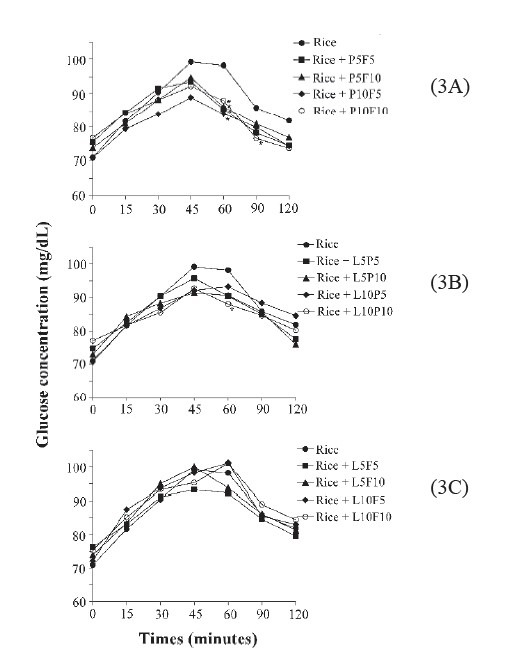
Figure 3. The postprandial glucose response of two types of test food combination.
Figure 4 shows the postprandial glucose response of three types of test food combination. For 5 g of lipid ingestion (Figure 4A), significant reduction of postprandial glucose response can be found 60 min after ingestion of a meal containing 10 g of gluten. The reduction of postprandial glucose response by a meal containing 10 g of lipids (Figure 4B) can be found 60 min after ingestion of white rice combined with 10 g of lipids, 10 g gluten, and 10 g of dextrin. Compared to the results shown in Figure 3, the addition of lipids reduced the significance of the effect of gluten on postprandial glucose reduction; higher amounts of lipids resulted in a corresponding lowering of the reduction effect.
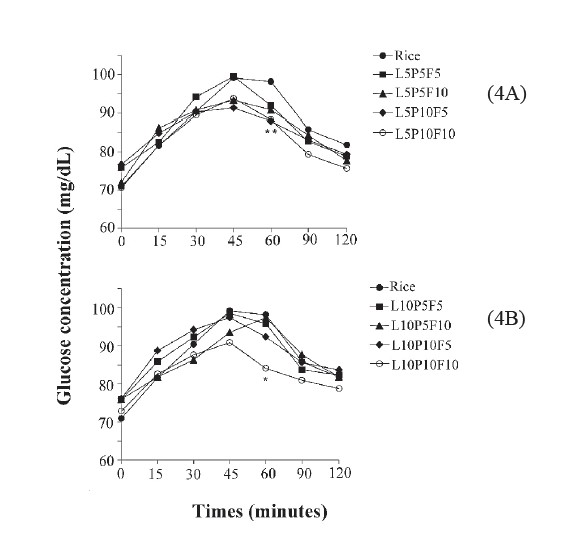
Figure 4. The postprandial glucose response of three types of test food combination.
Glycemic index. The GI of white rice supplemented with a mixture of gluten, lipids, and dextrin is shown in Table 1. Compared with the GI of white rice alone (93.8 ± 2.8), white rice supplemented with gluten and dextrin yielded a lower GI. Moreover, white rice combined with 10 g of gluten and 5 or 10 g of dextrin significantly reduced the GI to 86. The GI of white rice supplemented with lipids and dextrin (but no gluten protein) non-significantly increased the GI to 96 (white rice with 10 g of dextrin and 10 g of lipids). The combination of lipids, gluten, and dextrin did not significantly reduce the GI. Test foods containing 10 g of lipids tended to yield non-significantly higher GIs than did those containing 5 g each of lipids, gluten, and dextrin.
Three-way ANOVA. Three-way ANOVA revealed an interaction between lipids, gluten, and dextrin that was observed based on GI values. The results of their first, second, and third levels of interaction are shown in Table 2. The significant interactions of the GIs were observed only in the main effects of gluten (p = 0.000) and dextrin (p = 0.005). No significant two-way and three-way interactions were observed in the effects of lipids, gluten, and dextrin regarding the reduction of the GI values.
Table 1. Glycemic index (GI) of white rice combined with the mixture of lipid, gluten protein and dextrin fiber.
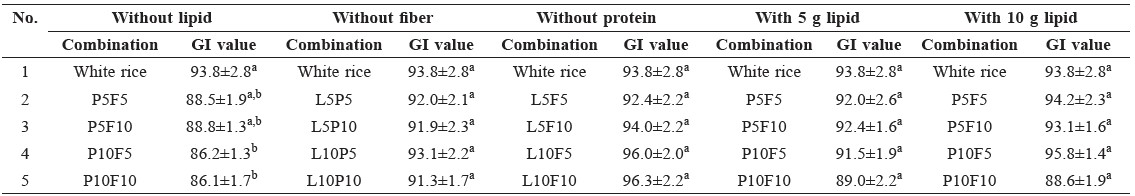
Note: a-bValues (mean ± SEM) with different letters indicate significant differences as determined by one-way ANOVA with Tukey’s post hoc (p<0.05). P indicates gluten protein, F indicates dextrin fiber, L indicates canola oil; 5 indicates 5 g, and 10 indicates 10 g.
Table 2. Three-way ANOVA showing interaction among lipid, gluten protein, and dextrin fiber observed from glycemic index (GI) values.
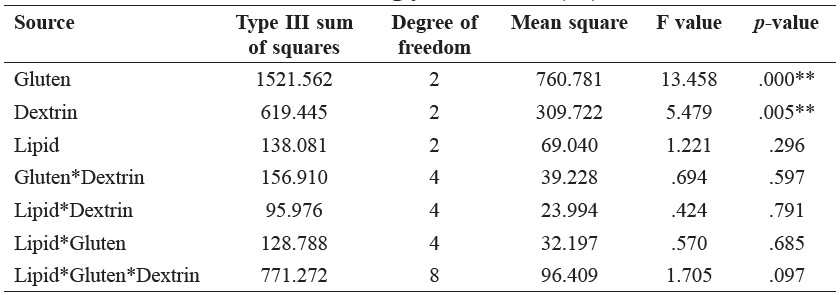
Note: **Data indicates p < 0.01. Gluten indicates gluten protein, Dextrin indicates dextrin fiber, Lipid indicates canola oil.
Multiple regression analysis. Multiple regression analysis of the GI was performed to fit mathematical models of the tested variable to the response data. Linear regression was selected because it showed a higher adjusted R2 value (0.762) than did the second-order polynomial regression model (0.688). The linear regression for the GI is expressed in Equation (1), where variables A, B, and C represent lipids, protein, and fiber, respectively.
Y = 92.653 + 0.415A − 0.449B + 0.138C (1)
ANOVA of the fitted linear regression for the GI of the test foods showed p = 0.000, and the error of the model was less than 0.05.
DISCUSSION
This study determined the dose–response and mixture interaction effects of food processing supplements (gluten protein, lipids, and dextrin fiber) combined with white rice on glycemic response and GI. Our results revealed that for the individual dose-response, white rice with gluten supplementation yielded the most significant postprandial blood glucose-lowering and GI effect of the three supplementations. Regarding the mixture interaction effect on GIs, white rice combined with gluten or dextrin produced the most significant reduction in the postprandial glucose response. However, the combination of lipids and dextrin at any concentration showed no significant decrease. Although the individual dose-response effects of gluten may reduce the GI effectively, the combination of lipids, gluten, and dextrin did not exhibit significant reduction of the GI. Significant interactions with the GI were observed only in the main effects of gluten and dextrin. No significant two- or three-way interaction was observed in the effects of lipids, gluten, and dextrin regarding reducing the GI.
The regression coefficient revealed that gluten supplementation had the most pronounced effect in altering the GI of white rice. Specifically, increased gluten levels caused a corresponding enhancement of GI reduction. However, lipid supplementation tended to reduce the effect of gluten. In short, increased addition of lipids to white rice resulted in correspondingly higher GI. This indicated that gluten supplementation had a larger glycemic control effect than lipid supplementation. This information is crucial, because previous dietary recommendations for both healthy individuals and diabetics have focused on the relative types and amount of carbohydrates and lipids (Krauss et al., 1996; Gannon et al., 2003). Gannon et al. (2003) compared the metabolic effects of high and normal protein diets in people with and without diabetes, and found that a high protein diet reduced postprandial blood glucose and improved overall glucose control. Moghaddam et al. (2006) indicated that the blood glucose response of people who consume a low-protein–high-lipid diet is twice that of those who consume high-protein–low-lipid diets. These findings support our data, which showed that consuming protein (gluten) with white rice reduced the 2-h postprandial blood glucose response and improved overall glycemic control in healthy subjects.
Numerous factors affect the glycemic response from food, including the types of carbohydrate (glucose, galactose, fructose, amylose, amylopectin, soluble, and insoluble fiber); interaction between protein and carbohydrates; the processing of food; and the presence of lipids, protein, and fiber (Bornet et al., 2007). Moreover, some hormones involved in glucose uptake and utilization, such as glucagon, glucose-dependant insulinotropic polypeptide (GIP; gastric inhibitory polypeptide), and glucagon-like peptide-1 (GLP-1), are the main hormones in postprandial glucose homeostasis (Larsen et al., 1997). Macronutrients, including carbohydrates, lipids, and protein, stimulate GLP-1 secretion (Deacon, 2005). The GLP-1 receptor is mainly present in pancreatic β cells (Tornehave et al., 2008) and the central nervous system (hypothalamus). Thus, food intake stimulates pancreatic β cells to produce insulin and triggers the hypothalamus to produce a sense of satiety (Larsen et al., 1997).
The findings of the present research indicated that the coingestion of lipids with white rice did not produce a larger postprandial glycemic effect in comparison with that produced by white rice combined with gluten protein or dextrin fiber. Some studies have shown that protein increases amino acid-mediated insulin secretion and β-cell mass through GLP-1 activation (Moghaddam et al., 2006). Hurley et al. (1995) indicated that different protein sources have different effects on insulin secretion; insulin secretion triggered by protein from soy is lower than that triggered by protein from cod or casein. Protein appears to strongly affect insulin secretion. The concentration, structure, and digestibility of protein, as well as the ability of specific amino acids to stimulate insulin, appear to be the main explanatory factors (Moghaddam et al., 2006). In the present study, we used gluten protein, comprising gliadins and glutenins, which are water absorbent, and exhibit network structures and starch-binding properties (Marshall and Chrastil, 1992). These properties can slow digestion and lower the increase in postprandial blood glucose (Jenkins et al., 1987). This explains why gluten protein can yield a more stable glycemic response and lower GI. Furthermore, gluten protein is a
markedly popular additive that is used in food processing in Taiwan, especially in Buddhist vegetarian cooking as a meat alternative, because it has high protein content (85.5%, dried weight).
Jenkins et al. (2010) reported that adding fiber controlled blood glucose level fluctuations and reduced GIs. Soluble fibers may modulate the GI of foods by delaying gastric emptying and lowering the glucose absorption rate (Bornet et al., 2007). Moreover, soluble fiber is more efficient than insoluble fiber in reducing the postprandial glycemic response (Pastors et al., 1991). The effect of dietary fiber on GI remains controversial. Jenkins et al. (1986) analyzed the relationship between the GI of 25 foods and dietary fiber content and found a correlation between total dietary fiber and GI (R= 0.461> 0.05), but found no significant correlation between the content of the soluble fiber and GI. In contrast, Silvester et al. (1995) found that soluble fiber had a significant impact on postprandial blood glucose. These arguments may be due to a number of factors affecting GI of foods, with dietary fiber not the main factor. As Jenkins et al. (1986) found, dietary fiber can only explain 50% of the change in blood glucose. Thompson et al. (2012) showed that white rice coingested with pinto or black beans produced a lower overall glycemic response than did dark kidney beans; this lower response might be correlated with a lower level of soluble fiber and resistant starch. This supports the present finding regarding dextrin, which is a fiber, but is not digested (Riccardi and Rivellese, 1991).
Lipids reduce the glycemic response through GLP-1-mediated gastric emptying effects (Foster-Powell et al., 2002; Bornet et al., 2007). Various types and amounts of lipids are closely related to insulin sensitivity. Insulin sensitivity reduces when the amount of fat in the diet is more than 35%-40% of total calories. Moreover, in a study investigating the effects on GI of the coingestion of white rice with oil, chicken breast, and vegetables, rice cooked with fat was shown to yield the lowest overall glycemic response. However, the corresponding increase in the insulin response was nonsignificant. By contrast, chicken breast (protein) significantly increased the insulin response (Sun et al., 2014). In addition, different types of fatty acid have different effects on the human body. For example, saturated fatty acids can increase insulin resistance, whereas monounsaturated and ω-6 polyunsaturated fatty acids can increase insulin sensitivity; ω-3 polyunsaturated fatty acid does not affect insulin sensitivity (Reaven, 2005). The present study used canola oil, which contains less saturated fatty acids (linoleic acid: 21% (ω-6), alpha-linolenic acid: 11% (ω-3), saturated fatty acid 7%) (Gunstone and Hamilton, 2002) than other edible oils, but its effect on glucose response was not significant compared with that of the control. However, we need more studies to investigate the effects of different types of protein, lipids, and fiber on postprandial glycemic response and the GI in different forms of carbohydrate-rich foods, such as breakfast cereals, bread, and noodles.
CONCLUSION
Supplementing white rice with gluten protein, lipids, and dextrin fiber (common Chinese food processing supplements) reduced postprandial blood glucose response and GI. Gluten protein with white rice provided the highest glycemic response and largest GI-lowering effect compared with dextrin fiber and lipids with white rice. Coingestion of white rice with gluten protein was associated with a reduction in the overall postprandial glycemic response curve and induced a lower GI, whereas lipids and dextrin fiber reduced the glycemic response and GI, but not significantly. In the gluten protein, lipid, and dextrin fiber mixture, the lipids tended to exert adverse effects. The present data suggested that gluten protein with rice offers promise as a food processing supplement in rice products.
ACKNOWLEDGEMENTS
We acknowledge the financial support from the Ministry of Science and Technology, known as the National Science Council of Taiwan (NSC 100-2221-E-020-002). We appreciate the cooperation of Pingtung Christian Hospital and the approval from their International Review Board. All authors declare no conflict of interest.
REFERENCES
American Diabetes Association. 2000. Nutrition recommendations and principles for people with diabetes mellitus. Diabetes Care. 23: S43-S46.
AOAC. 2000. Official methods of analysis, 17th edn. Association of Official Analytical Chemists, Washington, D.C. WorldCat
Augustin, L.S., Franceschi, S., Jenkins, D.J., Kendall, C.W., and La, Vecchia. C. 2002. Glycemic index in chronic disease: a review. European Journal of Nutrition. 56(11): 1049-1071. doi: 10.1038/sj.ejcn.1601454
Blume, H., Wedemeyer, R., and Gallwitz, B. 2010. Importance of GLP-1 for glucose homeostasis: discovery of incretin. Pharmazie in Unserer Zeit. 39(2): 100–106. doi: 10.1002/pauz.201000356
Bornet, F.R., Jardy-Gennetier, A.E., Jacquet, N., and Stowell, J. 2007. Glycaemic response to foods: impact on satiety and long-term weight regulation. Appetite. 49(3): 535-553. doi: 10.1016/j.appet.2007.04.006
Brand-Miller, J.C. 2004. Postprandial glycemia, glycemic index, and the prevention of type 2 diabetes. The American Journal of Clinical Nutrition. 80(2): 243-244.
Brouns, F., Bjorck, I., Frayn, K., Gibbs, A.L., Lang, V., Slama, G., and Wolever, T.M. 2005. Glycaemic index methodology. Nutrition Research Reviews. 18(1): 145-171. doi: 10.1079/NRR2005100
Deacon, C.F. 2005. What do we know about the secretion and degradation of incretin hormones? Regulatory Peptides. 128(2): 117-124. doi: 10.1016/j.regpep.2004.06.007
Ebbeling, C.B., Leidig, M.M., Sinclair, K.B., Segger-Shippee, L.G., Feldman, H.A., and Ludwing, D.S. 2005. Effects of an ad libitum low glycemic load on cardiovascular risk factors in obese young adults. The American Journal of Clinical Nutrition. 81: 976-982.
Foster-Powell, K., Holt, S.H., and Brand-Miller, J.C. 2002. International table of glycemic index and glycemic load values: 2002. The American Journal of Clinical Nutrition. 76(1): 5-56. PubMed
Frei, M., Siddhuraju, P., and Becker, K. 2003. Studies on the in vitro starch digestibility and the glycemic index of six different indigenous rice cultivars from the Philippines. Food Chemistry. 83(3): 395-402. doi: 10.1016/S0308-8146(03)00101-8
Gannon, M.C., Nuttall, F.Q., Saeed, A., Jordan, K., and Hoover, H. 2003. An increase in dietary protein improves the blood glucose response in persons with type 2 diabetes. The American Journal of Clinical Nutrition. 78(4): 734-741.
Gatenby, S.J., Ellis, P.R., Morgan, L.M., and Judd, P.A. 1996. Effect of partially depolymerized guar gum on acute metabolic variables in patients with non-insulin-dependent diabetes. Diabetic Medicine. 13: 358-364. doi: 10.1002/(SICI)1096-9136(199604)13:4<358::AID-DIA24>3.0.CO;2-#
Gunstone, F.D., and Hamilton, R.J. 2002. Vegetable oils in food technology: composition, properties and uses. Blackstone Publishing, Oxford, England.
Hurley, C., Galibols, I., and Jacques, H. 1995. Fasting and postprandial lipid and glucose metabolisms are modulated by dietary proteins and carbohydrates: role of plasma insulin concentrations. Journal of Nutritional Biochemistry. 6(10): 540-546. doi: 10.1016/0955-2863(95)00103-7
Jenkins, D., Wolever, T., Taylor R.H., Barker, H., Fielden, H., Baldwin, J.M., Bowling, A.C., and Newman, H.C. 1981. Glycemic index of foods: a physiological basis for carbohydrate exchange. The American Journal of Clinical Nutrition. 34(3): 362-366. PubMed
Jenkins, D., Wolever, T., Jenkins, A., Thorne, M.J., Lee, R., Kalmusky, J., Reichert, R., and Wong, G.S. 1983. The glycaemic index of foods tested in diabetic patients: a new basis for carbohydrate exchange favouring the use of legumes. Diabetologia. 24(4): 257-264. doi: 10.1007/BF00282710
Jenkins, D.J.A., Wolever, T.M.S., and Jenkins, A.L. 1986. Low glycemic response to traditionally processed wheat and rye products: Bulgar and pumpernickel bread. The American Journal of Clinical Nutrition. 43: 516-520.
Jenkins, D., Thorne, M.J., Wolever, T., Jenkins, A.L., Rao, A.V., and Thompson, L.U. 1987. The effect of starch-protein interaction in wheat on the glycemic response and rate of in vitro digestion. The American Journal of Clinical Nutrition. 45(5): 946-951.
Jenkins, A.L., Kacinik, V., Lyon, M., and Wolever, T. 2010. Effect of adding the novel fiber, PGX®, to commonly consumed foods on glycemic response, glycemic index and GRIP: a simple and effective strategy for reducing post prandial blood glucose levels–a randomized, controlled trial. Nutrition Journal. 9: 58. doi: 10.1186/1475-2891-9-58
Krauss, R.M., Deckelbaum, R.J., Ernst, N., Fisher, E., Howard, B.V., Knopp, R.H., Kotchen, T., Lichtenstein, A.H., McGill, H.C., Pearson, T.A., Prewitt, T.E., Stone, N.J., Horn, L.V., and Weinberg, R. 1996. Dietary guidelines for healthy American adults. A statement for health professionals from the nutrition committee, American Heart Association. Circulation. 94(7): 1795-1800.
Larsen, P.J., Tang-Christensen, M., Holst, J.J., and Ørskov, C. 1997. Distribution of glucagon-like peptide-1 and other preproglucagon-derived peptides in the rat hypothalamus and brainstem. Neuroscience. 77(1): 257-270.
Ludwig, D.S., Majzoub, J.A., Al-Zahrani, A., Dallal, G.E., Blanco, I., and Roberts, S.B. 1999. High glycemic index foods, overeating, and obesity. Pediatrics. 103(3): e26.
Liu, S., Willett, W.C., Stampfer, M.J., Hu, F.B., Franz, M., Sampson, L., Hennekens, C.H., and Manson, J.E. 2000. A prospective study of dietary glycemic load, carbohydrate intake, and risk of coronary heart disease in US women. The American Journal of Clinical Nutrition. 71(6): 1455-1461.
Lin, M.H.A., Wu, M.C., and Lin, J. 2010. Variable classifications of glycemic index determined by glucose meters. Journal of Clinical Biochemistry and Nutrition. 47(1): 45-52. doi: 10.3164/jcbn.10-08
Marshall, W.E., and Chrastil, J. 1992. Interaction of food proteins with starch. In: Hudson BJF (ed) Biochemistry of Food Proteins. Springer, New York (pp 75-97).
McCleary, B., Gibson, T., Solah, V., and Mugford, D.C. 1994. Quantitive measurement of total starch in cereal flours and products. Journal of Cereal Science. 20: 51-58. doi: 10.1006/jcrs.1994.1044
McKeown-Eyssen, G. 1994. Epidemiology of colorectal cancer revisited: are serum triglycerides and/or plasma glucose associated with risk? Cancer Epidemiol Biomarkers Prev. 3: 687-695.
Miller, J.B., Pang, E., and Bramall, L. 1992. Rice: a high or low glycemic index food? The American Journal of Clinical Nutrition. 56(6): 1034-1036.
Moghaddam, E., Vogt, J.A., and Wolever, T.M. 2006. The effects of fat and protein on glycemic responses in nondiabetic humans vary with waist circumference, fasting plasma insulin, and dietary fiber intake. Journal of Nutrition. 136(10): 2506-2511.
Nuttall, F.Q., and Gannon, M.C. 1991. Plasma glucose and insulin response to macronutrients in nondiabetic and NIDDM subjects. Diabetes Care. 14(9): 824-838. doi: 10.2337/diacare.14.9.824
Otto, H., and Niklas, L. 1980. Different glycemic responses to carbohydrate-containing foods. Implications for the dietary treatment of diabetes mellitus. Medecine Et Hygiene (Geneve) 38, 3424-3429.
Pastors, J.G., Blaisdell, P.W., Balm, T.K., Asplin, C.M., and Pohl, S.L. 1991. Psyllium fiber reduces rise in postprandial glucose and insulin concentrations in patients with non-insulin-dependent diabetes. The American Journal of Clinical Nutrition. 53(6): 1431-1435.
Pi-Sunyer, F.X. 2002. Glycemic index and disease. The American Journal of Clinical Nutrition. 76: 290S-298S.
Reaven, G.M. 2005. The insulin resistance syndrome: definition and dietary approaches to treatment. Annual Review of Nutrition. 25: 391-406. doi: 10.1146/annurev.nutr. 24.012003.132155
Riccardi, G., and Rivellese, A.A. 1991. Effects of dietary fiber and carbohydrate on glucose and lipoprotein metabolism in diabetic patients. Diabetes Care. 14(12): 1115-1125.
Salmerón, J., Ascherio, A., Rimm, E.B., Colditz, G.A., Spiegelman, D., Jenkins, D.J., Stampfer, M.J., Wing, A.L., and Willett, W.C. 1997. Dietary fiber, glycemic load, and risk of NIDDM in men. Diabetes Care. 20(4): 545–550.
Schulze, M.B., Liu, S., Rimm, E.B., Manson, J.E., Willett, W.C., and Hu, F.B. 2004. Glycemic index, glycemic load, and dietary fiber intake and incidence of type 2 diabetes in younger and middle-aged women. The American Journal of Clinical Nutrition. 80(2): 348-356.
Silvester, K.R., Englyst, H.N., and Cummings, J.H. 1995. Ileal recovery of starch from whole diets containing resistant starch measured in vitro and fermentation of ileal effluent. The American Journal of Clinical Nutrition. 62(2): 403-11.
Sun, L., Ranawana, D.V., Leow, M.K.S., and Henry, C.J. 2014. Effect of chicken, fat and vegetable on glycaemia and insulinaemia to a white rice-based meal in healthy adults. European Journal of Nutrition. 53(8): 1719-1726. doi: 10.1007/s00394-014-0678-z
Thompson, S.V., Winham, D.M., and Hutchins, A.M. 2012. Bean and rice meals reduce postprandial glycemic response in adults with type 2 diabetes: a cross-over study. Nutrition Journal. 11: 23. doi: 10.1186/1475-2891-11-23
Tornehave, D., Kristensen, P., Rømer, J., Knudsen, L.B., and Heller, R.S. 2008. Expression of the GLP-1 receptor in mouse, rat, and human pancreas. Journal of Histochemistry and Cytochemistry. 56(9): 841-851. doi: 10.1369/jhc.2008.951319
Wolever, T.M., Jenkins, D.J., Jenkins, A.L., and Josse, R.G. 1991. The glycemic index: methodology and clinical implications. The American Journal of Clinical Nutrition. 54(5): 846-854.
Wolever, T.M.S. 2006. The glycemic index: a physiological classification of dietary carbohydrate. CABI Publishing: Wallingford, Oxfordshire (pp 83-115).
World Health Organization. 2003. Obesity and overweight (pp. 1-2). URL (http://www.who.int/dietphysicalactivity/media/en/gsfs_obesity.pdf.) (Accessed 26 Sept 2016 ) PubMed
Chiao-Hsin Yang, Meng-Hsueh Amanda Lin and Jenshinn Lin*
Department of Food Science, National Pingtung University of Science and Technology, Neipu, Pingtung 91201, Taiwan (R.O.C.)
*Corresponding author. E-mail: jlin@mail.npust.edu.tw
Total Article Views