 ISSN: 2822-0838 Online

A Low-cost Sensor for Measuring and Mapping Chlorophyll Content in Cassava Leaves
Tanapat Sookchalearn and Wanrat Abdullakasim*Published Date : 2019-08-23
DOI : https://doi.org/10.12982/CMUJNS.2017.0015
Journal Issues : Number 3 , July-September 2017
ABSTRACT
A crop health monitoring system associated with field positioning is required for site-specific nutrient management. The amount of chlorophyll in a plant leaf, as quantified by leaf greenness index, reflects a plant’s health. The present study is aimed at developing a low-cost sensor (LCS) for assisting cassava farmers to estimate and map the chlorophyll content in cassava leaves. The device consists of a color sensor that gives frequency responses to red (R), green (G), and blue (B) chromatics. The color sensor was calibrated to convert the frequency outputs to R, G, and B values. We evaluated the accuracy of color measurement by comparing the three chromatic values with those obtained from a commercial color analyzer. The sensor was further calibrated for chlorophyll measurement by correlating the greenness index of cassava leaf samples with values measured by a standard chlorophyll meter SPAD-502. The sensor was validated by comparing leaf greenness with the readings of the SPAD-502 using a different set of leaf samples. A GPS receiver was installed in the device for simultaneous recording of field position. The results showed that the sensor accurately measured the actual R, G, and B. The color difference expressed in terms of Euclidean distance ranged from 1.61 to 63.31, with an average of 17.62, which is acceptable. Analysis of linear correlation for R, G, and B resulted in coefficients of determination (R2) of 0.9493, 0.9704, and 0.9849, respectively. Evaluation of leaf greenness with the SPAD-502 meter yielded a root mean square error (RMSE) of 0.9688 and an R2 of 0.97, suggesting satisfactory accuracy. The developed low-cost sensor effectively showed the spatial variation of chlorophyll content in cassava plants across a planting area.
Keywords: Cassava, Chlorophyll, Color sensor, SPAD-502, GPS positioning
INTRODUCTION
Cassava (Manihot esculenta Crantz) is an important food and energy crop in Thailand, used in a broad range of industries. Site-specific management of cassava production can help reduce inputs, enhance yield, and conserve agro-ecosystems. This requires an effective crop monitoring system that can observe plant health status, as well as its spatial variations across a field.
Crop sensing for diagnosing nutrient or stress status may require measuring multiple parameters. Chlorophyll content is a good parameter that reflects the amount of nitrogen (N), an essential element for a plant’s health, in leaves. Leaves with more chlorophyll are darker green, while those with less chlorophyll are light green or yellow. The color of cassava leaves, as quantified by a leaf color chart, is related to the N content of the leaves (Haripriya Anand and Byju, 2008). A color score of 2.65 has been established as a threshold for N fertilizer application (Byju and Haripriya Anand, 2009). Applying this knowledge, some studies have been carried out to develop algorithms and instrumental techniques for estimating chlorophyll or N content from leaf color in different crops, e.g., wheat and rye (Kawashima and Nakatani, 1998), barley (Pagola et al., 2009), and rice (Shibghatallah et al., 2013; Wang et al., 2014).
Chlorophyll content is often quantified using a commercial chlorophyll meter – SPAD-502 (Konica Minolta, Japan) – to non-destructively measure leaf greenness. The greenness values measured by this meter have been shown to correlate well with actual chlorophyll content as determined by chemical extraction (Markwell et al., 1995; Uddling et al., 2007). Haripriya Anand and Byju (2008) reported that SPAD values significantly correlated with leaf nitrogen content and yields for cassava, closely reflecting the effects of N fertilizer treatment, with the relationship dependent on leaf measurement position, growth stage, and cassava cultivar. Byju and Haripriya Anand (2009) further suggested that SPAD values less than 25 indicate an N deficiency that should be remedied by applying N fertilizer.
While the SPAD-502 meter has been widely adopted among researchers, it is too costly for most farmers to use in practice. In addition, the SPAD-502 meter does not have a mapping function. Given these two limitations, a lower cost device that offers mapping would be a useful development.
Therefore, the objective of this study was to develop an affordable device capable of estimating the chlorophyll content in cassava leaves that can simultaneously record GPS positions. This would allow farmers to monitor crop growth and manage fields more precisely.
MATERIALS AND METHODS
Fabrication of a low-cost sensor to measure and map chlorophyll
The sensor consisted of a color sensor (RGB TCS230, TAOS Inc., USA) with 64 photodiodes arranged in an 8×8 array with a typical color measurement range of 350 to 750 nm. The photodiodes consisted of four groups: three were filtered to detect red (R), green (G), and blue (B) colors (RGB); the last group was left unfiltered. The photodiodes functioned by changing the light intensity into a frequency response with a duty cycle of 50% and a response time to output of 100 ns. A minimum luminance of 100 lx was required. According to the manufacturer,
nonlinearity error of the sensor was 0.2% at 50 kHz and the sensitivity to temperature changes was rated at 0.02%/°C. A microcontroller (ATmega328, Atmel, USA) was used to control the color sensor by programming using Arduino Alpha software. Incident light stimulated the photodiodes to generate a current signal and this was then converted into a frequency signal that was sent to the output pin (Figure 1). The full-scale output frequency was scaled down to 20%. The output signals were separately recorded by the program as fR, fG, and fB, representing the primary chromatics R, G, and B, respectively.
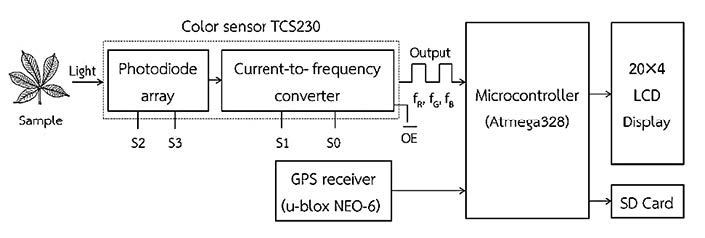
Figure 1. Functional components and signal processing of the sensor.
The color sensor was illuminated by four LEDs, giving an illuminance of about 552 lx as measured by a light meter (DK-211, Denki, USA). The entire sensing portion was covered with a black plastic cap to prevent undesirable disturbance from external light. The distance between the sensor and object was 15 mm. A GPS receiver (NEO-6, u-blox AG, Switzerland) was installed in the device to register the chlorophyll measurement position. The horizontal position accuracy of the GPS module was 2.5 m, with an update rate of 5 Hz. All colors, GPS positions, and calculated leaf greenness data were displayed on a 20×4 LCD screen and recorded on an SD card memory (Figure 2).
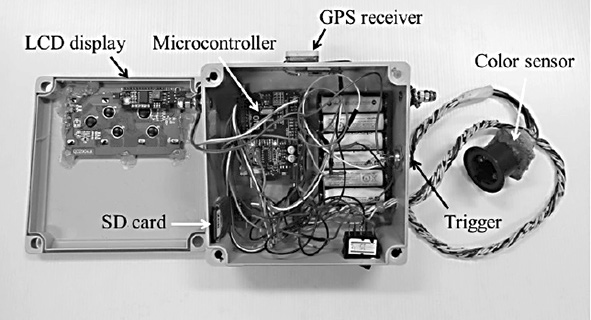
Figure 2. Fabricated low-cost sensor.
Color calibration and validation
The sensor was calibrated to convert frequency outputs to RGB values using 28 color charts of known RGB values. By correlating frequency outputs with the corresponding RGB values, a set of equations for calculating RGB values were established by means of multiple linear regression processing in Minitab® (Minitab Inc.).
The calibrated sensor was tested by comparing to a commercial color analyzer (RGB-1002, Lutron, Taiwan) using 110 color plates from TOA Color World Fandex as sample objects. The accuracy of the sensor was evaluated based on Euclidean distance, ΔE (Plataniotis and Venetsanopoulos, 2000) defined by:
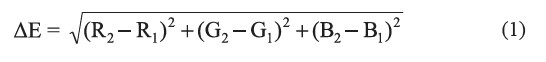
where R1, G1, and B1 are actual red, green, and blue values read by a standard color analyzer, and R2, G2, and B2 are red, green, and blue values read by the developed sensor. An ΔE value of less than 30 was considered acceptable (Lin and Tsai, 2014).
Cassava leaf chlorophyll calibration and validation
Chlorophyll in the leaves of 10-month old cassava plants (Rayong 72 cultivar) in a field in Nong Lan, Tha Maka, Kanchanaburi (14°02ˊ 02.0400˝ N, 99°49ˊ 32.4120˝E) was measured using the developed and control sensors. Two hundred ninety-five plants were randomly selected for measurement from a sample area of about 0.5 ha. A single leaf on the third branch from the top of each plant was measured using the developed sensor in parallel with a standard chlorophyll meter SPAD-502 (Konica Minolta, Japan). One hundred ten of the plants were used to
derive a calibration equation and the remaining 185 were used for validation. The accuracy was assessed in terms of the root mean square error (RMSE), expressed by:
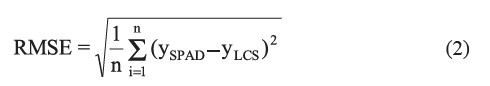
where ySPAD is the actual leaf greenness measured by the SPAD-502 meter, yLCS is the observed leaf greenness read by the developed sensor and, n is the number of data.
RESULTS
Accuracy in color measurement
The sensor was calibrated using a generated color chart. As a result, a set of calibration equations for converting the frequency outputs into RGB values could be derived as follows:
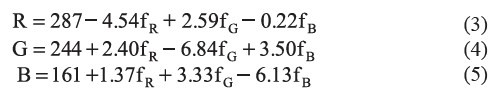
where fR, fG, and fB represent the frequency outputs in Hz of red, green, and blue colors, respectively. R, G, and B represent the color scale of red, green, and blue, ranging from 0 to 255.
Using the color analyzer to verify the developed sensor, the color values obtained from the developed sensor correlated well with the control sensor, the SPAD-502 meter (Figure 3). However, the developed sensor slightly underestimated RGB values at higher values. The Euclidean distance, ΔE ranged from 1.61 to 63.31, with an average of 17.62; as this is lower than 30, the colors were not significantly different.
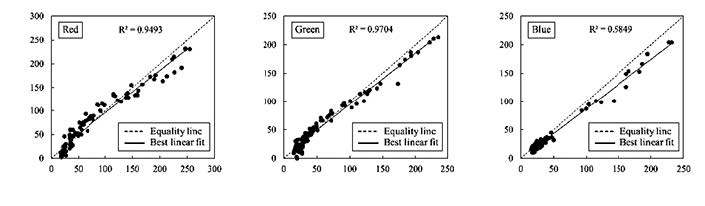
Figure 3. Comparison of the RGB color values measured by the developed low-cost sensor and commercial color analyzer.
Accuracy of measuring cassava leaf chlorophyll
The SPAD-502 meter measured greenness values ranging from 4.3 to 55.8 in the 295 cassava leaves. Using 110 of these measurements for calibration data, we derived the following calibration equation for converting RGB values to leaf greenness:

Validation of the developed low-cost sensor showed that the values strongly correlated with those measured by the SPAD-502, with an R2 of 0.97 (Figure 4) and an RMSE of 0.9688, implying the validity of the developed sensor. The actual chlorophyll content can be estimated using these leaf greenness values, if their relationship is known.
Application of the developed low-cost sensor in chlorophyll mapping
GPS positions at the sites of measurement were recorded along with the leaf greenness. Figure 5 illustrates a contour map describing the spatial variation of the leaf greenness of the cassava plants in the field. In general, the chlorophyll content was relatively higher in the cassava plants along the field edges, and lower in the middle. The pattern of chlorophyll variability between that observed by the SPAD-502 meter and the developed sensor agreed well.
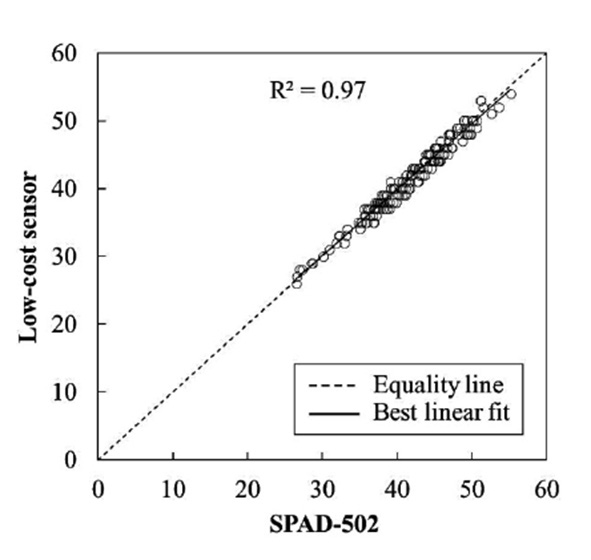
Figure 4. Comparison of cassava leaf greenness measured by the develop lowcost sensor and the SPAD-502 meter.
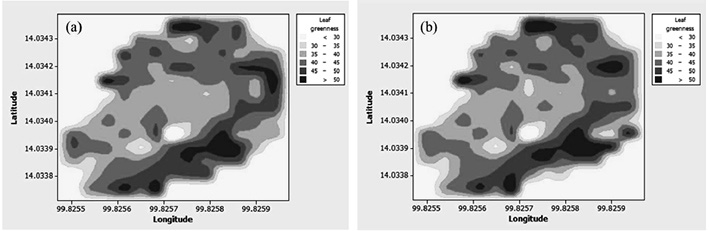
Figure 5. Spatial variation of cassava leaf greenness using data from (a) the developed low-cost sensor and (b) the SPAD-502 meter.
DISCUSSION
This study was primarily interested in developing an accurate low-cost color sensor for use with cassava leaves. The sensor developed here compared well to measurements taken using the more expensive and standard SPAD-502 meter, at a fraction of the cost – USD 100 compared to USD 2,600.
Maleki et al. (2012) compared the leaf greenness of lettuce as measured by a color sensor and by the SPAD-502, resulting in an R2 of 0.83. The author explained that the error may have occurred due to the interference of ambient light. Furthermore, the distance between the sensor and object seemed to affect the sensing accuracy; the best accuracy was achieved at distances between 10 and 30 mm, while increasing the distance to 80 mm resulted in an R2 of only 0.22, i.e., the lowest accuracy.
The sensor we used in this study slightly underestimated RGB values at higher values; this can be attributed to the characteristics of its photodiode-type sensor. The photocurrent generated by the photodiode typically increases proportionally with increasing incident light power, but at higher current levels, the photocurrent becomes saturated and remains constant with increasing incident light power, resulting in a nonlinear characteristic. Furthermore, the referenced color analyzer uses a phototransistor-type sensor that generated larger current gain.
Light source was another factor influencing color measurement in our study. Our low-cost sensor used four white LEDs arranged perpendicular to the object plane, whereas the control sensor used only two white LEDs arranged at a 45-degree angle. The differences in these sensors and their light source arrangement probably explains the small discrepancies we found when comparing colors.
Wang et al. (2014) has demonstrated the possibility of using color indices to predict leaf chlorophyll content. By means of digital still image analysis, the author found that color indices derived from RGB, HSV, and L*a*b* color models correlated significantly with SPAD readings of rice leaves. Using multiple linear models, the SPAD values can be predicted with the best R2 of 0.55 and a RMSE of 1.62. This compared to our values for R2 of 0.97 (Figure 4) and RMSE of 0.9688. Therefore, the present study supported the concept of simple chlorophyll measurement from leaf color, but with better performance than earlier research.
In conclusion, we have successfully developed a low-cost, portable sensor for estimating and mapping chlorophyll content in cassava leaves. Validation of the sensor demonstrated a capability of quantifying the amount of chlorophyll expressed in terms of leaf greenness. Comparison with the SPAD-502 meter indicated a strong correlation with a coefficient of determination of 0.97, and a RMSE of 0.9688, indicating a satisfactory accuracy. In addition, the device is capable of recording GPS positions, allowing a farmer to observe the spatial variation of plant health across a field, which in turn enables the farmer to manage the crop more precisely. With a production cost of less than 100 USD, our sensor offers a promising alternative for small-scale farmers.
ACKNOWLEDGEMENTS
Kasetsart University Research and Development Institute financially supported this research.
REFERENCES
Byju, G., and Haripriya Anand, M. 2009. Leaf color chart and chlorophyll-meter-based leaf nitrogen estimation and their threshold values for real-time nitrogen management in cassava. Communications in Soil Science and Plant Analysis. 40: 2816-2832. http://dx.doi.org/10.1080/00103620903173830
Haripriya Anand, M., and Byju, G. 2008. Chlorophyll meter and leaf colour chart to estimate chlorophyll content, leaf colour, and yield of cassava. Photosynthetica. 46(4): 511-516. doi: 10.1007/s11099-008-0087-8
Kawashima, S., and Nakatani, M. 1998. An algorithm for estimating chlorophyll content in leaves using a video camera. Annals of Botany. 81: 49-54. doi: https://doi.org/ 10.1006/anbo.1997.0544
Lin, B.S., and Tsai, S.T. 2014. Pattern search and style analysis for the design of comic figures. In: Meen, T.H., Prior, S.D., and Lam, A.D.K.T. editors. Innovation, Communication and Engineering. Proceedings of the 2nd International Conference on Innovation, Communication and Engineering, Qingdao, China, 26 October–1 November 2013, CRC Press by Taylor and Francis Group, Boca Raton: 639-642. https://doi.org/10.1201/b15935-165
Maleki, M., Massah, J., and Dehghan, M. 2012. Application of spectral sensor for the assessment of nitrogen content in lettuce plants. Australian Journal of Crop Science. 6(2): 188-193.
Markwell, J., Osterman, J., and Mitchell, J. 1995. Calibration of the Minolta SPAD-502 leaf chlorophyll meter. Photosynthesis Research. 46(3): 467-472. doi: 10.1007/BF00032301
Pagola, M., Ortiz, R., Irigoyen, I., Bustince, H., Barrenechea, E., Aparicio-Tejo, P., Lamsfus, C., and Lasa B. 2009. New method to assess barley nitrogen nutrition status based on image color analysis: Comparison with SPAD-502. Computers and Electronics in Agriculture. 65: 213-218. https://doi.org/10.1016/j.compag.2008.10.003
Plataniotis, K.N., and Venetsanopoulos, A.N. 2000. Color Image Processing and Applications. Springer-Verlag Berlin Heidelberg.
Shibghatallah, M.A.H., Khotimah, S.N., Suhandono, S., Viridi, S., and Kesuma, T. 2013. Measuring leaf chlorophyll concentration from its color: A way in monitoring environment change to plantations. AIP Conference Proceedings. 1554(1): 210-213. doi: 10.1063/1.4820322
Uddling, J., Gelang-Alfredsson, J., Piikki, K., and Pleijel, H. 2007. Evaluating the relationship between leaf chlorophyll concentration and SPAD-502 chlorophyll meter readings. Photosynthesis Research. 91(1): 37-46. doi: 10.1007/s11120-006-9077-5
Wang, Y., Wang, D., Shi, P., and Omasa, K. 2014. Estimating rice chlorophyll content and leaf nitrogen concentration with a digital still color camera under natural light. Plant Methods. 10: 36. doi: 10.1186/1746-4811-10-36.
Tanapat Sookchalearn and Wanrat Abdullakasim*
Department of Agricultural Engineering, Faculty of Engineering at Kamphaeng Saen, Kasetsart University, Nakhon Pathom 73140, Thailand
*Corresponding author. E-mail: fengwra@ku.ac.th
Total Article Views