 ISSN: 2822-0838 Online

Climate Change Vulnerability Mapping for the Greater Mekong Sub-region
Kittiwet Kuntiyawichai*, Vichian Plermkamon, Ramasamy Jayakumar, and Quan Van DauPublished Date : 2019-08-23
DOI : https://doi.org/10.12982/CMUJNS.2017.0013
Journal Issues : Number 3 , July-September 2017
ABSTRACT
Climate change poses a serious threat to the environment, socio-economic development, and livelihoods, especially those in developing countries, where severe natural disasters are common. Adaptation strategies and mitigation responses for the world’s most vulnerable people are needed, including in the Greater Mekong Sub-region (defined here as Cambodia, Lao PDR, Myanmar, Thailand, and Vietnam, and excluding Yunnan Province, China). Within this context, this study aims to identify the most vulnerable areas to climate change and climate-induced water problems in the Mekong countries. The study used the framework of the Intergovernmental Panel on Climate Change (IPCC) in 2001, by looking at the exposure, sensitivity, and adaptive capacity of an area to adapt or recover from the effects of hazardous climate events. The results showed that Mekong countries would be affected more severely by major natural disasters, including tropical cyclones, floods, and droughts. Among the Mekong countries, we found that Thailand had a high adaptive capacity to climate change, whereas the western coastline of Myanmar and the Cambodian Mekong lowland region were the most vulnerable areas.
Keywords: Climate change, Human Development Index, Exposure, Sensitivity, Adaptive capacity
INTRODUCTION
Climate change research is of importance and considerable current interest (Chooprateep and McNeil, 2014). According to the Intergovernmental Panel on Climate Change (IPCC) in 2001, developing countries will be more vulnerable to climate change than developed nations. Most developing countries in Asia lack the capacity to adapt to climate change, and need external support (Francisco, 2008). According to the United Nations (2014), the Asia-Pacific region is the world’s most natural disaster-prone region, with a three-fold increase in the number of deaths due to disasters between 2004 and 2013, and one of the poorest, with 41.2 percent of people living in areas prone to natural hazards (United Nations, 2014). In addition, damage from natural disasters have also increased due to the abnormal global climate (Weesakul et al., 2014).
Therefore, the effects of climate change and vulnerability at the regional level must be urgently addressed in order to prepare adaptation strategies for minimizing/avoiding current and future damage. The increasing frequency and intensity of tropical cyclones, floods, droughts, landslides and rising sea levels due to climate change have significantly affected human lives, economic activities, physical assets, and the environment in the Mekong countries. Yusuf and Francisco (2009) attempted to map climate change vulnerability in Southeast Asia using data from 1980 to 2000. However, their study did not include Myanmar and some other Mekong areas, although did include other Southeast Asian countries (see Table 1). In addition, it did not include institutional aspects important to the adaptive capacity component of a vulnerability assessment (see Table 1). In our study, we attempt to more narrowly, but comprehensively, focus on the Greater Mekong Sub-region, using a longer and more up-to-date data set (1980-2014), while including institutional capacity as a factor in mapping the region’s most vulnerable areas to climate change. Three factors – exposure, sensitivity, and adaptive capacity – were used to determine the vulnerability to climate change. This was mapped as a vulnerability index to climate change in each sub-national administrative area in five Mekong countries – Cambodia (24 provinces), Lao PDR (18 provinces), Myanmar (7 states and 7 divisions), Thailand (77 provinces), and Vietnam (63 provinces) – by taking into account areas and socio-economic sectors most at risk. Our findings will be useful for regional policymakers and external donors in better targeting and setting priority areas for their support towards climate change adaptation initiatives.
Table 1. Components of the vulnerability assessment used in Yusuf and Francisco (2009) versus this study.
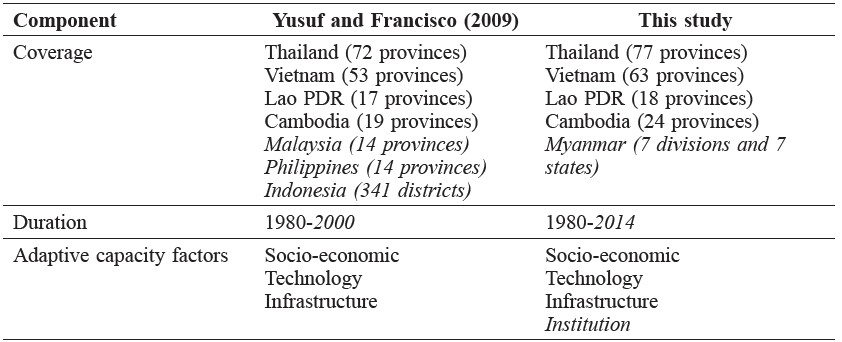
Note: Primary differences between the two studies in italics.
MATERIALS AND METHODS
Data collection
Climatic data from 1980 to 2014 were obtained from the Emergency Events Database of the Centre for Research into the Epidemiology of Disaster (CRED). Inundation mapping of a five-meter sea level rise (SLR), one of the variables reflecting climate change vulnerability, was taken from the Centers for the Remote Sensing of Ice Sheets. Life expectancy at birth, mean years of schooling, school life expectancy, and related information were obtained from the United Nations Development Programme (UNDP) country reports of the five Mekong countries. Information about standards of living, gross domestic product (GDP) per capita, and Purchasing Power Parity in USD were taken from various sources, such as the UNDP country reports and the websites of national statistical offices. In addition, the protected areas in 2014 were taken from the World Database on Protected Areas and population density in 2013 were derived from national statistical offices. The abovementioned primary datasets, their sources, and their references are listed in Table 2.
Table 2. List of primary datasets used in this study.
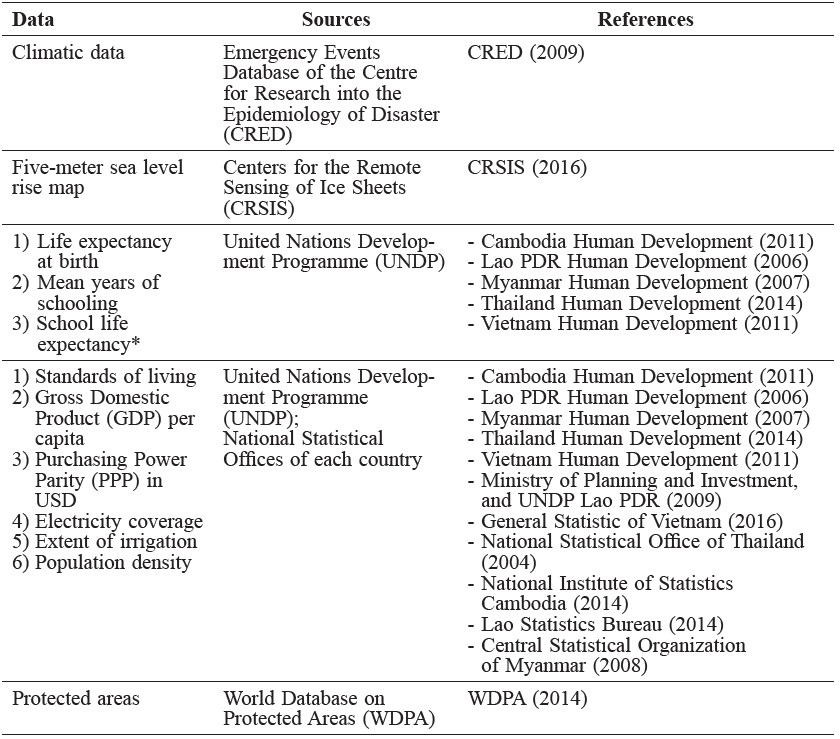
Note: *School life expectancy, as defined by UNESCO Institute for Statistics (2017), shows the overall level of development of an educational system in terms of the number of years of education that a child can expect to achieve.
Vulnerability assessment
We developed a clear conceptual framework as the essential first step in identifying the most vulnerable areas in the Mekong countries. This was key to understanding and defining the main concepts of the vulnerability assessment and their analytical relationships towards a broader mapping exercise. Mathematically, vulnerability is a function of exposure, sensitivity, and adaptive capacity, as described in Equation (1).
Vulnerability index = f (exposure, sensitivity, adaptive capacity) (1)
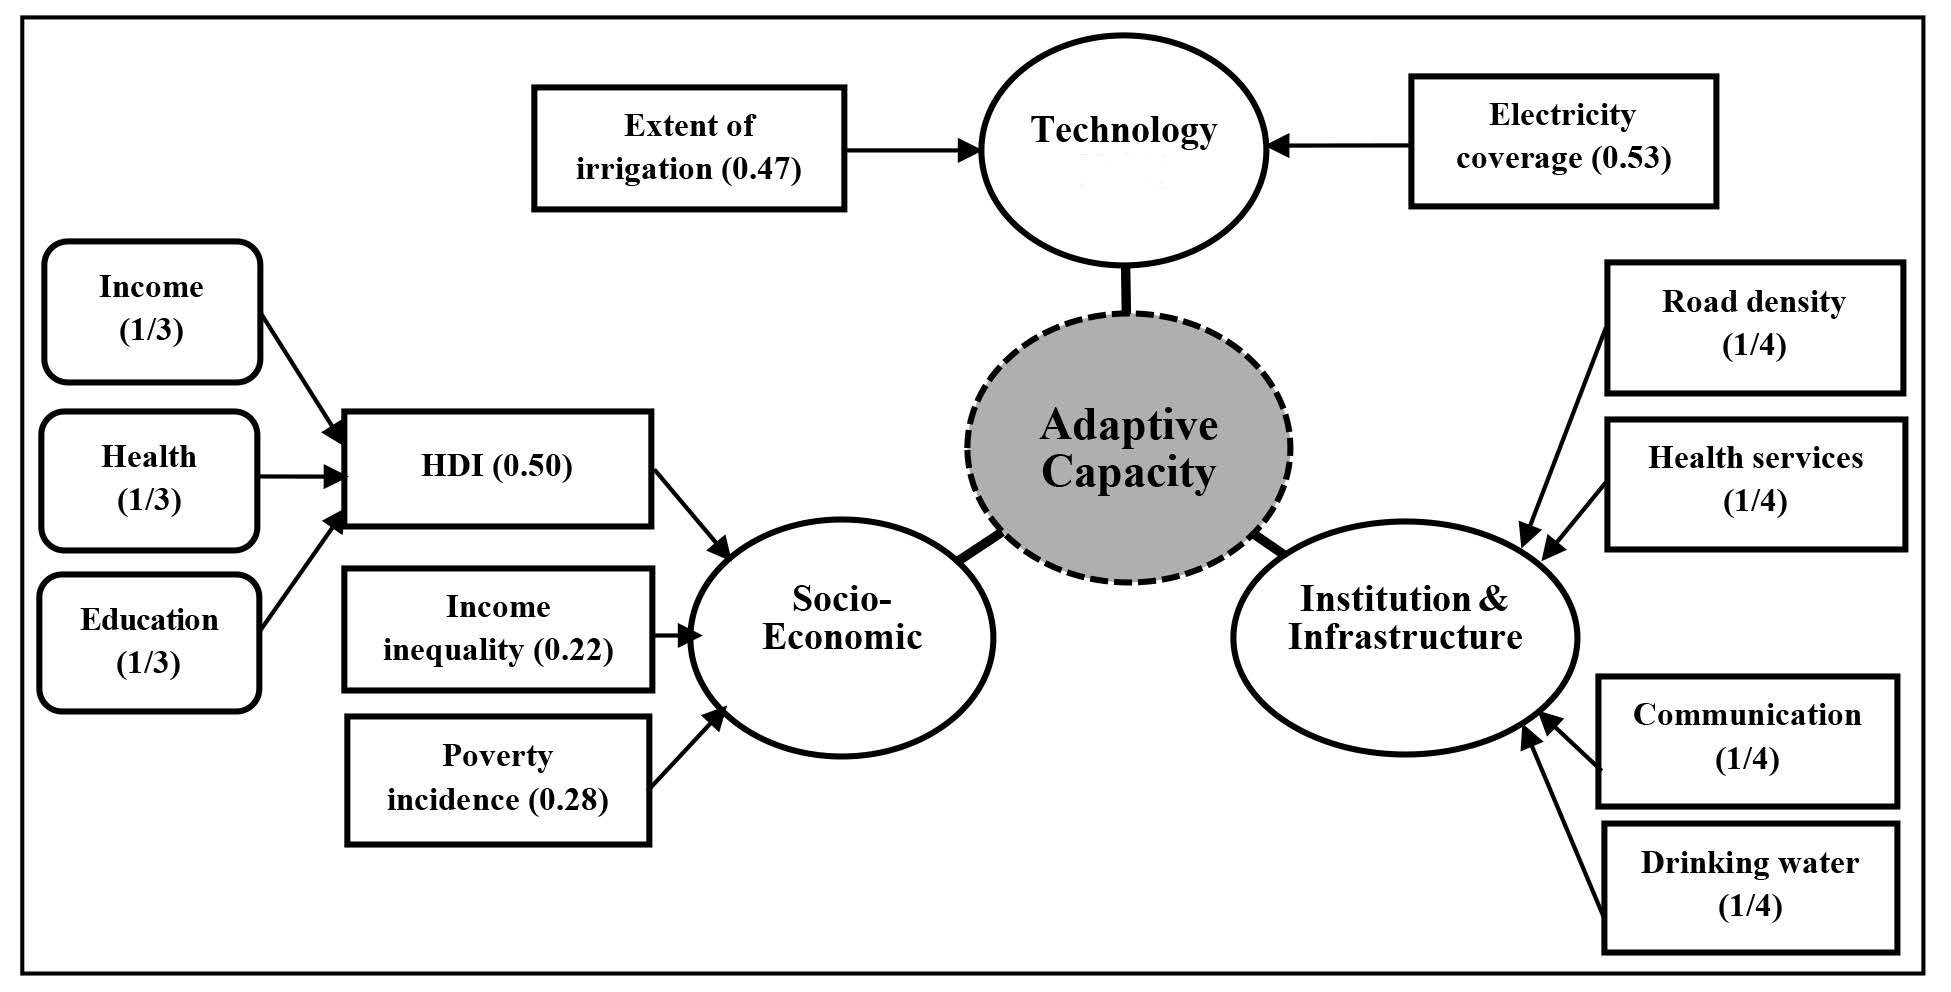
Figure 1. The framework for adaptive capacity assessment (modified from Yusuf and Francisco, 2009).
The exposure indicator was defined as the weighted average risks of tropical cyclones, floods, droughts, landslides, and a 5-meter SLR. Climatic data from 1980 to 2014 was used to delineate a multiple-risk mapping that provided the underlying exposure to climate risks.
Sensitivity was measured as the consequence of the human activity (population density) and land use management (protected area).
This study adopted the development framework for adaptive capacity from Yusuf and Francisco (2009) to derive the weights for each main indicator: socio-economic (0.50), technology (0.25), and institution and infrastructure (0.25) (note: institution, which refers to drinking water and health services, was added to the framework of Yusuf and Francisco (2009)). The scores in the brackets were derived using an ‘expert opinion polling’ method from the climate change expert consultation meeting held in Bangkok in 2008, as shown in the details in Figure 1.
In examining the relationship of vulnerability and resilience, the adaptive capacity was determined as a function of socio-economics, technology, institutions and infrastructure. For socio-economics, the Human Development Index (HDI), poverty incidence, and income inequality were considered to be critical indices among determinants of adaptive capacity, because of their impact on human resources and national development. In terms of technology, the regions with a greater technological capacity were considered better able to adapt (IPCC, 2001). We used electricity coverage and the extent of irrigation as our proxy for the adaptive capacity to climate resilience of an area’s technology. Institutions and infrastructure are important in estimating community resilience or vulnerability to climate change. As a proxy for these, we used secure access to transport facilities and infrastructure (i.e., road density), a reasonable access to communication and information for learning exchange (i.e., communication), strategic areas that secure a sufficient and accessible water supply (i.e., drinking water), and the availability of support services (i.e., health services).
The average scores of each indicator were weighted to arrive at an Adaptive Capacity Index (ACI). These ACI scores were calculated at the provincial level for all five Mekong countries in this study.
Data analysis
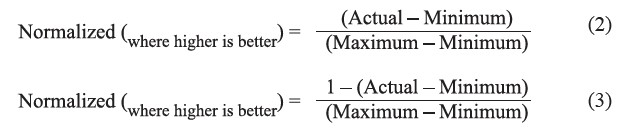
The indicators were normalized using two different equations. Equation (2) for indicators ‘where higher is better’ (for example, income capacity, education, and health, in our analysis) (UNDP, 2015) and Equation (3) for indicators ‘where lower is better’ (for example, poverty incidence and income inequality, in our analysis).
RESULTS
Thailand has the highest and Myanmar the lowest Human Development Index among the Mekong countries in 2014 (UNDP, 2016) (Table 3).
Table 3. Human Development Index for the greater mekong sub-region in 2014.
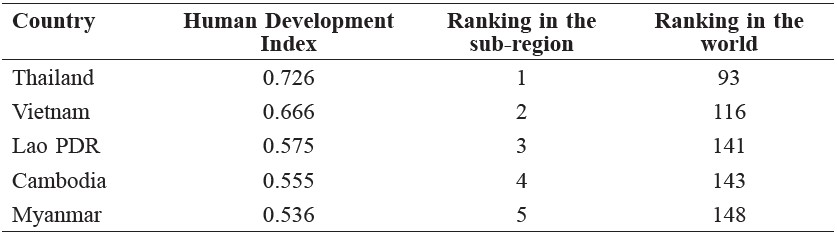
Figure 2(A) presents the ACI by province across the region. Bangkok has the highest adaptive capacity, with an ACI score of 0.82. The Chin State (0.18) and Rakhine State (0.22) in Myanmar had the lowest adaptive capacity. Adaptive capacity is generally inversely proportional to vulnerability, i.e., areas with higher adaptive capacity will be less vulnerable and better able to adapt to the effects of climate change. However, the adaptive capacity – vulnerability relationship is still heavily affected by other factors, such as exposure and sensitivity. In this sense, the determination of areas that are vulnerable to climate change can guide the vulnerability assessment and adaptation action to diminish future risks for vulnerable areas (see Figure 2(B)). This study found that the Mekong lowlands in Cambodia (e.g., Kandal, Takeo, Prey Veng, and Svay Rieng), and the west coast region of Myanmar (e.g., Ayeyarwady Division and Rakhine State) were the most vulnerable areas to climate change from 1980 to 2014, as shown in Figure 2(C).
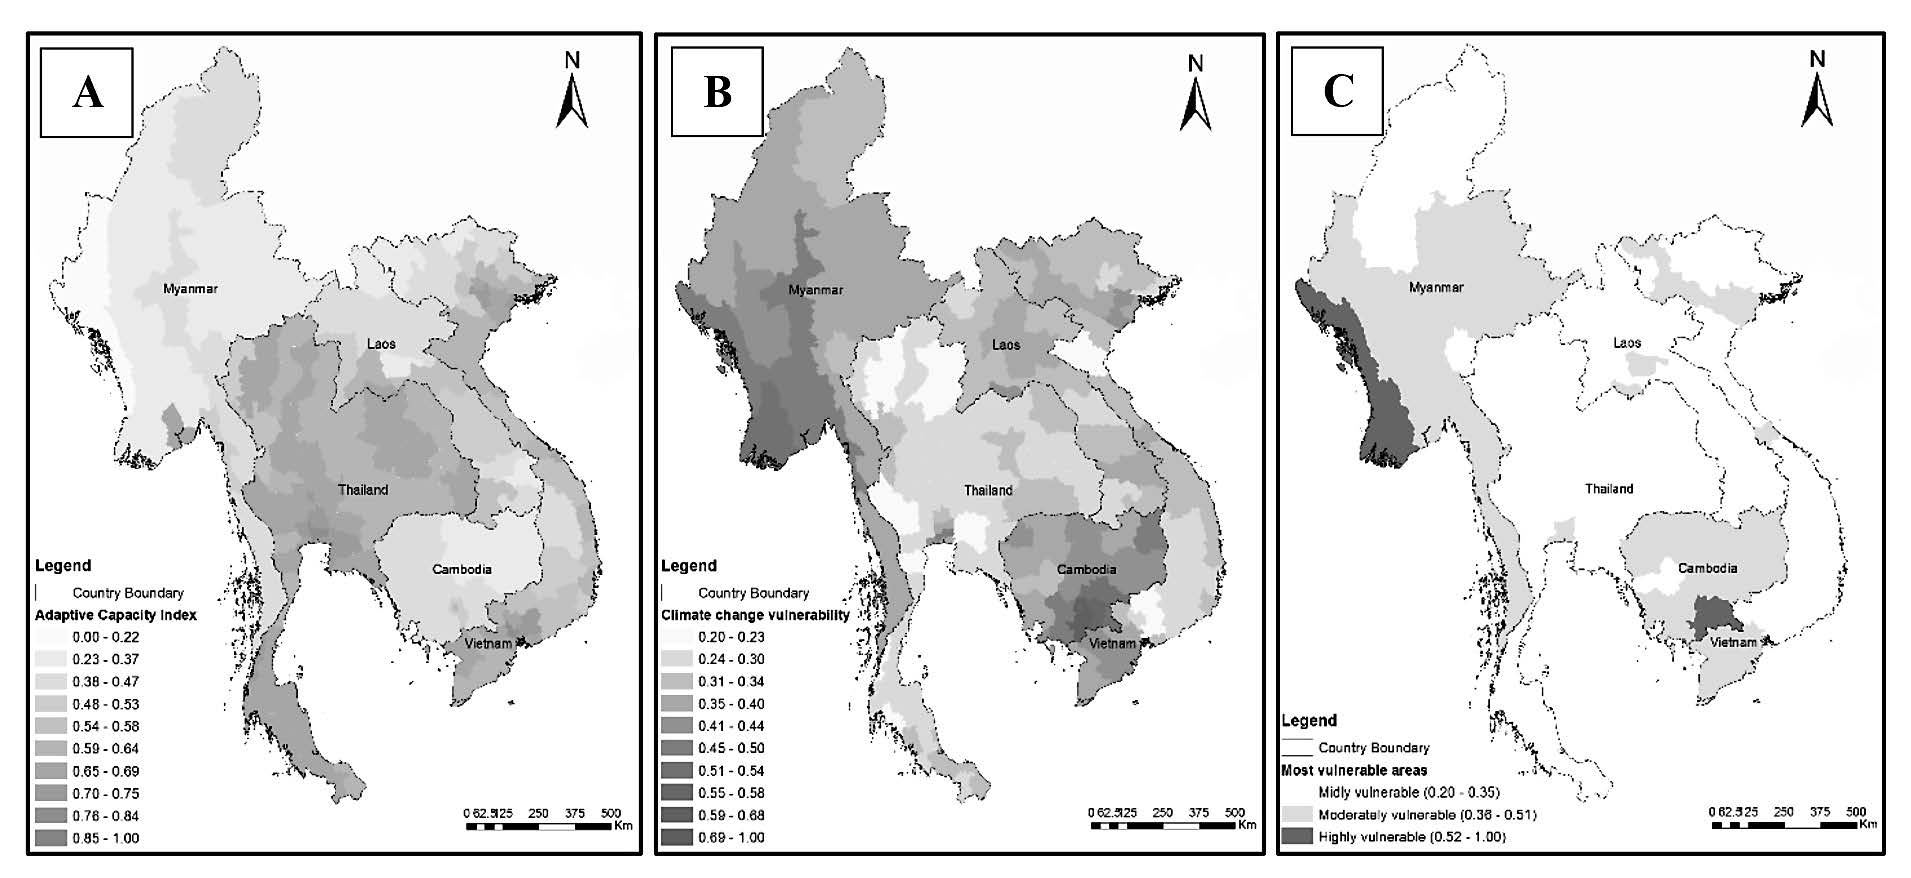
Figure 2. Maps of the (A) adaptive capacity, (B) vulnerability index and (C) the most vulnerable areas.
DISCUSSION
To verify the results of this study, the main findings from Yusuf and Francisco (2009) were used to compare the outputs of this assessment through the mapping of adaptive capacity, vulnerability, and vulnerable areas within the Mekong region. The results of this study and that of Yusuf and Francisco (2009) strongly correlated in terms of ACI and specific ACI locations; all of Thailand and coastal Vietnam had high ACI values, while Lao PDR, Cambodia, and northwest Vietnam had low ACI values (Figure 3). Areas of vulnerability were also similar in both studies (Figure 4), with less vulnerable areas located in Thailand and more vulnerable ones in Cambodia, for example (as noted, Yusuf and Francisco did not include Myanmar in their study). The area most vulnerable to climate change from 1980 to 2000 was the eastern region of Cambodia, according to Yusuf and Francisco (2009). For 1980-2014, we found that a different region in Cambodia was the most vulnerable – the Mekong lowland region in Cambodia (Figure 5).
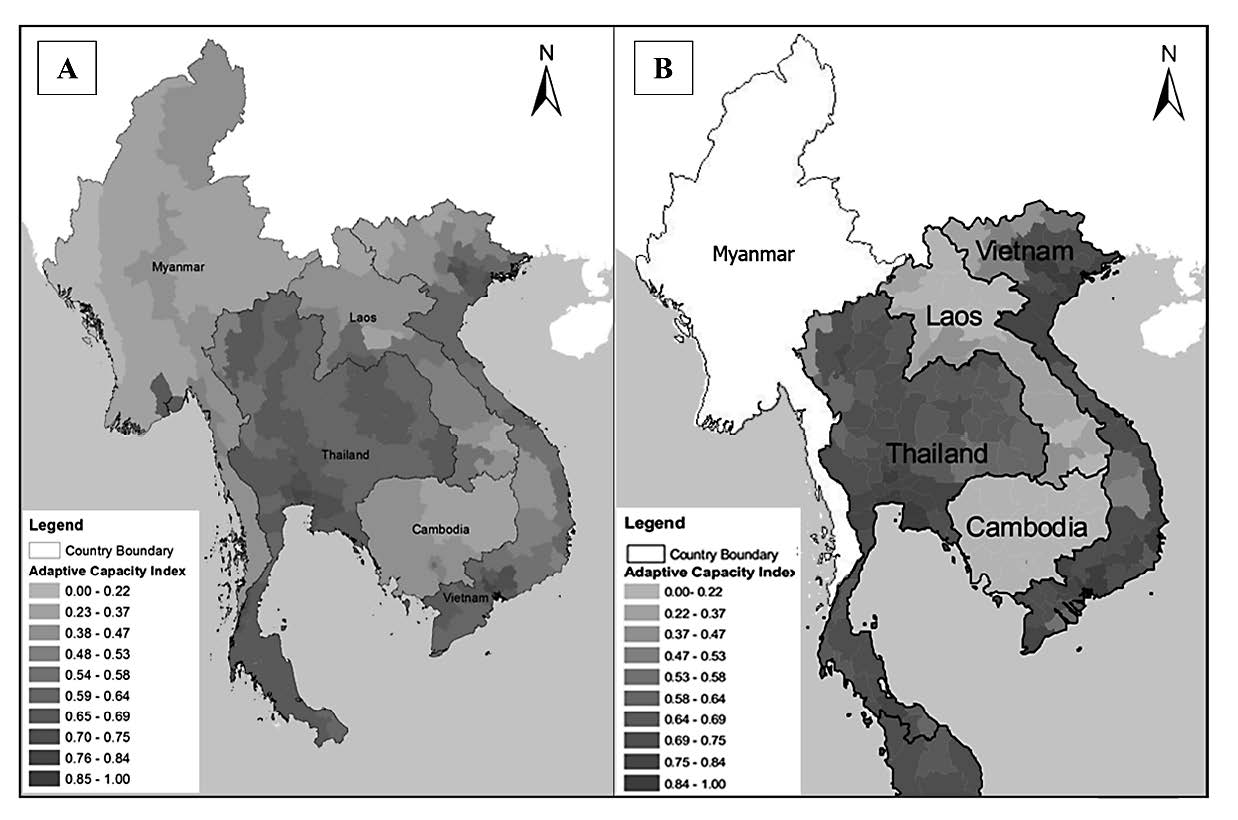
Figure 3. Spatial comparison of the Mekong Adaptive Capacity Indices between the results of (A) this study and (B) Yusuf and Francisco (2009).
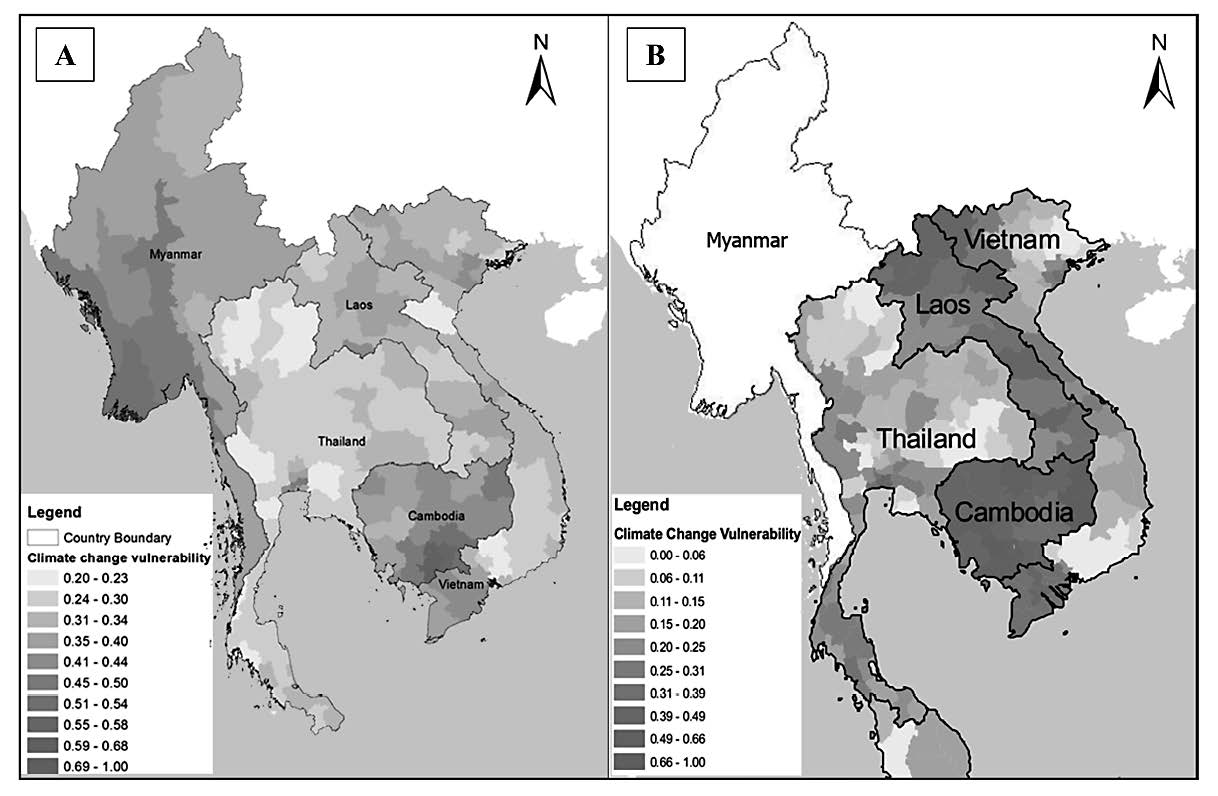
Figure 4. Spatial mapping of vulnerability to climate change in the Mekong countries based on the results of (A) this study and (B) Yusuf and Francisco (2009).
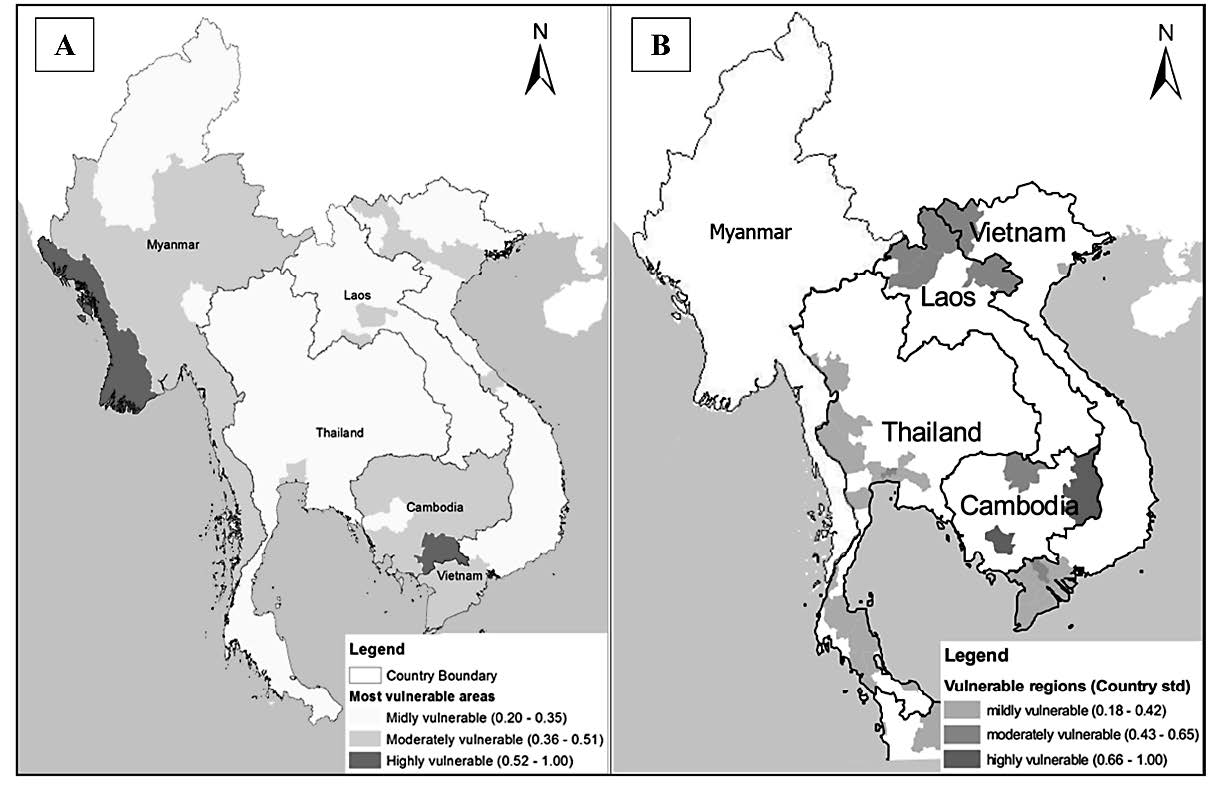
Figure 5. Spatial mapping of vulnerable areas to climate change in the Mekong countries based on the results of (A) this study and (B) Yusuf and Francisco (2009).
In our study, the western coast of Myanmar was equally vulnerable, an area that had not been included in the Yusuf and Francisco’s study. As for the Cambodia regions, both studies found similar vulnerability indices for the eastern and Mekong lowland regions. However, our study classified the areas differently in terms of vulnerable areas. The eastern region is mountainous with a very low population density (5 to 15 inhabitants/km2) and in highly protected areas, and thus we classified the area as moderately vulnerable, with less sensitivity and exposure to floods and sea level rise, compared to the Mekong lowland region that is typically devastated by natural disasters almost yearly.
ACKNOWLEDGEMENTS
The authors would like to acknowledge the generous financial support of UNESCO Bangkok: Asia and Pacific Regional Bureau for Education, as well the United Nations Development Programme (UNDP) for providing relevant secondary data. The authors also gratefully acknowledge the valuable comments and insightful suggestions of the reviewers, which have improved the quality of this study.
REFERENCES
Cambodia Human Development. 2011. Building resilience the fugure of rural livelihoods in the face of climate change. Final report. Ministry of Environment of Cambodia and UNDP Cambodia, p.189.
Chooprateep, S., and McNeil, N. 2014. Temperature changes in Southeast Asia: 1973-2008. Chiang Mai University Journal of Natural Science. 13(2): 105-116. doi: 10.12982/cmujns.2014.0025
Central Statistical Organization of Myanmar. 2008. Statistical yearbook 2015. Ministry of Planning and Finance. Retrieved on April 17th, 2016 from http://csostat.gov.mm/csocd.asp
CRED. 2009. EM-DAT database. Centre for Research on the Epidemiology of Disasters. Retrieved on January 12th, 2016 from http://emdat.be/database
CRSIS. 2016. Maps and GIS data: sea level rise maps. Centers for the Remote Sensing of Ice Sheets. Retrieved on January 15th, 2016 from https://cresis.ku.edu/content/research/maps
Francisco, H. 2008. Adaptation to climate change: needs and opportunities in Southeast Asia. ASEAN Economic Bulletin 25: 7-19. doi:10.1355/ac25-lb
General Statatistic of Vietnam. 2016. Statistical Data. Ministry of Planning and Investment. Retrieved on February 20th, 2016 from http://gso.gov.vn
IPCC. 2001. Climate change 2001: impacts, adaptation and vulnerability. In: Leary, N.A., McCarthy, J.J., Dokkhen, D.J., White, K.S., editors. Working Group II of the Intergovernmental Panel on Climate Change (IPCC). Cambridge: Cambridge University Press.
Lao PDR Human Development. 2006. International trade and human development. Final report. United Nations Development Programme, p. 244.
Lao Statistics Bureau. 2014. Statistical yearbook 2014. Ministry of Planning and Investment. Retrieved on March 12th, 2016 from http://lsb.gov.la/en/statistic2014.php
Ministry of Planning and Investment, and UNDP Lao PDR. 2009. Employment and livelihoods Lao PDR. The 4th National Humand Development report, Vientiane, p. 239.
Myanmar Human Development. 2007. Intergrated household living conditions survey in myanmar. Final report. Ministry of National Planning and Development, p. 50.
National Institue of Statistics Cambodia. 2014. Online statistic. Ministry of Planning. Retrieved on March 11th, 2016 from http://nada-nis.gov.kh/index.php/home
National Statisical Office of Thailand. 2004. Statistical data. Ministry of Information and Communication Technology. Retrieved on February 21th, 2016 from http://web.nso.go.th/ en/stat.htm
Thailand Human Development. 2014. Advancing human development through the Asean community. Final report. United Nations Development Programme, p. 184
UNDP. 2015. Training material for producing national human development reports. United Nations Development Programme. Retrieved on January 20th, 2016 from http://hdr.undp.org/ sites/default/files/hdi_training.pdf
UNDP. 2016. Human Development Index and its components. United Nations Development Programme. Retrieved on January 29th, 2016 from http://hdr.undp.org/en/composite/HDI
UNESCO Institute for Statistics. 2017. School life expectancy. Retrieved on May 26th 2017 from http://uis.unesco.org/en/glossary-term/school-life-expectancy
United Nations. 2014. Statistical yearbook for Asia and the Pacific. Virginia: United Nations Publications.
Vietnam Human Development. 2011. Social service for human development. Final report. United Nations Development Programme, p. 248
WDPA. 2014. Word database on protected areas dataset. Protected planet. Retrieved on February 4th, 2016 from http://wdpa.org
Weesakul, U., Singhratta, N., and Luangdilok, N. 2014. Rainfall forecast in northeast of thailand using modified k-nearest neighbor. KKU Engineering Journal. 41(2): 253-261.
Yusuf, A., and Francisco, H. 2009. Climate change vulnerability mapping for Southeast Asia. Economy and Environment Program for Southeast Asia (EEPSEA).
Kittiwet Kuntiyawichai1*, Vichian Plermkamon1, Ramasamy Jayakumar2 and Quan Van Dau1
1 Faculty of Engineering, Khon Kaen University, Khon Kaen 40002, Thailand
2 Natural Science Sector, UNESCO Bangkok, Bangkok 10110, Thailand
*Corresponding author. E-mail: kkitti@kku.ac.th
Total Article Views