 ISSN: 2822-0838 Online

A Comparison of the Physicochemical Properties of Parboiled Rice Exported from Thailand and Five Consumer Countries
Wassanai Wattanutchariya, Roengchai Tansuchat, Jidapah Ruennareenard, Tonapha Pusadee, and Chanakan Prom-u-thai*Published Date : 2017-04-01
DOI : https://doi.org.10.12982/CMUJNS.2017.0008
Journal Issues : Number 2 ,April - June 2017
ABSTRACT
This study compared the physicochemical properties of 39 parboiled rice samples exported from Thailand and 136 samples from five consumer countries, 26 from Spain, 25 from South Africa, 32 from the United Arab Emirates (UAE), 28 from Nigeria, and 25 from Saudi Arabia. The coefficient of variation among the characteristics of the collected parboiled rice samples both within and between the countries varied, indicating parboiled rice characteristics varied between Thailand, the exporting country, and the five consumer countries, as well as among the consumer countries, with color shade (lightness and whiteness), amylose content, and texture profile the key parameters. While cluster analysis of the 17 characteristics of parboiled rice samples collected from the six countries revealed that most samples shared similar characteristics, parboiled rice samples exported from Thailand differed the most from the samples from the consumer countries, especially with regard to hardness, gumminess, and color shade (both whiteness and *L values). To extend the Thai export market, the Thai producers of parboiled rice should adjust its characteristics to better match that consumed in the five countries.
Keywords: Parboiled rice, Physicochemical, Texture analysis, Proximate composition
INTRODUCTION
Parboiled rice is usually produced from paddy rice with high amylose content by parboiling – a process of soaking, steaming, and drying with the husk before milling (Unnikrishnan and Bhattacharya, 1987). Parboiling offers an attractive alternative rice product, due to its higher head rice yield and superior nutrient and mineral composition compared with non-parboiled raw rice (Choudhury, 1990; Heinemann et al., 2005; Fairulnizal et al., 2015).
Parboiling affects the physical and chemical properties of the rice grain, although the effect varies with parboiling methods (Islam et al., 2001). For example, pressure and dry heat make parboiled grains slightly longer and thinner, the consumers preferred form (Sowbhagya et al., 1993). Hardness, resulting from gelatinization during parboiling, is a well-known characteristic of parboiled rice compared with non-parboiled rice (Gonzalez et al., 2004). Parboiling parameters such as soaking time, temperature, and pH (Bhattacharya, 1996); steaming temperatures (Chinnaswamy and Bhattacharya, 1986); and drying temperatures (Mohandoss and Pillaiyar, 1982) also influence the grain color, flavor, and cooking quality of white rice. The texture and flavor of parboiled cooked rice also depend on rice variety, amylose content, gelatinization temperature, and processing techniques (Meullenet et al., 1998). Thus, understanding each factor’s effect during parboiling on rice grain morphology characteristics and chemical properties may help to optimize the color and favor of polished parboiled rice grains to best match the characteristics preferred by consumers. In addition, the unit price of parboiled rice is determined by its appearance and cooking quality after parboiling, which in turn depends on the selection of the rice variety and the processing technique, as described above.
Generally, processing of parboiled rice increases grain yellowness, odor/smell, and hard texture characteristics, which lowers consumer acceptance, especially in Thailand, where consumers, who do not usually eat parboiled rice, prefer an off-white colored grain. Consumer preferences for raw (non-parboiled) rice vary by region, culture, and popularity (Lyon et al., 1999). Regional preferences likely vary for parboiled rice as well, but variations in parboiled rice products, e.g. physical characteristics and chemical properties, among different regions have not yet been reported, This would be useful information, particularly for large producers like Thailand; Thailand exported nearly 10 million metric tons of all types of rice in 2015, of which more than 20% was parboiled rice (Thai Rice Exporters’ Association, 2015). We chose consumer parboiled rice samples from five countries, most of which have limited production potential for parboiled rice, to compare with Thailand’s parboiled rice export product.
This study aimed to evaluate the physicochemical properties and proximate profile of parboiled rice products collected from five consumer countries –Spain, South Africa, UAE, Nigeria, and Saudi Arabia – compared to parboiled rice samples exported from Thailand.
MATERIAL AND METHODS
Sample collection
One hundred thirty-six polished parboiled rice samples were collected from five consumer countries: 26 from Spain, 25 from the Republic of South Africa, 32 from the UAE, 28 from Nigeria, and 25 from Saudi Arabia. In Thailand, the producer/exporting country, 39 samples were randomly collected from the 14 biggest producers of parboiled rice in the central region. For the samples from the consumer countries, we purchased the available parboiled rice products from a variety of supermarkets, convenience stores, and local markets; where reported, the country of origin was recorded (Table 1). Where the country of origin was unavailable, import statistics could not be used as a proxy, as the import/export statistics do not separate parboiled rice products from other rice imports.
Table 1. Country of origin, where available, of the consumer rice samples.
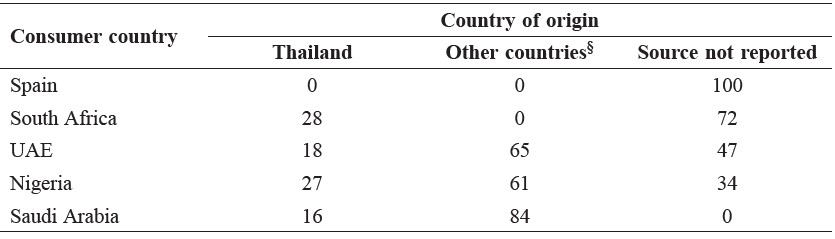
Note: §Other countries of origin include USA, UAE, India, Pakistan, Turkey, Lebanon, Nigeria, South Africa, and Saudi Arabia.
The parboiled rice samples were packed in polyethylene plastic bags and kept at 4°C until laboratory analysis to prevent color or physicochemical changes.
Analysis of physicochemical properties
Amylose content. The amylose content of the parboiled rice samples were stipulated based on the iodine-binding protocol (Juliano, 1971; Thomas et al., 2013). All the samples were measured for percentage transmittance of iodine solution intensity at 620 nm using a spectrophotometer (Hitachi, Model 3J0-0100, Japan). The total amylose content in the parboiled rice samples was determined on a calibrated standard amylose curve of potato starch.
Physical dimensions. The length (L) and breadth (B) at the middle of the polished parboiled kernels were measured using a vernier caliper according to the methods discussed in Thomas et al. (2013). Fifty milled parboiled kernels from each country were analyzed and the L/B ratio was calculated.
Color shade and whiteness. The color values (L*, a*, b*) of all the parboiled rice samples were determined using a colorimeter (Minolta, Model CR-400,Japan). L* values indicate the lightness (+) / darkness (−), a* the redness (+) /greenness (−), and b* the yellowness (+) / blueness (−). The colorimeter was calibrated before testing using standard white and brown plates. Each sample wastested three times and the values averaged. Whiteness was evaluated in a milling meter (Satake, Model DD1, Japan).
Texture profile analysis. Before texture analysis, a subsample of 300 g of each parboiled rice sample was cooked in an electric steamer with boiling water (heating up to 100°C, for 30 min) in the ratio of water to parboiled rice of 1.5:1 by weight. The cooked parboiled rice samples were transferred into plastic bags, then wrapped with aluminum foil and kept in a foam box to maintain the temperature at 70°C for analysis. The samples were analyzed using a texture analyzer (TA-XT Plus Texture Analyzer Stable Micro System, UK). Two cycles of compression tests were conducted for all samples. The cylinder-type measurement probe was 100 mm in diameter, and 8 mm from the probe to the base plate. All the test samples were compressed to 90% strain at a speed of 1 mm/s. The forcetime curve, which was generated using Exponent 32 software, implied maximum force. The textural parameters collected from the force-time curve were hardness, adhesiveness, cohesiveness, springiness, gumminess, and chewiness (a measurement of the elastic recovery of the sample) (Bello et al., 2006; Sareepuang et al., 2008). The texture profile analysis was repeated 15 times for each sample.
Proximate composition analysis. This study examined the moisture, ash, crude fat, protein, and carbohydrate content of parboiled rice. The moisture content of parboiled rice flour was determined by the standard protocol (AOAC, 2000) after freezing at -20°C overnight and drying with lyophilizer until a constant weight was obtained. The parboiled rice samples were heated in a muffle furnace at 450°C for 3 hours to evaluate the ash content according to the methods outlined in Pearson (1976). For crude fat extraction, the rice flour was analyzed using a TFE-2000 instrument (LECOR Corporation, 2002); the parameters were set at 9000 psi extraction pressure, 100°C extraction temperature, 100°C HRV temperature, 15 min hold time, 45 min extraction time, and 2 lpm flow rate. The Kjeldahl method was used to determine the total nitrogen and crude protein using 6.25 as the nitrogen-to-protein (N:P) conversion factor (LECOR Corporation, 2008). The total carbohydrate content of the sample was calculated using the following formula:
Carbohydrate (%) = 100% – (% moisture +% proterin + % fat + % ash)
Statistical analysis. The statistical significance of the obtained data was determined using analysis of variance (ANOVA), and the different means were evaluated by Tukey’s HSD post-hoc test using Minitab software. P-values <0.05 were considered significant. Principal component analysis (PCA) was performed based on the physicochemical properties using the statistical analysis software XLSTAT, version 2015.5.01.23234 (Kovach Computing Service).
RESULTS
Physical dimension
Variation in the length (2.4-9.7% CV), breadth (1.8-11.5% CV), and length/breadth ratio (2.5-16.9% CV) of the grain was observed within and between the samples collected from the six countries (Table 2). Within a country, the samples collected from Saudi Arabia had the most uniform grain shape, while those from South Africa were the least uniform. Between the different countries, only a slight difference in the grain dimension was observed (p<0.05) (Table 2). The length and the breadth of parboiled rice kernel from different countries were in the ranges of 6.6-7.2 mm and 2.0-2.2 mm, respectively. The shortest and the widest grains were found in Spain and Nigeria, respectively, in comparison with the other countries, while the L/B ratio was in the same range among the countries.
Table 2. Grain length, breadth, and L/B ratio of milled parboiled samples exported from Thailand and the five consumer countries.
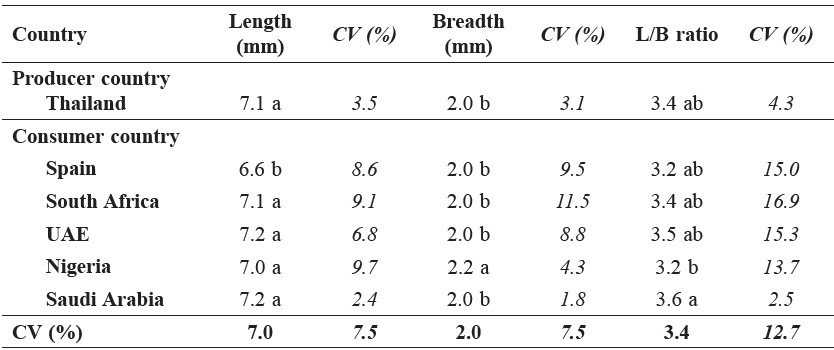
Note: The values are means averaged from 50 grains. Different lower case letters in the same column indicate significant difference at p<0.05.
Color shade
The color shade of the collected parboiled rice samples varied within and between the countries, as observed by the coefficient of variation (Table 3). Within a country, the samples from South Africa had the widest variation in lightness (9.2% CV) and redness (204% CV), while those from Spain were the most uniform shade (1.5% CV of lightness and 61.6% CV of redness). On the other hand, yellowness varied within the samples from South Africa (15% CV), Nigeria (16.1% CV), and Saudi Arabia (16.7% CV) samples, compared to Thailand (10.7% CV), Spain (6.1% CV), and the UAE (11.2% CV). Between the countries, significant difference in color shade was observed (p<0.05) (Table 3). The lightest color was found in the parboiled rice samples from Thailand, South Africa, and the UAE, while the darkest was observed in the samples from Spain and Nigeria; the samples from Saudi Arabia were in the middle. The samples from Spain, South Africa, the UAE, and Nigeria were redder, while those from Thailand were greener, with Saudi Arabia between these two. Yellowness was a similar shade across the samples from all countries.
Table 3. Color shade values (L*, a*, and b*) of parboiled rice samples exported from Thailand and five consumer countries.
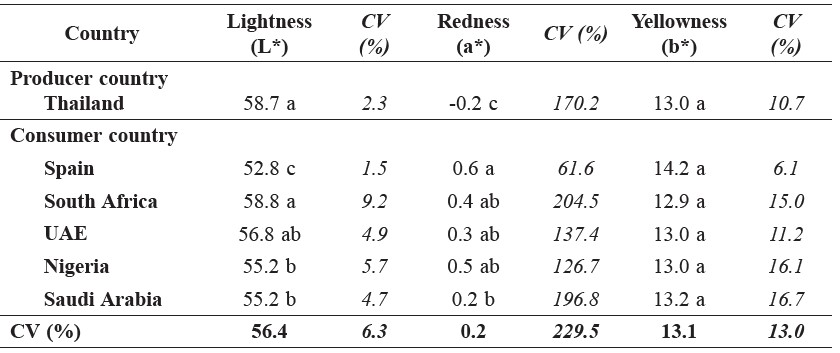
Note: Different lower case letters in the same column indicates significant difference at p<0.05.
Whiteness, amylose content, and hardness
The whiteness, amylose content, and hardness varied among the parboiled rice samples within and between the countries (Table 4). Within a country, whiteness varied the most in the samples from Nigeria and Saudi Arabia (45.0-46.0% CV) compared with the samples from the other countries (24.6-35.7% CV), while the amylose content was highest in the sample from South Africa (21.4% CV), and hardness values were highest in the samples from Thailand (59.3% CV) and South Africa (40.0% CV). Whiteness differed significantly among the samples from different countries (p<0.05) (Table 4). The samples collected from Spain were darker than the samples from the other countries. Samples from South Africa and Saudi Arabia had lower amylose content (20.0%), Thailand, Spain, and Nigeria higher amylose content (24.0%), and the UAE was in the middle (22.3%). Samples from Thailand had the hardest texture among the parboiled rice samples, with South Africa the softest, and the others in between.
Table 4. Whiteness, amylose content, and hardness of parboiled rice samples exported from Thailand and five consumer countries.
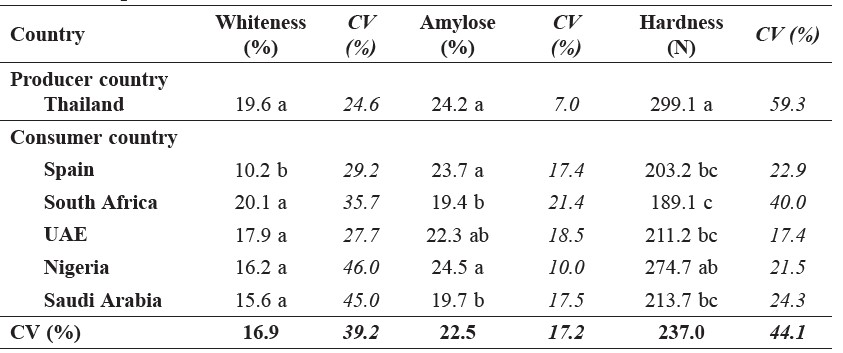
Note: Different lower case letters in the same column indicates significant difference at p<0.05.
Table 5. Texture profile analysis of cooked parboiled rice samples exported from Thailand and the five consumer countries (n=15).
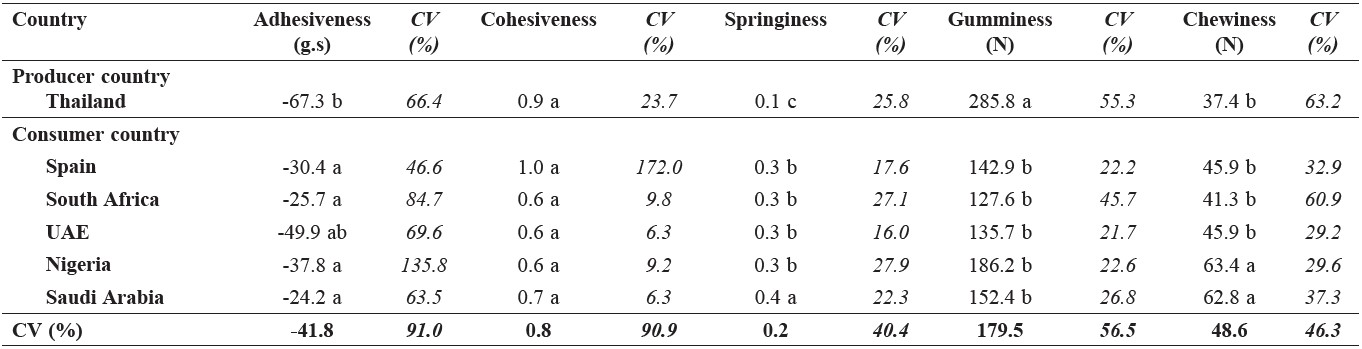
Note: Means±S.D. with the same letter in a vertical line do not differ significantly from one another (p>0.05).
Analysis of texture profiles
The texture profile analysis showed variation among the parboiled rice samples within and between countries (Table 5). Significant difference was observed between the countries in each of the profiles (p<0.05). The adhesiveness of the samples from the UAE and Thailand were the same; adhesiveness of the other countries was lower. Springiness was lowest in the Thailand samples and highest in the samples from Saudi Arabia. Thailand had the gummiest samples. The chewiness was highest in the samples from Nigeria and Saudi Arabia; the rest were lower and similar.
Proximate compositions
The moisture, protein, crude fat, carbohydrate, and ash content of the parboiled rice samples collected were observed to vary both within and between countries (Table 6). Moisture (3.8-7.2% CV), protein (6.6-10.4% CV), and carbohydrate (0.9-1.3% CV) content varied narrowly among the samples within a country, while crude fat (19.4-63.5% CV) and ash (15.1-35.9% CV) content varied widely; South Africa had the widest variation among the samples. Significant difference was observed among the countries in all the compositions (p<0.05) (Table 6). Moisture content varied from 9.2-11.1%, with the samples from Thailand the moistest and Saudi Arabia the driest. The total protein and fat content values were slightly different among the countries; South Africa was the highest and Thailand the lowest. The carbohydrate and ash content values did not differ between the samples from the different countries.
Principal component analysis. Principal component analysis (PCA) was used to investigate the traits that were decisive in sample differentiation between the parboiled rice samples collected from six different countries on the basis of all the physicochemical properties (Figure 1). The eigenvalues obtained by PCA on the physicochemical properties indicated that the first two components provided a good summary of the data, accounting for 38.9% of the total variance. The first principal component (F1) was mainly influenced by the color shade values of L*, a*, and b*, as well as springiness and moisture, while the second component (F2) was mainly influenced by hardness, gumminess, chewiness, and protein content, indicating that those properties were the major properties that contributed to the variation found between the parboiled rice samples from the six countries. Most of the parboiled rice samples from the six countries were clustered in the middle of the PCA group, while the majority of the parboiled rice samples from Thailand were scattered from the major cluster to the upper and the lower right quadrants of the graph.
Table 6. Proximate compositions of parboiled rice samples exported from Thailand and the five consumer countries (n=3).
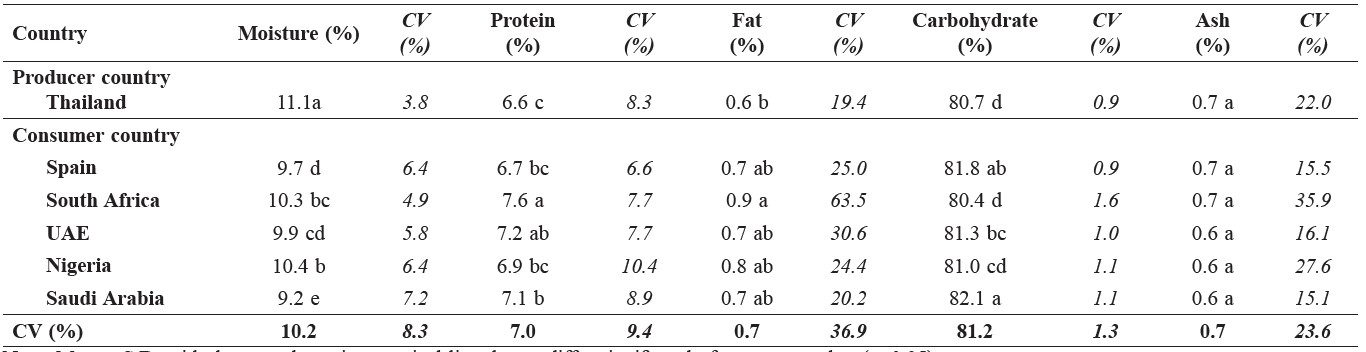
Note: Means±S.D. with the same letter in a vertical line do not differ significantly from one another (p>0.05).
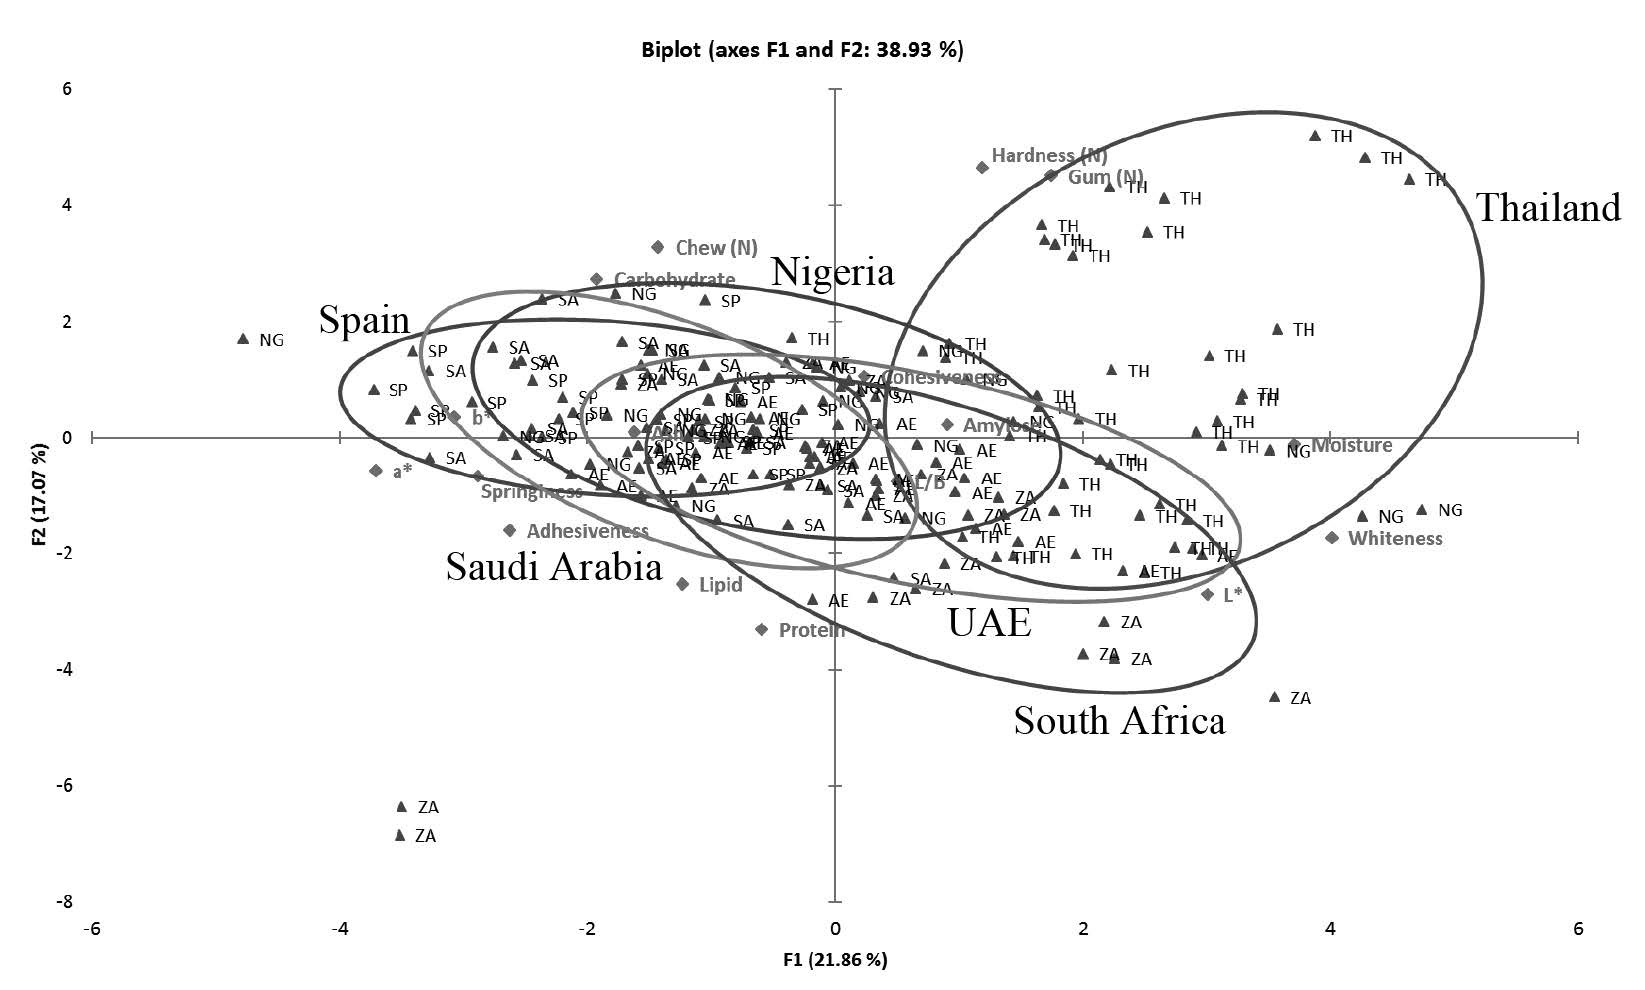
Figure 1. The relationship between the physicochemical properties of the 175 parboiled rice samples collected from six different countries as analyzed by principal component analysis (PCA).
DISCUSSION
The parboiled rice samples in this study were collected among five consumer countries where parboiled rice is usually consumed among their population in comparison with the exported parboiled rice samples from Thailand, where practically no parboiled rice is consumed, but 2-3 million tons of polished parboiled rice is exported every year (Rerkasem et al., 2007; Prom-u-thai et al., 2009). While the consumer samples included some rice of Thai origin, in no country where the source could be verified did the consumer samples contain more than 30% Thai
rice. The other countries of origin for the consumer samples included USA, UAE, India, Pakistan, Turkey, Lebanon, Nigeria, South Africa, and Saudi Arabia.
This study is the first to demonstrate variations in the physicochemical properties between the collected parboiled rice samples both within and between countries, especially among the consumer countries, suggesting a difference in the characteristics of locally consumed parboiled rice among consumers in the different regions. This should be useful information for Thai producers of parboiled rice.
Color shade is another physical characteristic that affects consumer preferences, and is dependent on the nature of the country, culture, region, and income (Toquero, 1990). The yellowish shade is unique to parboiled rice (Bhattacharya, 2004), as indicated by the b* value compared with that of non-parboiled rice; the yellow shades were similar among the countries we sampled. The magnitude of lightness (L* value) could be the key color characteristic that differentiates the physical characteristics of parboiled rice available in the producer (Thailand) and consumer countries; the exported samples from Thailand and those from South Africa and UAE were in the same range, the samples from Nigeria and Saudi Arabia samples were slightly darker, and the samples from Spain were the darkest shade. Thus, for Thailand’s export product to better match the characteristics of consumer parboiled rice in Nigeria, Saudi Arabia, and Spain, the grain lightness may need to be adjusted. The color shade of parboiled rice grain can be adjusted by varying the parboiling time and temperature, which affects starch gelatinization; this in turn affects the melanoidin compounds formed in the Maillard reaction (Lamberts et al., 2006; Parnsakhorn and Noomhorm, 2008; Dutta and Mahanta, 2012; Dutta et al., 2015).
The amylose content in the grain is important to the cooking quality, suitability for eating, and pasting behavior of rice. Rice with a high amylose content cooks dry and fluffy, but it can become hard after cooling as the amylose molecules are retrograded, while low amylose content results in cooked rice having a soft texture (Adu-Kwarteng et al., 2003; Sattari et al., 2015). The variety of rice affects the amylose content in parboiled rice, as the ratio of amylose/amylopectin is genetically controlled (Juliano and Gonzales, 1989). In our study, the parboiled rice samples from Spain, Nigeria, and Thailand had higher amylose content than the others. Although similar, these samples still differed in their textural attributes, such as hardness, adhesiveness, and gumminess, as other factors also affect the texture of parboiled rice, including protein content, lipid content, and parboiling conditions; these would need to be factored into tailoring parboiled rice attributes for a particular market. Parboiling causes chemical changes in the rice, including starch gelatinization. Not only does this affect color as discussed above, but also texture. The soaking time and temperature during parboiling affect the degree of starch gelatinization, which in turn is responsible for many of the quality attributes for the texture profile of parboiled rice grain (Marshall et al., 1993; Miah et al., 2002). During parboiling, amylose molecules leak out of the micellar network and diffuse into the surrounding aqueous medium outside the granules, before the granules become fully hydrated (Hermansson and Svegmark, 1996).
Proximate analysis may not reveal the major characteristics separating parboiled rice samples of different countries. Most of the parboiled samples collected from the six countries were clustered in the middle of the PCA group, which suggests that they share similar physicochemical properties, although they were clustered according to the country where the samples were collected. That the consumer samples in the different countries shared countries of origin – up to 30% with the Thai producer samples, and possible overlap among the multiple ‘other’ countries of origin – may be responsible for some of the similarity in characteristics reported here. However, despite this partial overlap in samples, the fact that the rice samples within and among the countries still showed significant differences in their characteristics showed that regional differences existed.
Interestingly, the majority of the parboiled rice samples exported from Thailand were scattered from the major cluster to the upper and the lower right quadrants of the graph, indicating that the parboiled rice samples from Thailand were the most different from or dissimilar to the parboiled rice samples from the five consumer countries. Those samples exported from Thailand that are scattered from the main cluster to the upper right of the graph correlated with the hardness and gumminess variables, while the samples in the lower right quadrant correlated with the color shade of whiteness and *L values. This divergence in characteristics between the exported parboiled rice from Thailand and the consumer countries sampled here may reflect differences with the parboiled product from other producer countries, including USA, Pakistan, Turkey, Lebanon, India, and Bangladesh found among the samples collected in this study.
As many factors, in addition to consumer preferences, including price, import/export quotas, supply chain issues, and contracts, may affect the parboiled rice available at the consumer level in the countries we sampled, additional studies are needed to more precisely identify to what extent the differences in regional characteristics of parboiled rice reported here reflect cultural or consumer preferences.
Our comparative analysis of the physicochemical characteristics of parboiled rice samples exported from Thailand and consumer parboiled rice samples available in five importing countries has shown regional variations in parboiled rice characteristics.
ACKNOWLEDGEMENTS
The Agricultural Research Development Agency and the National Research University Program of Thailand’s Commission on Higher Education funded this research. The research would not have been successful without the collaboration of research teams from the Faculty of Economics, Faculty of Business Administration, Faculty of Agro-Industry, and Faculty of Agriculture, Chiang Mai University.
REFERENCES
Adu-Kwarteng, E., W.O. Ellis, I. Oduro, and J.T. Manful. 2003. Rice grain quality: a comparison of local varieties with new varieties under study in Ghana. Food Control. 14: 507-514.
AOAC. 2000. Official Method of Analytical of AOAC International. 17th edition, AOAC International, Maryland, USA.
Bello, M., R. Baeza, and M.P. Tolaba. 2006. Quality characteristics of milled and cooked rice affected by hydrothermal treatment. Journal of Food Engineering. 72: 124-133.
Bhattacharya, K.R. 2004. Parboiling of Rice. 3rd ed. St. Paul, Minnesota, USA: American Association of Cereal Chemists, Inc.
Bhattacharya, S. 1996. Kinetics on colour changes in rice due to parboiling. Journal of Food Engineering. 29: 99-106.
Chinnaswamy, R., and K.R. Bhattacharya. 1986. Pressure parboiled rice-a new base for making expanded rice. Journal of Food Science and Technology. 23: 1-6.
Choudhury, N.H. 1990. Parboiling and consumer demand for parboiled rice in South Asia. Rice grain marketing and quality issues selected papers from the International Rice Research Conference, August 27-31, 1990: 47-54.
Dutta, H., and C.L. Mahanta. 2012. Effect of hydrothermal treatment varying in time and pressure on the properties of parboiled rices with different amylose content. Food Research International. 49: 655-663.
Dutta, H., C.L. Mahanta, and V. Singh. 2015. Changes in the properties of rice varieries with different amylose content on dry heat parboiling. Journal of Cereal Science. 65: 227-235.
Fairulnizal, M.N., M.K. Norhayati, A. Zaiton, A.H. Norliza, S. Rusidah, A.R. Aswir, M. Suraiami, M.N. Mohd Naeem, A. Jo-Lyn, J. Mohd Azerulazree, B. Vimala, and T. Mohd Zainuldin. 2015. Nutrient content in selected commercial rice in Malaysia: An update of Malaysian food composition database. International Food Research Journal. 22 (2): 768-776.
Gonzalez, R.J., A. Livore, and B. Pons. 2004. Physico-Chemical and cooking characteristics of some rice varieties. Brazilian Archives of Biology and Technology. 47 (1): 71-76.
Heinemann, R.J.B., P.L. Fagundes, E.A. Pinto, M.V.C. Penteado, and U.M. Lanfer-Marquez. 2005. Comparative study of nutrient composition of commercial brown, parboiled and milled rice from Brazil. Journal of Food Composition and Analysis. 18: 287-296.
International Rice Research Institute. 1980. Annual report for 1980. Los Banos, Laguna, Philippines. 25-38.
Islam, M.R., P. Roy, N. Shimizu, and N. Kimuratoshi. 2002. Effects of processing condition on physical properties of parboiled rice. Food Science and Technology Research. 8 (2): 106-112.
Juliano, B.O. 1971. A simplified assay for milled-rice amylose. Cereal Science Today. 16: 334-338.
Juliano, B.O., and L.A. Gonzales. 1989. Physicochemical and economic aspects of rice grain quality. Selected papers and abstracts from the International Rice Research Conference, Hangzhou, China, 1987, 275-290.
Lamberts, L. K., Brijs, R. Mohamed, N. Verhelst, and J.A. Delcour. 2006. Impact of browning reactions and bran pigments on color of parboiled rice. Journal of Agricultural and Food Chemistry. 54 (26): 9924-9929.
LECOR Corporation. 2002. TFE2000 Fat Extractor, TFE 2000 Instruction Manual. Part Number 200-671, December.
LECOR Corporation. 2008. FP-528 Protein/ Nitrogen Determinator, FP-528 DSP Instruction Manual. Part Number 200-626, May.
Lyon, B.G., E.T. Champagne, B.T. Vinyard, W.R. Windham, F.E. Barton, B.D. Webb, A.M. McClung, K.A. Moldenhauer, S. Linscombe, K.S. McKenzie, and D.E. Kohlwey. 1999. Effects of degree of milling, drying condition, and final moisture content on sensory texture of cooked rice. Cereal Chemistry. 76(1): 56-62.
Marshall, W.E., J.I. Wadsworth, L.R. Verma, and L. Velupillai. 1993. Determining the degree of gelatinization in parboiled rice: Comparison of a subjective and objective method. Cereal Chemistry. 70 (2): 226-230.
Meullenet, J. F. C., J. Gross, B. P. Marks, and M. Daniels. 1998. Sensory descriptive texture analyses of cooked rice and its correlation to instrumental parameters using an extrusion cell. Cereal Chemistry. 75: 714-720.
Miah, M. A. K., A. Haque, M. P. Douglass, and B. Clarke. 2002. Parboiling of rice. Part I: Effect of hot soaking time on quality of milled rice. International Journal of Food Science and Technology. 37(5): 527–537.
Mohandoss, R., and P. Pillaiyar. 1982. Influence of parboiling and drying methods on the quality of parboiled rice. Madras Agriculture Journal. 69: 185.
Parnsakhorn, S., and A. Noomhorm. 2008. Changes in physicochemical properties of parboiled brown rice during heat treatment. Agricultural Engineering International: the CIGR E-journal.
Pearson, D. 1976. The chemical analysis of food, Churchill Livingstone 7th ed., N.Y.
Prom-u-thai, C., S. Fukai, D.I. Godwin, B. Rerkasem, and L. Huang. 2008. Iron-fortified parboiled rice – A novel solution to high iron density in ricebased diets. Food Chemistry.110: 390-398.
Rerkasem, B. 2007. Having your rice and eating it too: a view of Thailand’s green revolution. ScienceAsia. 2007: 33 (Supplement 1): 75-80.
Sareepuang, K., S. Siriamornpun, L. Wiset, and N. Meeso. 2008. Effect of soaking temperature on physical, chemical and cooking properties of parboiled fragrant rice. World Journal of Agricultural Sciences. 4(4): 409-415.
Sattari, A., N. Mahdinezhad, B. Fakheri, M. Noroozi, and H. Beheshtizadeh. 2015. Improvement of the eating and cooking qualities of rice: a review. International Journal of Farming and Allied Sciences. 4 (2): 153-160.
Sowbhagya, C.M., S.Z. Ali, and B.S. Ramesh. 1993. Effect of parboiling on grain dimensions of rice. Journal of Food Science and Technology. 30: 459-461.
Thai Rice Exporters Association. 2015. Rice Export Quantity and Value: 2015 (by types of rice and destinations). [Online] http://www.thairiceexporters.or.th accessed: Feb 16, 2016.
Thomas, R., W.A. Wan-Nadiah, and R. Bhat. 2013. Physiochemical properties, proximate composition, and cooking qualities of locally grown and imported rice varieties marketed in Penang, Malaysia. International Food Research Journal. 20 (3): 1345-1351.
Toquero, Z.F. 1990. Consumer demand for rice grain quality. Rice grain marketing and quality issues selected papers from the International Rice Research Conference, August 27-31, 1990; 37-46.
Unnikrishnan, K.R., and K.R. Bhattacharya. 1987. Properties of pressure-parboiled rice as affected by variety. Cereal Chemistry. 64 (4): 321-323.
Wassanai Wattanutchariya1, Roengchai Tansuchat2, Jidapah Ruennareenard1, Tonapha Pusadee3 and Chanakan Prom-u-thai3,4*
1 Advanced Manufacturing Technology Research Center, Department of Industrial Engineering, Faculty of Engineering, Chiang Mai University, Chiang Mai 50200, Thailand
2 Faculty of Economics, Chiang Mai University, Chiang Mai 50200, Thailand
3 Agronomy Division, Department of Plant and Soil Sciences, Faculty of Agriculture, Chiang Mai University, Chiang Mai 50200, Thailand
4 Lanna Rice Research Center, Chiang Mai University, Chiang Mai 50200, Thailand
*Corresponding author. E-mail: chanakan15@hotmail.com, chanakan.p@cmu.ac.th
Total Article Views