
Production of Reducing Sugars from Hydrolysis of Napier Grass by Acid or Alkali
Duangkanok Tanangteerapong*, Thanawat Tunjaroensin, Parkpoom Trakun-ung and Khanita KamwilaisakPublished Date : 2017-01-01
DOI : 10.12982/cmujns.2017.0003
Journal Issues : Number 1 ,January - March 2017
ABSTRACT
This study investigated the effects of particle size and type of acid and alkali on hydrolysis of napier grass to obtain reducing sugars. Dried napier grass was milled and sieved through a 60, 80, or 100 sieve mesh. Hydrolysis was performed in an autoclave at 122°C and 15 psi; the hydrolysis time was varied at 60, 90, 120, or 150 minutes. Each size of dried napier grass was hydrolyzed in four solutions: hydrochloric acid, sulfuric acid, potassium hydroxide, and calcium hydroxide at the same concentration of 2% v/v. The concentrations of obtained reducing sugars were examined with the phenol-sulfuric method and compared with a calibration curve of a standard glucose solution. The results showed that acid hydrolysis yielded a significantly higher concentration of reducing sugar than alkaline hydrolysis. Moreover, hydrolysis with hydrochloric acid yielded the highest concentration of reducing sugar (44.24 g/L at 90 minutes), which was slightly higher than that with sulfuric acid (41.83 g/L at 150 minutes). Alkali hydrolysis yielded only very low concentrations of reducing sugar, despite hydrolysis times of more than 150 minutes. SEM images highlighted the differences in napier grass structure between untreated and afterhydrolysis samples. TGA analysis on the napier grass residue explained the effect of hydrolysis on the degradation of light volatile compounds in napier grass.
Keywords: Napier grass, Hydrolysis, Reducing sugar, Phenol-sulfuric method
INTRODUCTION
Napier grass (or elephant grass) is a perennial grass widely used for animal feed. It has also been identified as a promising feedstock candidate for bio-based alternative energy (Lewandowski et al., 2003). Napier grass can be harvested in 3-4 months and is resistant to drought (Angima et al., 2002). Lignocellulosic material in napier grass has been converted through hydrolysis with acidic or alkaline solutions, in which the chemical bonds of the material are broken down (Takata et al., 2013). The hydrolysis yields glucose, unless the reaction is partially completed, in which case cellobiose is obtained. Aguilar et al. (2002) found that 2% sulfuric acid and 122°C were the optimal conditions for hydrolysis of sugar cane bagasse with sulfuric acid; 90% of the hemicellulose was hydrolyzed. In this research, dried napier grass was hydrolyzed with four different acidic and alkaline solutions in order to obtain the reducing sugars. The factors affecting the concentration of reducing sugar, such as particle size and hydrolysis time, were investigated.
MATERIAL AND METHODS
Materials
Fresh napier grass was provided by Sriwiroj Company (Thailand). All chemicals in this project were purchased from Sigma Aldrich (Thailand).
Pretreatment of Napier grass
Napier grass was dried at 100°C for 48 hours until the weight was constant. Dried napier grass was milled with a hammer mill and sieved through a 60, 80, or 100 screen mesh corresponding to a particle size of 250, 177, and 140 micron, respectively.
Hydrolysis condition
Samples of 10 g of dried napier grass at each particle size were mixed with 100 mL of acidic (hydrochloric or sulfuric acid) or alkaline (potassium hydroxide or calcium hydroxide) solution at a concentration of 2% v/v and placed in the autoclave at 122°C and 15 psi.
Phenol-sulfuric method
Phenol (1 mL) was added into 1 mL of sample taken from the autoclave at 60, 90, 120, and 150 minutes. After that, 5 mL of sulfuric acid (96%) was added into the same solution and the color change was noticed. The concentration of reducing sugar was determined using a UV-Vis spectrophotometer at 490 nm and a calibration curve of the standard glucose curve as shown in Figure 1.
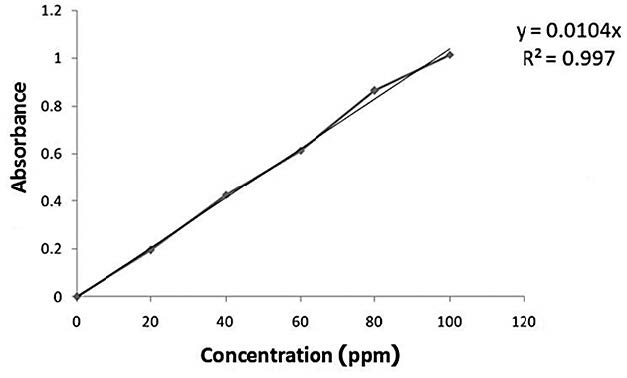
Figure 1. Calibration curve of standard glucose solution.
SEM analysis
The Research Instrument Center, Khon Kaen University kindly assisted with the SEM visualization of napier grass. Samples were coated with a 30 nm layer of gold before observing under a scanning electron microscope (Carl Zeiss, Leo/1450).
TGA analysis
TGA analysis of fresh and treated napier grass was performed in a flow of nitrogen at heating rate of 10°C/min. The analysis was performed from 20 to 500°C, then held for 20 min before exposed to a flow of air.
RESULTS
Hydrolysis with acid and alkali
Figure 2 shows the effect of two acids (hydrochloric or sulfuric acid) and two alkalis (potassium hydroxide or calcium hydroxide) on the concentration of reducing sugar at different hydrolysis times of napier grass particle size of 100 mesh. The highest concentration of reducing sugar (44.24 g/L) was obtained when the acid HCl was used for 90 minutes. With sulfuric acid, the concentration was slightly less (41.87 g/L), despite a longer hydrolysis time of 150 minutes. Calcium hydroxide reacted rapidly with napier grass within 60 minutes, resulting in a declining concentration afterwards. The reaction of potassium hydroxide and napier grass was completed at 120 minutes, when a similar concentration of reducing sugar was observed.
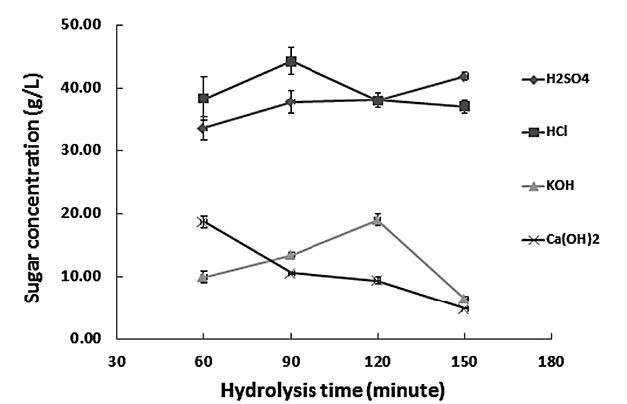
Figure 2. The effect of various acids and alkalis on the concentration of reducing sugar (g/L) at different hydrolysis times (minutes) of napier grass particle size of 100 mesh.
Effect of particle size on the concentration of reducing sugar
Figure 3 shows the effect of particle size on the concentration of reducing sugar (g/L) of napier grass hydrolyzed with HCl at different times. Smaller particle sizes resulted in a slightly higher concentration of reducing sugar. Napier grass sieved through a 100 screen mesh resulted in the highest reducing sugar concentration of 44.24 g/L after 90 min of hydrolysis time. However, a similar concentration of 44.02 g/L can be obtained from bigger particles sieved through an 80 screen mesh, although this requires a longer hydrolysis time.
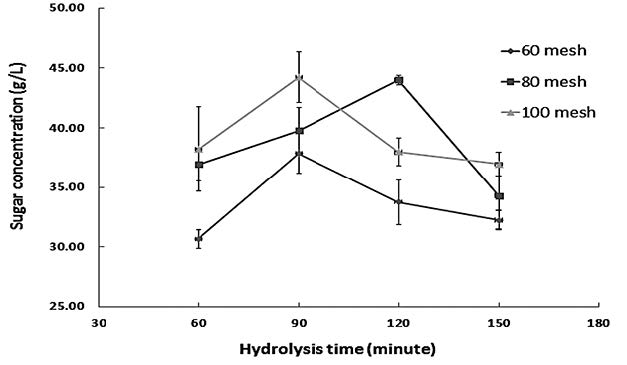
Figure 3. The effect of particle size on the concentration of reducing sugar (g/L) obtained from hydrolyzing napier grass with HCl at different times.
SEM analysis
SEM images shown in Figure 4 highlight the differences between untreated napier grass (a) and after hydrolysis with hydrochloric acid for 90 minutes (b). Treatment with acid disrupted the hemicellulose of napier grass, leading to the porous structure.
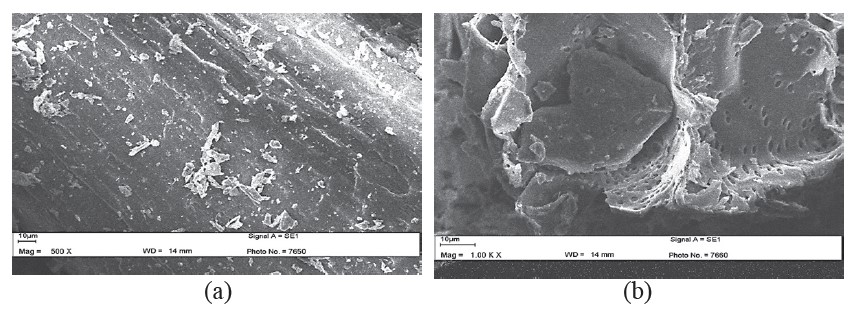
Figure 4. SEM images of napier grass before hydrolysis (a) and 100 mesh napier grass hydrolyzed with HCl for 90 min (b).
TGA result
The results of TGA analysis of untreated and treated napier grass (with HCl for 90 min) are shown in Figure 5. The light volatile compounds in the untreated napier grass completely degraded during hydrolysis. The carbon compounds that remained in the napier grass after hydrolysis took longer to degrade at 120 to 320°C.
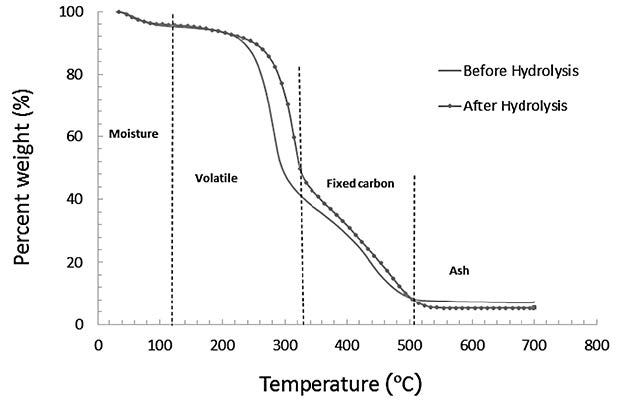
Figure 5. TGA analysis of the degradation of napier grass before and after hydrolysis with HCl for 90 min.
DISCUSSION
Hydrolysis with acids (hydrochloric or sulfuric acid) resulted in higher concentrations of reducing sugar compared with alkalis (potassium hydroxide or calcium hydroxide). The concentration of reducing sugar increased with time when sulfuric acid was used. This is consistent with Takata et al. (2013), who reported that the production of monosaccharide from hydrolysis of sugar bagasse is very effective at high temperature in the presence of sulfuric acid. The calcium hydroxide containing two OH- groups immediately reacted with napier grass, compared to the presence of one hydroxyl group in potassium hydroxide. Between acid and alkali hydrolysis, Sun and Cheng (2002) claimed that diluted acid hydrolysis achieved a higher reaction rate and was more favorable for cellulose hydrolysis. On the other hand, at low temperature (<160°C), direct saccharification of acid hydrolysis was more developed than the saponification of alkaline hydrolysis. Smaller particle sizes had more specific surface area, increasing the surface area for hydrolysis reaction.
We explored the effects of particle size and various acidic and alkaline solutions on the concentration of reducing sugar obtained from napier grass hydrolysis. Small particles, having more specific surface area, tend to increase the reaction with acid or alkali during hydrolysis. Strong acids affected the porous structure of napier grass as observed under SEM. TGA results confirmed the slower degradation of the heavy volatile substances in treated napier grass. Whether the obtained reducing sugars are mono or disaccharides should be explored in a future study using HPLC.
ACKNOWLEDGEMENTS
The authors would like to thank the Sriwiroj Company for providing the napier grass used in this project. We also would like to acknowledge Farm Engineering and Automation Technology Research Group, Khon Kaen University for general support.
REFERENCES
Aguilar R., J.A. Ramı́rez, G. Garrote, and M. Vázquez. 2002. Kinetic study of the acid hydrolysis of sugar cane bagasse. Journal of Food Engineering. 55(4): 309-18.
Angima S.D., D.E. Stott, M.K. O’Neill, C.K. Ong, and G.A. 2002. Weesies. Use of calliandra–Napier grass contour hedges to control erosion in central Kenya. Agriculture, Ecosystems & Environment. 91(1-3): 15-23.
Lewandowski I., J.M.O. Scurlock, E. Lindvall, and M. Christou. 2003. The development and current status of perennial rhizomatous grasses as energy crops in the US and Europe. Biomass and Bioenergy. 25(4): 335-61.
Takata E., K. Tsutsumi, Y. Tsutsumi, and K. Tabata. 2013. Production of monosaccharides from napier grass by hydrothermal process with phosphoric acid. Bioresource Technology. 143: 53-8.
Sun Y., and J. Cheng. 2002. Hydrolysis of lignocellulosic materials for ethanol production: a review. Bioresource Technology. 83(1): 1-11.
Duangkanok Tanangteerapong*, Thanawat Tunjaroensin, Parkpoom Trakun-ung and Khanita Kamwilaisak
Department of Chemical Engineering, Faculty of Engineering, Khon Kaen University, Khon Kaen 40002, Thailand
*Corresponding author. Email: duangkanok@kku.ac.th
Total Article Views

