 ISSN: 2822-0838 Online

Tree Species Composition and Height-diameter Allometry of Three Forest Types in Northern Thailand
Nuttaluck Khamyong, Prasit Wangpakapattanawong, Sutthathorn Chairuangsri, Angkhana Inta, and Pimonrat Tiansawat*Published Date : 2018-10-01
DOI : https://doi.org/10.12982/CMUJNS.2018.0021
Journal Issues : Number 4 , October-December 2018
ABSTRACT
Understanding the composition of tree species in tropical forests provides information for forest restoration and conservation. The objectives of this study were to determine the tree composition of three different types of forests in northern Thailand and to explore the relationship between tree height and diameter at breast height (DBH) and to determine what forest structure factors influence that relationship. The three forests - mixed deciduous forest (MDF), dry evergreen forest (DEF), and dry dipterocarp forest (DDF) are located at Doi Suthep-Pui National Park, Chiang Mai Province, Thailand. Across the three forest types there were 201 tree species in 68 families. The three forests differed in their species composition, but still had some overlapping species; the similarity of species between each pair ranged from 33-38%. The dry dipterocarp forest was the densest forest at 3,624 trees/ha, followed by the dry evergreen forest (2,451 trees/ha) and the mixed deciduous forest (1,102 trees/ha). For each forest type, the relationship between tree height and DBH was determined by a monomolecular function. The models indicated that the maximum tree height was highest in the dry evergreen forest (40.59 m), followed by the dry dipterocarp forest (23.94 m) and mixed deciduous forest (21.62 m). In addition, mixed-effects models were used to test for allometric differences due to stem density, stand basal area, and tree species. We found that the stem density and species were significant drivers of tree allometry. Light competition and species traits were more likely to influence resource allocation determining tree architecture. This research contributed to tree height estimation using allometric equations in Northern Thailand.
Keywords: Doi Suthep-Pui National Park, Tree diversity, Dry dipterocarp forest, Mixed deciduous forest, Dry evergreen forest
INTRODUCTION
Tropical forests are among the world’s richest ecosystems and play a key role in climate regulation. In Thailand, forests can be broadly divided into two categories –deciduous and evergreen forests. A salient determining factor of these two forest types is soil moisture (Maxwell and Elliott, 2001). In northern Thailand, forests are classified into five types, all of which are found in Doi Suthep-Pui National Park: two types of deciduous forest (dry dipterocarp forest and mixed deciduous forest) and three types of evergreen forest (dry evergreen forest, pine forest, and hill evergreen or montane forest) (Santisuk, 1988). Trees are important components of the forests, and can be unique to different types of forests. Currently, tropical forests are threatened by opening up for crops, fires, unsustainable logging practices, and global climate change (Wangpakapattanawong et al., 2016). Understanding tree diversity and composition will provide information to better plan and manage forest restoration and wildlife conservation.
The mixed deciduous forest (MDF) is widespread across the Indo-Burmese region. Its canopy is dominated by a diversity of deciduous species, particularly in the families Lamiaceae, Lythraceae, Fabaceae, and Combretaceae. Teak (Tectona grandis), a valuable timber species, occurs exclusively in the mixed deciduous forest. Other important canopy species include Lagerstroemia calyculata, L. balansae, Xylia xylocarpa, Pterocarpus macrocarpus, Bombax ceiba, Anogeissus acuminata, Dalbergia oliveri, Terminalia mucronata, T. tomentosa, and T. alata. This forest type is a tall-statured forest, typically up to 25 to 30 m tall, although in favorable conditions the canopy can be above 40 m.
The dry evergreen forest (DEF) occurs across the Indo-Burmese region, often in moist valleys and ravines among low- to medium-sized hills, and in low, wide river valleys and gallery forests. This forest type often occurs in a mosaic across the low hills of continental Southeast Asia. This forest type is often characterized by the presence of very large, fastgrowing, light-demanding species, including Tetrameles nudiflora, Duabanga grandifolia, and Pterocymbium javanicum. Although the dominant dipterocarps in this forest are all evergreen, typically about 30 percent of the canopy is deciduous. The canopy is usually about 30-40 m tall.
The dry dipterocarp forest (DDF) extends across continental Asia from northeast India, through Thailand, to Lao PDR and Vietnam. This forest type has a relatively low, open canopy composed of species with typically thick, leathery leaves. This forest is composed of a very distinctive set of dominant species. In Doi Suthep-Pui National Park, one or more of the four deciduous dipterocarp species, Shorea siamensis, S. obtusa, Dipterocarpus obtusifolius, and D. tuberculatus, usually form the core of forest stands (Khamyong, 2009). Other important
species in the forest canopy include P. macrocarpus, X. xylocarpa, Gluta usitata, and several species of Terminalia. The canopy does not usually exceed 20 m in height, and in xeric conditions can be 5-10 m tall. However, in very favorable sites, the main canopy dipterocarps and some Terminalia species can reach 25-30 m in height.
The three different forest types occupy different, but somewhat overlapping parts of Doi Suthep-Pui National Park. The mixed deciduous forest occurs in semi-moist areas with frequent forest fires at the foot and lower shoulder of the mountains. The approximate elevation of the mixed deciduous forest is 330-800 m asl. and approximate rainfall is 1,000-1,500 mm/yr (Khamyong, 2009). The dry evergreen forest is on the shoulder of the mountains and extends down toward the base of the mountains; it is found in moist riparian areas in proximity to the deciduous forests. It also occurs in the saddle area between lower peaks and nearby mountain streams. Approximate elevation of the dry evergreen forest is from 330-1,000 m asl. and approximate rainfall is 1,500-2,000 mm/yr (Khamyong, 2009). The dry dipterocarp forest occurs in dry areas with frequent forest fires at the base of the mountains and in dry areas along mountain ridges. Approximate elevation of the dry dipterocarp forest is 330-1,200 m asl. and approximate rainfall is 800-1,500 mm/yr (Khamyong, 2009).
In ecological studies, evaluating tree biomass is important for estimating tree carbon storage. Tree biomass can be measured destructively by cutting the trees and weighing tree parts. Where trees cannot be cut, the alternative is to use allometric equations, describing the relationship of one part (biomass) to another part of the trees (the most common are tree height and/or diameter at breast height, (DBH)). In Thailand, there are a number of widely used allometric equations for each forest type, for example, equations of Tsutsumi et al. (1983) for tropical rain forests and dry evergreen forests, equations of Ogawa et al. (1965) for mixed deciduous forests (Terakunpisut et al., 2007; Pothong, 2012), equations of Basuki et al. (2009) for dry forests, equations of Ogino et al. (1967) for dry dipterocarp forests (Homchan et al., 2013).
In common allometric equations, height value is usually required. However, tree height measurements are time consuming and difficult if trees are leaning and/or the line of sight is blocked. One option is using allometric equations having the tree height as one of the parameters, which can be developed based on relationships between the DBH and the tree height. In Thailand and elsewhere, there are a number of height-DBH equations, for example, Tsutsumi et al. (1983) for dry evergreen forests, Ohkubo et al. (2006) for hill evergreen forests (tropical montane forest) (Fukushima et al., 2008; Pothong, 2012), Yamakura et al. (1986) for tropical rain forests in Indonesia, and Chave et al. (2015) for tropical zones of the world. However, the allometric equations vary with the type of forest ecosystem. Therefore, it is helpful to explore the height-DBH relationship for forests at specific locations of interest.
In this study, our objectives were to 1) determine tree diversity and composition of the three different forest types of Doi Suthep-Pui National Park and 2) explore the relationship between tree height and DBH. We proposed allometric equations to estimate tree height. In addition, we explored what factors of stem density, basal area, and tree species affect the height and diameter relationship.
MATERIALS AND METHODS
The study sites were located within Doi Suthep-Pui National Park, Chiang Mai Province, Thailand (48′ 34″ N, 98° 54′ 57″ E). Three sites were selected based on the forest type – mixed deciduous, dry evergreen, and dry dipterocarp. Tree diversity was determined during the dry season from January to April 2014. Six plots of 40 x 40 m2 were randomly set up along an elevation gradient (Table 2) within each forest type. Tree species richness, DBH, and height of all the trees, equal to or taller than 1.5 m, were recorded.
Data analysis
Tree species diversity and composition. To compare the composition of the different forest types, indices of similarity between each pair of forest types were calculated using the Sørensen index (1948). Quantitative data, including tree frequency, density, dominance, and importance value index (IVI), were used to evaluate dominant tree species. The Shannon-Wiener diversity index was calculated for each forest type (Krebs, 1985). We used Kruskal Wallis non-parametric analysis to determine if there were significant differences of tree height and diameter among the three forest types.
Tree allometry model development. Data analyses were performed using R programing language version 3.5.0 (R Core Team, 2018). The whole dataset (n = 6,890) was separated into a training dataset (70%; n = 4,823) and a testing dataset (30%; n = 2,067). The training dataset was used to find potential predictive allometric relationships, while the test dataset was used to validate the models. We began by testing four forms of equations to determine what allometric model fits well with the training dataset. The four forms were log-log, hyperbolic tangent, Weibull, and monomolecular equation. The models included two to three parameter estimates (Table 1). This first step was to select a model to further determine parameter estimates of different forest types. We used nls function to fit all four models. Model evaluations were based on graphical inspection and calculation of: (1) Akaike’s Information Criteria (AIC), (2) standard errors of regression (mean square errors: MSE), and (3) normalized square root of mean square error (normalized-RMSE). The normalization of the RMSE facilitates the comparison between models with different scales and between datasets. For the normalized-RMSE, the RMSE was divided by the mean of the observed tree height data. We validated the models using the testing dataset; the models were compared by normalized-RMSE and mean absolute percentage error (MAPE), which is a measure of how much the prediction deviates from the observed value.
We used the best fitted model to explore the different height to DBH relationships among forest types. We used nlsList function of nlme package (Pinheiro et al., 2013) to partition the training dataset and determine the parameter estimates of each forest type. MAPE calculated prediction accuracy for each forest type.
Table 1. Models used to explore the relationship between tree height and diameter at breast height (DBH).
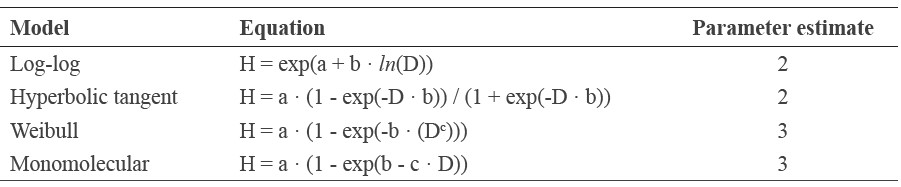
Note: H = tree height; D = DBH; a, b, and c = parameters; exp = exponential function
Predictors of tree allometry
We used mixed-effects models to examine variation between log-transformed height and diameter. The whole dataset (n = 6,890) was used in the mixed-effects models. Model fitting followed some questions in Feldpausch et al. (2011) and Hulshof et al. (2015). To compare models based on AIC scores, all models were fit using maximum likelihood (Zuur et al., 2009). To test whether forest structure measured by basal area (m2/ha) and stand density (trees/ha) and species were predictors of the allometric relationship, we added the basal area, density, and species factors in a stepwise fashion using linear mixed-effects models. For comparing models, factors were retained if (1) F-tests indicated the significance of fixed effect factors (anova function with one fitted model; P<0.05), and (2) a likelihood ratio statistic with the associated P-value indicated model improvement (anova function with multiple fitted model). For model ln(H)=1 without the random effect, the model was fitted using the lm function. For mixed-effects models, the models were fitted using the lme function of nlme package (Pinheiro et al., 2013).
RESULTS
Tree species diversity and composition
All forests combined contained 201 tree species in 68 families. The dry evergreen forest had the highest tree species richness, with 137 species and 51 families, followed by the mixed deciduous forest (71 species in 31 families) and the dry dipterocarp forest (85 species in 43 families). The dominant tree species in each of the forest types were different (Table 2). In each forest type, the dominant tree species (top five species with highest IVI value) were found in four to six plots accounting for 67-100% of sampling plots.
The tree density was the highest in the dry dipterocarp forest (3,624 trees/ha), followed by the dry evergreen forest (2,451) and mixed deciduous forest (1,102) (Table 2). The five species with the highest density in the dry dipterocarp forest were D. tuberculatus (485 trees/ha), Tristaniopsis burmanica (460), S. obtuse (321), S. siamensis (266), and D. obtusifolius (261). The top-five-highest-density tree species in the dry evergreen forest were Rothmannia sootepensis (254 trees/ha), Castanopsis acuminatissima (170), Elaeocarpus sphaericus (101), Lithocarpus fenestus (92), and Ixora cibdela (91). For the mixed deciduous forest, the top-fivehighest-density tree species were L. duperreana (191 trees/ha), T. mucronate (93), Antidesma acidum (85), T grandis (75), and P. macrocarpus (68).
The tree stem basal area was highest in the dry evergreen forest at 36.57 m2/ha, followed by the dry dipterocarp forest (21.13) and the mixed deciduous forest (19.33) (Table 2). In the dry evergreen forest, the five species with the highest stem basal area were D. turbinatus (16.19 m2/ha), chima wallichii (3.03), L. fenestus (1.91), Mesua ferrea (1.55), and X. xylocarpa (1.35). For the dry dipterocarp forest, the five highest stem basal area species were D. obtusifolius (4.60 m2/ha), D. tuberculatus (3.05), S. obtuse (2.94), S. siamensis (1.88), and Quercus brandisiana (1.54). In the mixed deciduous forest, the five species with the highest stem basal area were L. duperreana (2.95 m2/ha), P. macrocarpus (2.76), T. grandis (1.85), T. mucronate (1.46), and S. siamensis (1.09).
The important value index indicates the dominant species in the different forests (Table 2). The mixed deciduous forest was covered by the deciduous species of the Lythraceae, Lamiaceae, Combretaceae, and Fabaceae families; the dominant species were L. duperreana, P. macrocarpus, T. grandis, T. mucronata, and X. xylocarpa. The dry evergreen forest was covered by the deciduous and evergreen species of Dipterocarpaceae, Theaceae, Fagaceae, and Rubiaceae; the dominant species were D. turbinatus, R. sootepensis, L. fenestus, S. wallichii, and C. acuminatissima. The dry dipterocarp forest was covered mainly by the deciduous species of the Dipterocarpaceae family, i.e., D. obtusifolius, D. tuberculatus, S. obtusa, and S. siamensis, with other dominant species also found (Table 2).
The species similarity indices were low among the forest types: 38% between the dry evergreen and dry dipterocarp forests, 37% between the mixed deciduous and dry dipterocarp forests, and 33% between the dry evergreen and mixed deciduous forests. The dry evergreen forest had the highest species diversity, with a Shannon-Weiner Index value of 4.10, followed by the mixed deciduous forest (3.30) and dry dipterocarp forest (3.18).
The tree height and DBH differed among the dry evergreen, mixed deciduous, and dry dipterocarp forests at a 0.05 significance level (Kruskal-Wallis Chi-squared = 829.32 for tree height data and 1127.7 for DBH data, P<0.001). The tree heights varied across the forest types: dry dipterocarp (range 1.5-30 m, mean 4.67 m), dry evergreen (1.5-75 m, mean 4.91 m), and mixed deciduous (1.5-28 m, mean 10.65 m).
Table 2. Quantitative diversity and importance value index (IVI) for the top-10 tree species in the different forest types on Doi Suthep-Pui National Park.
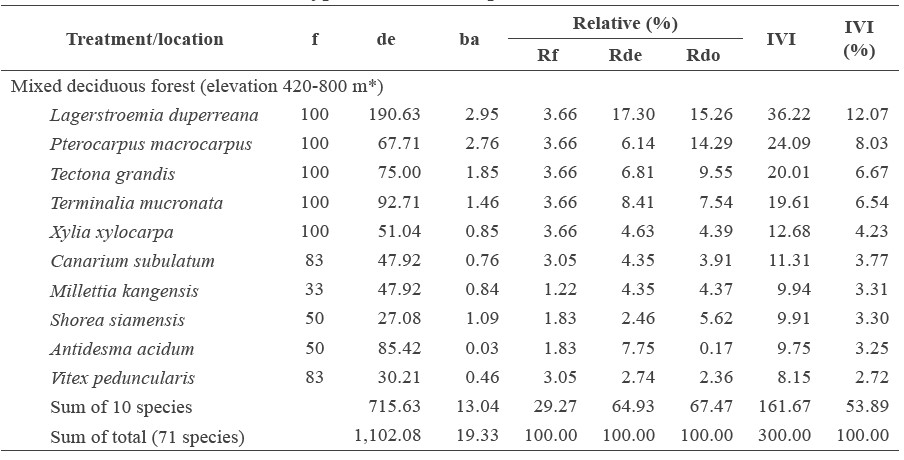
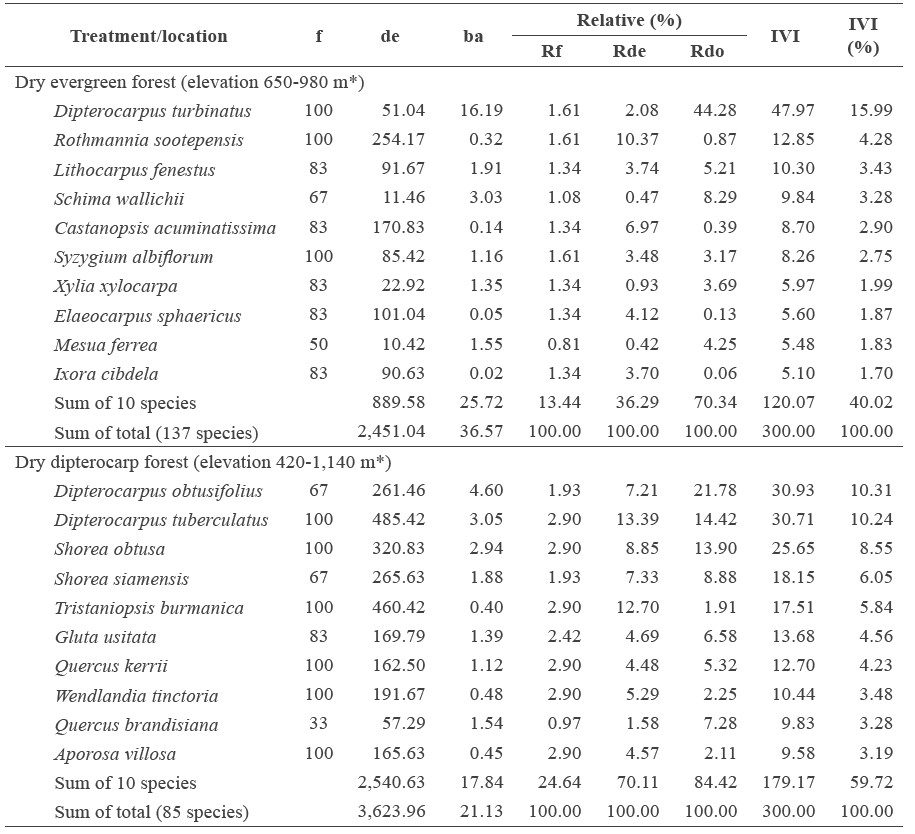
Note: f = Frequency (%), de = density (stems.ha-1), ba = basal area of stems (m2.ha-1), Rf = relative frequency (%), Rde = relative density (%), Rdo = relative dominance (%), and IVI = importance value index. *Elevation range of the studied plots.
Tree allometry model development
We found that the monomolecular function performed best (lowest MSE, normalized-RMSE and AIC score) followed by the Weibull, log-log, and hyperbolic tangent function (Table 3, Figure S2). The monomolecular function is an asymptotic model with three parameter estimates: maximum height (a) and scaling parameters (b and c). Although the MSE and normalized-RMSE in the model validation of the monomolecular model was not the lowest, the height prediction was more accurate (26% error) than the other models (Table 3).
Table 3. Comparisons of models used to explore the relationship between tree height and diameter at breast height (DBH).
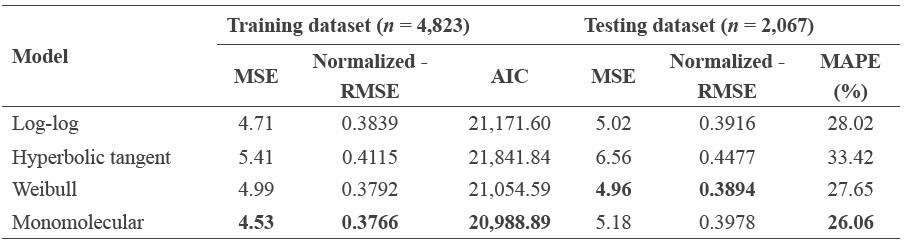
Note: The smallest value of evaluation criterion in each column is in bold. The parameter estimates of each model are in Table S1.
The monomolecular equation was fit separately by forest type. The model indicates differences in the parameter estimates among forest types (Table 4). The allometric equation of tree height in the three forest types of Doi Suthep-Pui National Park were as follows (H is tree height, D is DBH, and exp represents an exponential function):
Dry dipterocarp; H = 23.9370 · (1 - exp(-0.0516 - 0.0318 · D))
Dry evergreen; H = 40.5867 · (1 - exp(-0.0426 - 0.0194 · D))
Mixed deciduous; H = 21.6263 · (1 - exp(0.0038 - 0.0712 · D))
Maximum height (parameter a) was highest for the dry evergreen forest (40.6 m), followed by the dry dipterocarp forest (23.9 m) and mixed deciduous forest (21.6 m) (Table 4, Figure 1). For trees with DBH smaller than 30 cm, height at any given DBH of trees was highest in the mixed deciduous forest compared to the other two forest types (Figure 1). The curve growth rate was different among the three forest types for trees with larger DBH (Figure 1).
Table 4. Comparisons of coefficient estimate of three parameters in the monomolecular function.
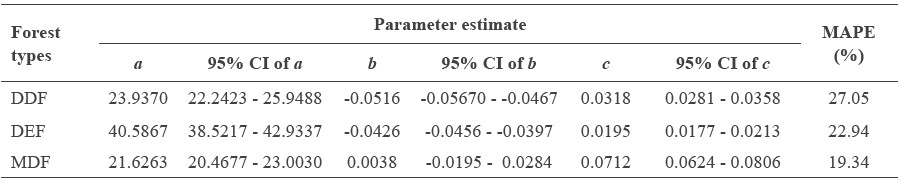
Note: For the training dataset, n = 4,823; for the testing dataset, n = 2,067. S.E = standard error of the coefficient estimate. 95% CI = 95% confidence interval of the coefficient estimate. MAPE = mean absolute percentage error.
Predictors of tree allometry
The mixed-effects model indicated that stem density of different forest types and tree species were important in explaining variation in tree height and diameter allometry (Table 5). In this study, the dry evergreen forest had medium stem density compared with the dry dipterocarp forest and mixed deciduous forest. The dry evergreen forest had the highest maximum height estimated from the monomolecular model (parameter a). The mixed deciduous forest and dry dipterocarp forest had the lowest and highest stem density, respectively, and they had smaller maximum height estimates (Table 4, Figure 1). Species of trees in the forest also contributed to the variation in tree allometry. The variable importance of forest types, species, and DBH in determining tree height was estimated to be 6%, 19%, and 75%, respectively (regression tree analysis; Appendix S1).
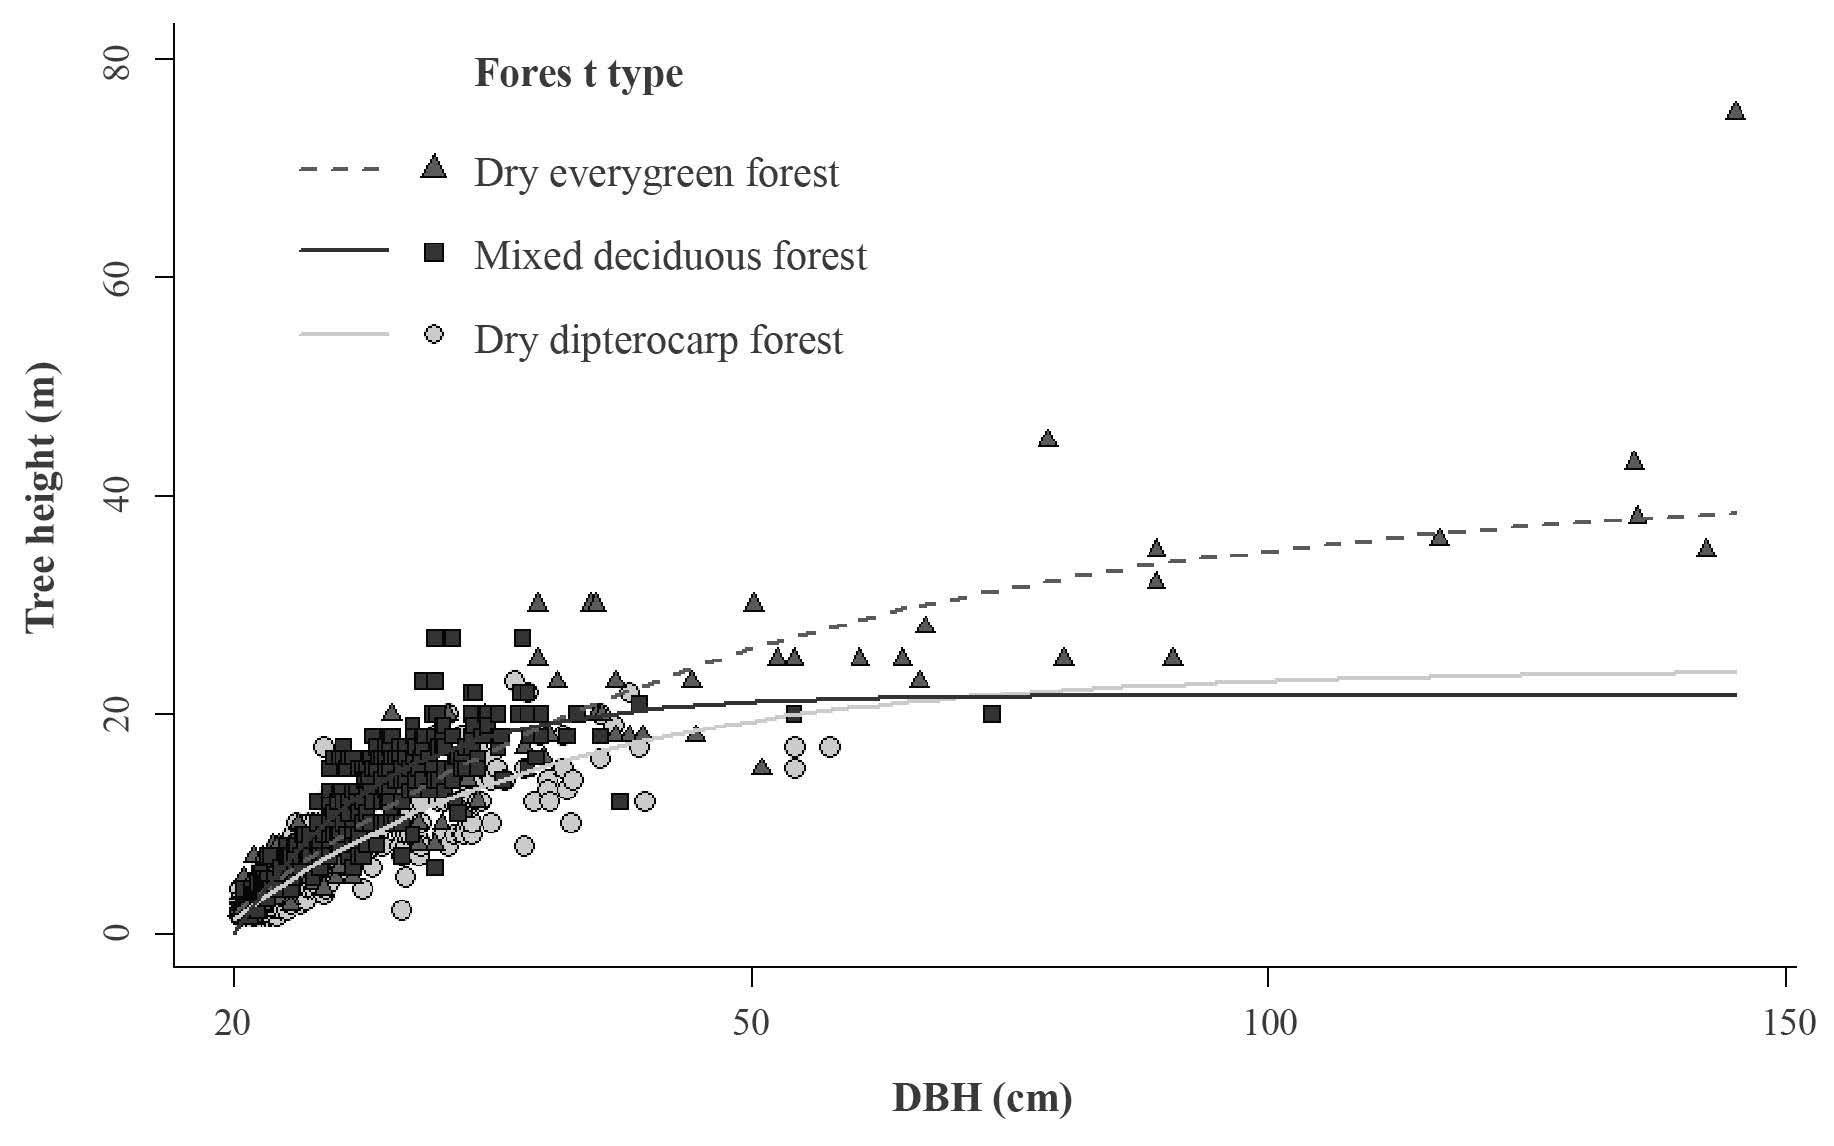
Figure 1. Plot of tree height against DBH of the testing dataset and the models of tree height to DBH relationship of three different forest types: mixed deciduous, dry evergreen, and dry dipterocarp. The monomolecular model was the best fit model. The parameter estimates of each forest type are in Table 4.
Table 5. Model selection of height and diameter allometry.
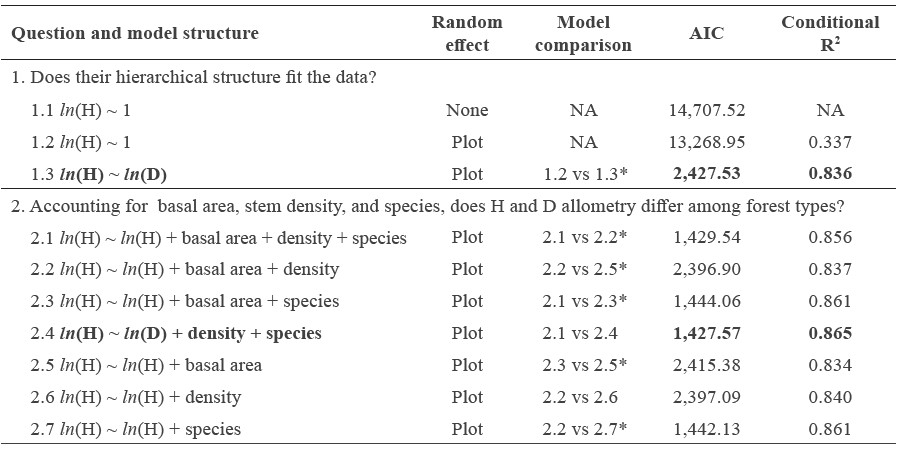
Note: The conditional R2 includes the variance of both the fixed and random factors. Symbols * in the model comparison column indicates significant difference between the two models. Best fitted model meeting selection criteria for each question are indicated in bold.
DISCUSSION
Tree species composition
The findings of species composition by forest type in Doi Suthep-Pui National Park were in agreement with previous studies. The mixed deciduous forest had similar dominant trees as some other locations in Thailand, for example, teak (T. grandis)-mixed stand (Seanchanthong, 2005; Podong et al., 2013). However, in some locations, T. grandis was absent (Marod et al., 1999; Phonchaluen, 2009; Chaiyo et al., 2011). The dry evergreen forest, the mixed stand of evergreen and deciduous species, was similar to that of some other locations in Thailand. The dominant trees were evergreen species of Dipterocarpaceae (D. turbinatus and D. alatus) (Khamyong, 2009; Senpaseuth et al., 2009). Some locations included other species, such as Hopea ferrea, S. henryana, Irvingia oliveri, L. duppereana, Diospyros dictyoneura, Xerospermum laevigatum, and Strombosia javanica (Lamotte et al., 1998; Glumphabutr et al., 2006). The dry dipterocarp forest had similar dominant trees with the mixed stand of deciduous dipterocarps, such as D. tuberculatus, D. obtusifolius, S. obtusa, and S. siamensis, with other deciduous species (Lamotte et al., 1998; Sahunalu 2009; Senpaseuth et al., 2009; Chaiyo et al., 2011; Homchan et al., 2013)
Our study classified the forest type based on dominant tree species. For example, D. turbinatus was one of the dominant species in the dry evergreen forest. Some other species in the dry evergreen forest might be the dominant species of an adjacent forest type. In addition, the forests of Doi Suthep-Pui National Park are still recovering from cutting and clearing in the past as a forest concession, and are not reaching their climax stages. As a result, the tree species were mixed in the various forest types. For example, we found C. accuminatissima and L. fenestus, which dominate the lower montane forest, in high numbers in the dry evergreen forest of our study, although most of the trees were small. Their seeds, dispersed from the adjacent lower montane forest, germinate and briefly grow, but with no evidence that they emerge as top canopy trees in the dry evergreen forest of our study. S. wallichii, often found in disturbed forests, was frequently found in forest gaps, as well as in the dry evergreen, mixed deciduous, and montane forests; it was rarely found in primary forests, even though it was
present in the lower montane forest.
Tree height and DBH relationship
In our study, an asymptotic function model (a monomolecular function) best fit the tree height to DBH relationship. The tree height increased with increasing DBH; with the increment of tree height increase per unit of DBH increase smaller when the trees were larger in diameter – i.e., taller trees were more likely to have a larger diameter. However, height limitation was an asymptote. As trees grew taller, their crowns expanded and the trees invested in incremental stem diameter to support these larger crowns. Other studies have also shown asymptotic relationships between tree height and DBH (e.g., Bullock, 2000; Poorter et al., 2006; Iida et al., 2011, Banin et al., 2012, Hulshof et al., 2015). Others have reported that a logarithmic allometry model performed better than asymptotic functions for wet and dry tropical forests (Feldpausch et al., 2011).
We found differences in the height to diameter relationship among the three forest types we studied in Doi Suthep-Pui National Park. From our fitted allometric model, for smaller trees (less than 30 cm in diameter) at a similar height, trees in the mixed deciduous forest were thinner than the trees in the dry evergreen and dry dipterocarp forests. Stem density also differed among the three forest types and affected the tree allometry. This finding was in contrast with Feldpausch et al. (2011), who found that stand basal area was more important than stem density in driving tree allometry. In our study, the densest forest (dry dipterocarp) and the most widely spaced forest (mixed deciduous) had smaller stand basal area than the dry evergreen forest (a medium dense forest). The stem density is related to species competition for light resources. With less competition for light in the widely spaced forest, thick trunks to support large crowns may not be necessary. However, the stem density was not the only factor driving tree allometry; the difference among tree species was also an important driver.
The variation in tree allometry may arise from differences in individual species. Our finding that species was more important than forest type in determining the tree height to DBH relationship agreed with Mugasha et al. (2013) in lowland Tanzanian forests. Different species have distinct tree architectures and have been shown to differ in their tree height to DBH relationship (King, 1996; Bullock, 2000; Poorter et al., 2006; Iida et al., 2011). Adult tree stature (i.e., maximum height) (King, 1996; Poorter et al., 2006; Iida et al., 2011), species regeneration niche (gap vs non-gap species) (King, 1996), and functional groups all play a role in determining the tree height to DBH relationship (Poorter et al., 2006, Hulshof et al. 2015). To reduce error in estimating tree height from DBH, species level characteristics should be taken into account. Then, the species-specific height-DBH relationship can be determined. In practice, species-specific models require species identification of individual trees in the field. Further studies are needed to find the species-specific relationship of tree height to DBH, based on tree stature, regeneration niche, and functional groups.
CONCLUSION
Tree diversity, species composition, and forest structure differed among the three forest types studied in Doi Suthep-Pui National Park, Chiang Mai, Thailand. The relationship between tree height and DBH was determined by a three-parameter monomolecular function. The allometric models showed an average error of 23.1% in predicting the tree height from the DBH. This study showed that the stem density of forests and species of trees influenced the tree height to diameter relationship. Understanding the species-specific allometry would provide more accurate tree height estimation.
ACKNOWLEDGEMENTS
This project was financially supported by a National Research Council of Thailand graduate scholarship (Ph.D. Program) and the Research Administration Center of Chiang Mai University. We thank the Department of National Parks, Wildlife and Plant Conservation for permission to carry out this research study in Doi Suthep-Pui National Park. We also thank two anoymous reviewers for helpful comments and suggestions.
REFERENCES
Banin, L., Feldpausch, T.R., Phillips, O.L., Baker, T.R., Lloyd, J., Affum-Baffoe, K., Arets, E.J.M.M., Berry, N.J., Bradford, M., Brienen, R.J.W., et al. 2012. What controls tropical forest architecture? Testing environmental, structural and floristic drivers. Global Ecology and Biogeography. 21(12): 1179-1190. https://doi.org/10.1111/j.1466-8238.2012.00778.x
Basuki, T.M., Laake, P.E.V., Skidmore, A.K., and Hussin Y.A. 2009. Allometric equations for estimating the above-ground biomass in tropical lowland dipterocarp forests. Forest Ecology and Management. 257: 1684-1694. https://doi.org/10.1016/j.foreco.2009.01.027
Bullock, S.H. 2000. Developmental patterns of tree dimensions in a neotropical deciduous forest. Biotropica. 32: 42-52. https://doi.org/10.1111/j.1744-7429.2000.tb00446.x
Chaiyo, U., Garivait, S., and Wanthongchai K. 2011. Carbon storage in above-ground biomass of tropical deciduous forest in Ratchaburi province, Thailand. International Journal of Environmental and Ecological Engineering. 5(10): 585-590. https://doi.org/10.1999/1307-6892/3204
Chave, J., Rejou-Mechain, M., Burquez, A., Chidumayo, E., Colgan, M.S., Delitti, W.B.C., Duque, A., Eid, T., Fearnside, P.M., Goodman, R.C., et al. 2015. Improved allometricmodels to estimate the aboveground biomass of tropical trees. Global Change Biology. 20(10): 3177-3190. https://doi.org/10.1111/gcb.12629
Feldpausch, T.R., Banin, L., Phillips, O.L., Baker, T.R., Lewis, S.L., Quesada, C.A., Affum-Baffoe, K., Arets, E.J.M.M., Berry, N.J., Bird, M., et al. 2011. Height-diameter allometry of tropical forest trees. Biogeosciences. 8: 1081-1106. https://doi.org/10.5194/bg-8-1081-2011
Fukushima, M., Kanzaki, M., Hara, M., Ohkubo, T., Preechapanya, P., and Choocharoen C. 2008. Secondary forest succession after the cessation of swidden cultivation in the montane forest area in Northern Thailand. Forest Ecology and Management. 255: 1994-2006. https://doi.org/10.1016/j.foreco.2007.12.022
Glumphabutr, P., Wachrinrat, C., and Kaitpraneet S. 2006. Structural characteristics of natural evergreen forests in eastern region of Thailand. Thai Journal of Forestry. 25: 92-111. Retrieved from http://anchan.lib.ku.ac.th/kukr/handle/003/22983
Homchan, C., Khamyong, S., and Anongrak, N. 2013. Plant diversity and biomass carbon storage in a dry dipterocarp forest with planted bamboos at Huai Hong Krai Royal Development Study Center, Chiang Mai province. Proceedings of International Graduate Research Conference 2013, Chiang Mai University, Thailand. p. 77-83.
Hulshof, C.M., Swenson, N.G., and Weiser, M.D. 2015. Tree height-diameter allometry across the United States. Ecology and Evolution. 5(6): 1193-1204. https://doi.org/10.1002/ece3.1328
Iida, Y., Kohyama, T.S., Kubo, T., Kassim, A.R., Poorter, L., Sterck, F., and Potts M.D. 2011. Tree architecture and life-history strategies across 200 co-occurring tropical tree species.Functional Ecology. 25: 1260-1268. https://doi.org/10.1111/j.1365-2435.2011.01884.x
Khamyong, N. 2009. Plant species diversity, soil characteristics and carbon accumulation in different forests, Doi Suthep-Pui National Park, Chiang Mai province. MS thesis, Department of Soil Science, Faculty of Agriculture, Chiang Mai University, Thailand.
King, D.A. 1996. Allometry and life history of tropical trees. Journal of Tropical Ecology. 12(1): 25-44. https://doi.org/10.1017/S0266467400009299
Krebs, C.J. 1985. Ecology: The experimental analysis of distribution and abundance. Third edition, Harper & Row publisher, New York.
Lamotte, S., Gajaseni, J., and Malaisse, F. 1998. Structure diversity in three forest types of north-eastern Thailand (Sakaerat Reserve, Pak Tong Chai). Biotechnology, Agronomy, Society and Environment. 2(3): 192-202.
Marod, D., Kutintara, U., Yarwudhi, C., Tanaka, H., and Nakashisuka, T. 1999. Structural dynamics of a natural mixed deciduous forest in western Thailand. Journal of Vegetation Science. 10: 777-786. https://doi.org/10.2307/3237302
Maxwell, J.F., and Elliott, S. 2001. Vegetation and vascular flora of Doi Suthep-Pui National Park, Northern Thailand. CMU herbarium, Department of Biology, Faculty of Science, Chiang Mai University, Thailand.
Mugasha, W., Bollandsas, A., and Eid, T. 2013. Relationships between diameter and height of trees for natural tropical forest in Tanzania. Southern Forests. 75: 221-237. https://doi.org/10.2989/20702620.2013.824672
Ogawa, H., Yoda, K., Ogino, K., and Kira, T. 1965. Comparative ecological study on three main types of forest vegetation in Thailand II, Plant biomass. Nature and Life in Southeast Asia. 4: 49-80.
Ogino, K., Ratanawongs, D., Tsutsumi, T., and Shidei, T. 1967. The Primary production of tropical forest in Thailand. The Southeast Asian Studies, Kyoto, Japan. 5(1): 122-154.
Ohkubo, T., Hara, H., and Nishio, T. 2006. Land-use change and forest dynamics with special reference to the plant utilization of Karen people, study on the ecological restoration of tropical montane forest based on the natural succession of plant communities and local ecological knowledge of hill tribe people. Progress report no. 1 to the National Research Council of Thailand. Bangkok, Thailand.
Pinheiro, J., Bates, D., DebRoy, S., and Sarkar, D. 2013. R Development Core Team. nlme: Linear and nonlinear mixed effect models. R package version 3.1-109.
Phonchaluen, S. 2009. Plant species diversity, soil characteristics and utilization of Ban Sai Thong community forest, Pa Sak sub-district, Mueang district, Lamphun province. MS thesis. Department of Soil Science, Faculty of Agriculture, Chiang Mai University, Thailand.
Podong, C., Poolsiri, R., Katzensteiner, K., Pengthamkeerati, P., and Thongdeenok P. 2013. Species diversity and litter dynamics in secondary mixed deciduous forest, Thung Salaeng Lung National Park, Northern, Thailand. Folia Forestalia Polonica, series A. 55(4): 196-204. https://doi.org/10.2478/ffp-2013-0022
Poorter, L., Bongers, L., and Bongers, F. 2006. Architecture of 54 moist- forest tree species: traits, trade-offs, and functional groups. Ecology. 87(5): 1289-1301. https://doi.org/10.1890/0012-9658(2006)87[1289:AOMTST]2.0.CO;2
Pothong, T. 2012. Plant diversity and carbon sequestration in agricultural and forest ecosystems of Doi Mae Salong, Chiang Rai province. MS thesis. Environmental Science, Faculty of Science, Chiang Mai University, Thailand.
R Core Team, 2018. R: A language and environment for statistical computing. R Foundation for Statistical Computing, Vienna, Austria. Retrieved from https://www.R-project.org/
Sahunalu, P. 2009. Stand structure and species composition in the long-term dynamic plots of Sakaerat deciduous dipterocarp forest, Northeastern Thailand. Journal of Forest Management. 3(6): 1-20. Retrieved from http://kasetsartjournal.ku.ac.th/kuj_files/2010/A1004281418396718.pdf
Santisuk, T. 1988. Geoecological Research 5: An account of the vegetation of northern Thailand. Stuttgart, Germany.
Seanchanthong, D. 2005. Plant species diversity and soil characteristics of forest communities in Pang Ma Pha district, Mea Hong Son province. MS thesis. Department of Soil Science, Faculty of Agriculture, Chiang Mai University, Thailand.
Senpaseuth, P., Navanugraha, C., and Pattanakiat, S. 2009. The estimation of carbon storage in dry evergreen and dry dipterocarp forests in Sang Khom District, Nong Khai Province, Thailand. Environment and Natural Resources. 7(2). Retrieved from https://www.tcithaijo.org/index.php/ennrj/article/view/82564/66789
Sørensen, T.J. 1948. A method of establishing groups of equal aptitude in plant sociology based on similarity of species content and its application to analyses of the vegetation on Danish commons. Biologiske skrifter. 5: 1-34.
Terakunpisut, J., Gajaseni, N., and Ruankawe, N. 2007. Carbon sequestration potential in aboveground biomass of Thong Pha Phum National Forest Thailand. Applied Ecologyand Environmental Research. 5(2): 93-102.
Tsutsumi, T., Yoda, M.K., Sahunalu, P., Dhammanoda, P., and Prachaiyo, B. 1983. Forest: felling, burning and regeneration. In: Kyuma K., and Pairintra C. (eds) Shifting Cultivation. Kyoto University, Japan. p. 13-62.
Wangpakapattanawong, P., Tiansawat, P., and Sharp, A. 2016. Forest restoration at the landscape level in Thailand. In: Appanah S. (ed). Forest landscape restoration for Asia-Pacific forests. The Food and Agriculture Organization of the United Nations and RECOFTC-The Center for People and Forest, Bangkok. p. 149-166. Retrieved from http://www.fao.org/3/a-i5412e.pdf
Yamakura, T., Hagihara, A., Sukardjo, S., and Ogawa, H. 1986. Aboveground biomass of tropical rain forest stands in Indonesian Borneo. Vegetatio. 68(2): 71-82. https://doi/org/10.1007/BF00045057
Zuur, A.F., Ieno, E.N., Walker, N.J., Saveliev, A.A., and Smith, G.M. 2009. Mixed effects models and extensions in ecology with R. Springer-Verlag, New York.
SUPPLEMENTARY MATERIALS
Appendix S1 Sources of variation in the tree height data
Data analysis
To understand the sources of variation in tree height, data were primarily analyzed using a regression tree (package rpart). The continuous response variable was tree height and the explanatory variables were diameter at breast height (DBH), forest type (DDF, DEF, and MDF) and species. The regression tree with the whole dataset was fitted using binary recursive partitioning. The regression tree partitioned the response variable, tree height, into homogenous groups, which are equivalent to minimizing in the sums of squares about the group means (De’ath and Fabricius, 2000). The number of splits giving the minimum crossvalidated deviance was obtained to avoid over-fitting. The final regression tree was graphically presented. Then, we used the regression models to examine between-variable relationships, identified from the regression tree.
Results
The regression tree analysis pointed to the most influence of DBH variable on tree height (variable importance of 75%). The variable importance of species and forest types was 19% and 6%, respectively. The R-squared of the model was 84%. The regression tree plot indicated that the forest type was not important in determining tree height in our study (Figure S1).
Appendix 2 Species groups from the regression tree analysis tree height values
Group 1
Anneslea fragrans, Aporosa octandra, Aporosa villosa, Artocarpus thailandicus, Bombax anceps, Bridelia retusa, Buchanania lanzan, Castanopsis armata, Craibiodendron stellatum, Croton roxburghii, Dalbergia cana, Dalbergia dongnaiensis, Diospyros rubra, Dipterocarpus alatus, Dipterocarpus obtusifolius, Dipterocarpus tuberculatus, Elaeocarpus sp., Engelhardia serrata, Eriolaena candollei, Garcinia cowa, Garcinia mckeaniana, Garcinia merguensis, Gardenia sootepensis, Gluta usitata, Grewia disperma, Ixora sp., Lepisanthes rubiginosa, Lithocarpus fenestus, Lithocarpus lindleyanus, Lithocarpus polystachyus, Lophopetalum duperreanum, Memecylon celastrinum, Mitragyna rotundifolia, Olea salicifolia, Parinari anamense, Quercus brandisiana, Quercus kerrii, Rothmannia sootepensis, Schleichera oleosa, Shorea obtusa, Shorea siamensis, Sterculia pexa, Stereospermum colais, Strychnos nux-vomica, Styrax benzoides, Tarennoidea wallichii, Terminalia alata, Terminalia glaucifolia, Tristaniopsis burmanica, Wendlandia tinctoria
Group 2
Adenanthera pavonina, Adinandra integerrima, Alangium salviifolium, Albizia odoratissima, Anogeissus acuminata, Artocarpus gomezianus, Beilschmiedia gammieana, Canarium subulatum, Castanopsis acuminatissima, Castanopsis calathiformis, Catunaregam spathulifolia, Chukrasia tabularis, Colona flagrocarpa, Colona winitii, Cratoxylum formosum, Dalbergia cultrata, Dalbergia oliveri, Dipterocarpus turbinatus, Erythrina subumbrans, Gmelina arborea, Ilex umbellulata, Irvingia malayana, Knema lenta, Lagerstroemia duperreana, Lagerstroemia loudonii, Lagerstroemia sp., Lagerstroemia undulata, Lannea coromandelica, Litsea sp.4, Mesua ferrea, Millettia kangensis, Morinda tomentosa, Ostodes paniculata, Premna tomentosa, Protium serratum, Pterocarpus macrocarpus, Quercus kingiana, Quercus semiserrata, Rapanea yunnanensis, Schima wallichii, Semecarpus anacardium, Semecarpus cochinchinensis, Shorea roxburghii, Spondias pinnata, Syzygium albiflorum, Syzygium cumini, Tectona grandis, Terminalia bellirica, Terminalia chebula, Terminalia mucronata, Toona ciliata, Turpinia pomifera, Vitex peduncularis, Vitex pinnata, Walsura robusta, Xanthophyllum virens, Xylia xylocarpa
Group 3
Aphanamixis polystachya, Aporosa octandra, Bombax anceps, Castanopsis calathiformis, Dalbergia oliveri, Dipterocarpus obtusifolius, Dipterocarpus tuberculatus, Engelhardia spicata, Gluta usitata, Gmelina arborea, Lagerstroemia duperreana, Lithocarpus fenestus, Mangifera pentandra, Mesua ferrea, Millettia kangensis, Nephelium hypoleucum, Olea salicifolia, Pinus merkusii, Pterocarpus macrocarpus, Quercus brandisiana, Quercus kerrii, Schima wallichii, Shorea roxburghii, Styrax benzoides, Syzygium cumini, Xylia xylocarpa
Group 4
Dipterocarpus turbinatus, Magnolia baillonii, Michelia champaca, Syzygium albiflorum, Turpinia pomifera, Xanthophyllum virens
Table S1. Tree allometry model development using the training data set (n = 4,823).
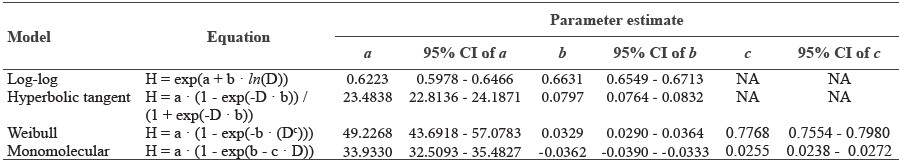
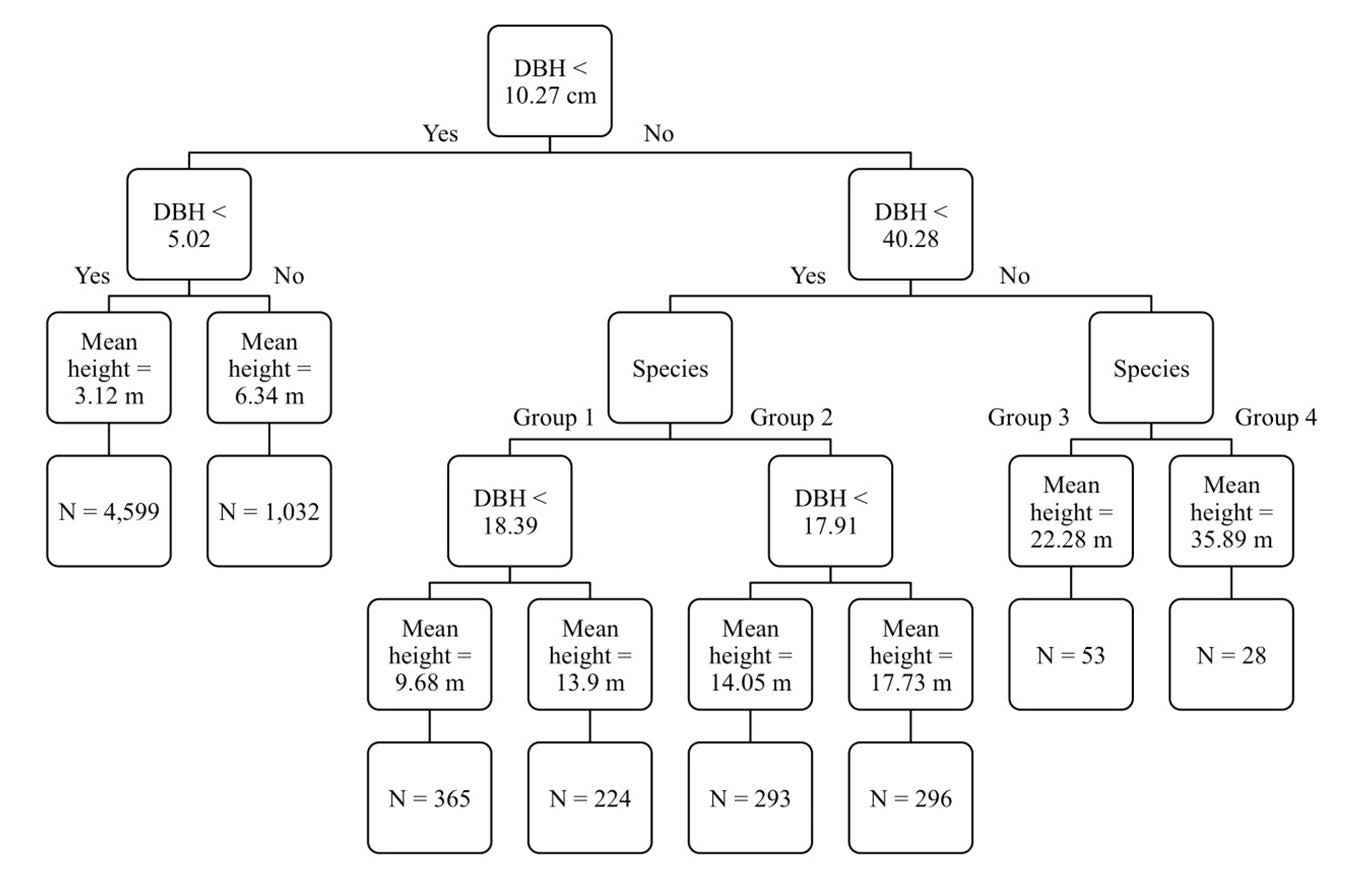
Figure S1. Regression tree of tree height values. The two importance variables were DBH and species. Each terminal node is labeled with mean height of each group and the number of data points in each group. The list of species in Group 1- 4 is in Appendix S2.
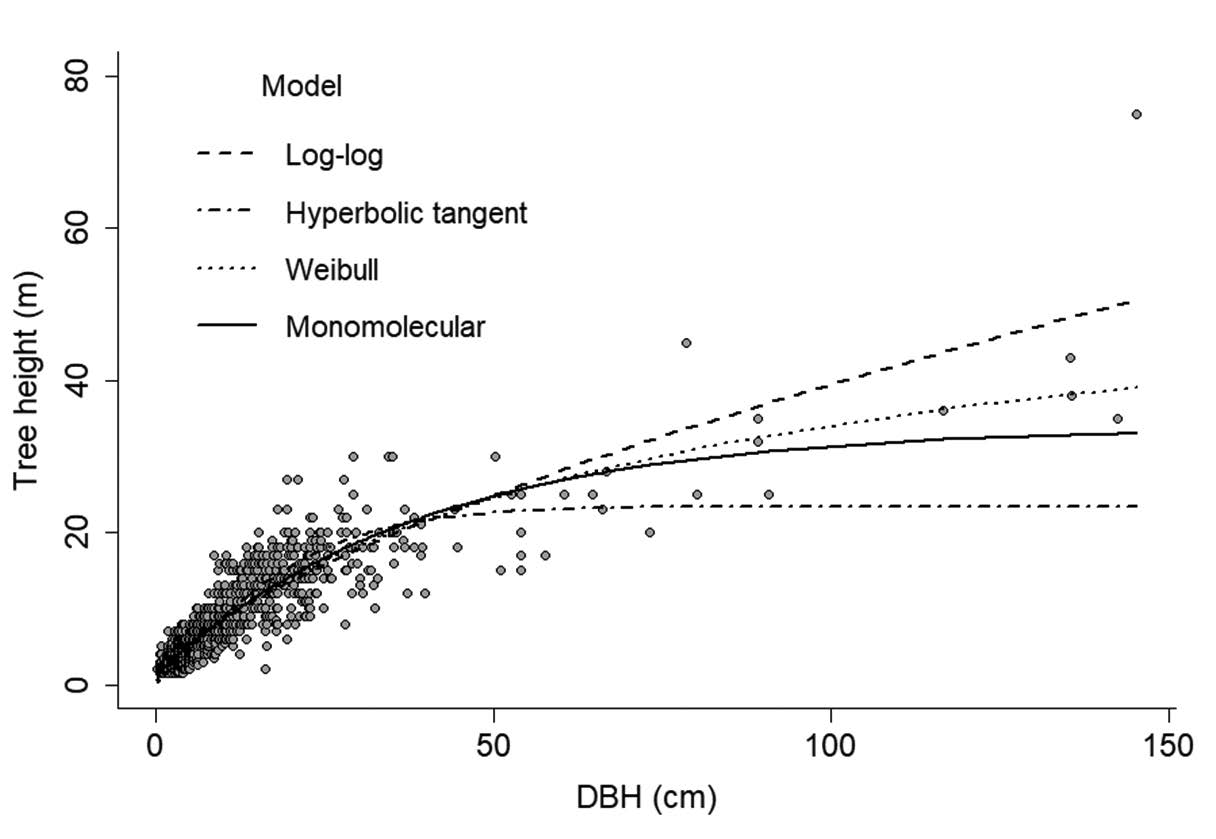
Figure S2. Plot of tree height against DBH of the testing dataset and the four models of tree height and DBH relationship. The monomolecular model was the best fit model. The parameter estimates of each model were in Table S1.
Nuttaluck Khamyong1, Prasit Wangpakapattanawong1,2, Sutthathorn Chairuangsri1,2, Angkhana Inta1, and Pimonrat Tiansawat1,2*
1 Department of Biology, Faculty of Science, Chiang Mai University, Chiang Mai 50200, Thailand
2 Forest Restoration Research Unit, Department of Biology, Faculty of Science, Chiang Mai University, Chiang Mai 50200, Thailand
*Corresponding author. E-mail: pimonrat.t@cmu.ac.th
Total Article Views
Article History:
Received: February 16, 2018
Revised: June 21, 2018
Accepted: July 13, 2018