 ISSN: 2822-0838 Online

Effect of a High-Fat Diet and Cholesterol Levels on Depression-like Behavior in Mice
Jutamas Ruanpang, Apisate Pleumsamran, Juntima Pleumsamran, and Salin Mingmalairak*Published Date : 2018-04-01
DOI : https://doi.org/10.12982/CMUJNS.2018.0012
Journal Issues : Number 2 , April-June 2018
ABSTRACT
High-fat diets are a well-known risk factor for many diseases, but the correlation between consuming a high-fat diet, serum lipid levels and the severity of depression or depression-like behavior remains unclear. Therefore, this study aimed to determine the effect of a high-fat diet on depression-like behavior and determine the correlation between cholesterol levels and the severity of depressive-like behavior. Thirty-nine, adult, male, C57BL/6Mlac mice were either fed a high-fat (61% of calories from fat) or normal (11% of calories from fat) diet for 10 weeks. At the end of the experiment, serum cholesterol levels and depression-like behavior, as determined by the forced swimming and tail suspension tests, were compared between the mice fed normal (control) and high-fat diets. The mice fed the high-fat diet showed significantly higher total cholesterol, high-density lipoprotein cholesterol (HDL-C), low-density lipoprotein cholesterol (LDL-C), and triglyceride levels, as well as significantly longer immobility times in the forced swimming test (but not the tail suspension test), compared to the control group; thus, we concluded that consuming a high-fat diet for 10 weeks increased serum cholesterol and triglyceride levels and produced depression-like behavior in mice. In the mice fed the high-fat diet, we found large positive correlations between both total cholesterol and HDL-C levels with immobility times during the forced swimming test, indicating a strong link between hyperlipidemia and depressionlike behaviors in mice.
Keywords: High-fat diet, Depression-like behavior, Serum lipid level
INTRODUCTION
High-fat diets, or energy-rich foods, contribute to obesity (Atshaves et al., 2010) and are a well-known risk factor for cardiovascular disease, diabetes mellitus, and cancer (La Vecchia, 1992; Marshall and Bessesen, 2002; Gamez-Mendez et al., 2015). Whether highfat diets are directly associated with depression and depressive behaviors, including possible mechanisms, remains unclear. Proposed mechanisms of depression include impairment of central monoaminergic function, dysfunctions of the hypothalamic-pituitary-adrenal (HPA) axis, and abnormality of neuronal and dendritic growth leading to neuronal structure and function change (Brigitta, 2002).
Human studies have shown a relationship between cholesterol and depression. A study by Nakao and Yano (2004) in male Japanese workers found that the prevalence of major depression was 6.1% in hypercholesterolemics (total serum cholesterol level ≥5.69 mmol/L) compared to only 1.8% in normocholesterolemics (cholesterol levels of 3.10-5.69 mmol/L). Ledochowski et al. (2003) showed an association between high cholesterol levels and signs of depression in outpatients. Results from these studies suggested that hypercholesterolemia may increase the risk of depression. However, high blood cholesterol level in individuals with depression could be from increased consumption of fats or carbohydrates.
Recent evidence from animal studies have also linked high-fat diets with depression-like behaviors (Sharma and Fulton, 2013; Hu et al., 2014). Sharma and Fulton (2013) demonstrated that mice fed with a high-fat diet for 12 weeks had increased corticosterone levels and exhibited anxiety- and depressive-like behaviors, as indicated by the elevated plus-maze and forced swimming tests; they also showed increased brain-derived neurotrophic factor protein levels in the nucleus accumbens that correlated with behavioral despair. Results from a study by Hu et al. (2014) demonstrated that rats fed with a high-fat diet for nine weeks had increased body weight, increased total cholesterol, decreased preference for sucrose indicating a loss of interest in pleasurable activities, and significantly deactivated right thalamus and stratum.
Thus, both human and rodent studies have suggested that high-fat diets correlated with hypercholesterolemia and a higher risk of depression. Therefore, it is likely that high-fat diets produce hypercholesterolemia that eventually causes changes in brain chemistry and structure that can lead to depression. However, it is also possible that high-fat diets directly affect the brain, without the involvement of hypercholesterolemia. If high-fat diets increase the risk of depression through changes in blood cholesterol levels, the severity of depressive mood should correlate with blood cholesterol levels. Thus, this study aimed to induce depression-like behaviors in mice using a high-fat diet and to determine whether serum lipid and cholesterol levels positively correlated with the severity of depression-like behaviors in mice.
MATERIALS AND METHODS
Animals
Thirty-nine healthy male C57BL/6Mlac mice (20-25 g, 8-weeks old) were obtained from the National Laboratory Animal Center, Mahidol University, Nakornpathom, Thailand. Mice were housed under standard conditions – ambient temperature 24±2°C, humidity 55±10%, 12-h light/dark cycle (lights on from 7:00 to 19:00) – and were allowed free access to both standard laboratory chow (No. CP082, Perfect Companion Group Co. Ltd., Thailand) and distilled water ad libitum. Mice had one week to acclimatize to these housing conditions before the experiments. Behavioral experiments were performed during the light phase from 9:00 to 18:00. The Ethics Committee of the Faculty of Medicine, Chiang Mai University approved the experimental protocol (approval number 28/2558).
Experimental protocols
Mice were divided into a control and experimental group. The control group (n=6) was fed a normal diet. The experimental group (n=33) was fed a high-fat diet. Mice in each group received their assigned diet regimen for 10 weeks. Initially, the mice in the high-fat diet group were stratified into different groups according to their total cholesterol. The sample size of six for the control group was determined by calculation using G power program (version 3.1.9.2) at the statistical power of 0.8 and type I (α) error of 0.05. However, because of high variance in the total cholesterol levels among the mice in the different subgroups, they were combined instead into a single, high-fat diet group to clearly demonstrate the relationship between total cholesterol level and depression-like behavior parameters. Body weight was recorded every week and food intake was measured every day during the feeding period. Caloric intake was calculated based on the kcal/g of each diet. Serum lipid levels and depression-like behaviors were evaluated at the end of the 10-week, high-fat diet, feeding regimen.
Composition of the normal and high-fat diets
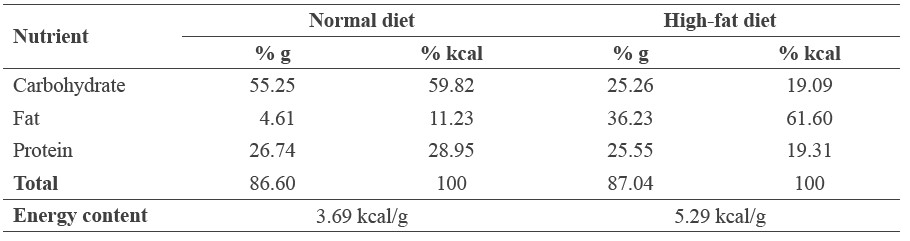
The high-fat diet was prepared by adding ingredients to normal commercial rat food. The final composition of the high-fat diet consisted of normal diet (33%), casein (23%), lard (33%), cholesterol (1%), butter (3%), vitamin mixture (1%), DL-methionine (0.5%), sucrose (5%), and choline chloride (0.5%). The energy content per gram of the normal and high-fat diets were 3.69 and 5.29 kcal, respectively (Table 1).
Table 1. Energy composition of the normal and high-fat diets.
Serum lipid measurement
After the mice fasted for 12-16 hours, blood samples were collected from their tail veins and placed into heparin-coated tubes. Blood samples were centrifuged at 6,000 rpm for 10 minutes at 4°C and serum was collected to determine serum total cholesterol, highdensity lipoprotein cholesterol (HDL-C), low-density lipoprotein cholesterol (LDL-C), and triglyceride levels.
HDL-C and LDL-C levels were determined by an HDL and LDL/VLDL Cholesterol Quantification Assay Kit (Abcam, Cambridge, MA). In the assay, cholesterol oxidase specifically recognized free cholesterol and produced products which reacted with a probe to generate color. The intensity of the color was measured by spectrophotometer at 570 nm.
Triglyceride levels were determined by colorimetric assay using a Triglyceride Quantification Assay Kit (Abcam, Cambridge, MA). In the assay, triglyceride was converted to free fatty acids and glycerol. The glycerol was then oxidized to generate a product that reacted with the probe to generate color. The intensity of the color was measured by spectrophotometer at 570 nm.
Forced swimming test
As a standard test of depression in rodents, the forced swimming test was performed as described by Porsolt et al. (1977). Mice were allowed to acclimatize to the room for two hours before the test. Mice were gently placed individually into transparent cylindrical polyethylene tanks (30 cm high, 20 cm internal diameter) containing water (25 to 28°C) up to a level of 20 cm and left there for 5 min. Each session was recorded by a video camera placed approximately 100 cm in front of the cylinder. The video was later analyzed by Smart Video Tracking software (PanLab, Harvard Apparatus, Barcelona, Spain).
Tail suspension test
As another standard test of depression in rodents, the tail suspension test was performed as described by Steru et al. (1985). To allow for acclimatization, mice were placed in the experimental room for two hours before the test. Each mouse was suspended from a horizontal bar located 50 cm above the floor by its tail with adhesive tape placed 1 cm from the tip of the tail. Movements of the mice were recorded by a video camera for 6 min and later analyzed by the Smart Video Tracking software (PanLab, Harvard Apparatus, Barcelona, Spain). The absence of all movements, except respiration, was recorded as immobility time. During the test, mice that climbed up their tails were gently repositioned to continue testing. Mice with repetitive tail-climbing were excluded from the study (Kukuia et al., 2014).
Statistics
Statistical analysis was performed with SigmaPlot version-12 computer software (Systat Software, San Jose, CA). The results were expressed as means ± standard error of mean (SEM). The data were analyzed using Student’s t-test. P<0.05 was considered statistically significant. Pearson's correlation was used to determine the relation between serum lipid levels and immobility time.
RESULTS
Effects of the high-fat diet on body weight, food intake, and caloric intake
The mean body weight of mice between the high-fat and normal diet groups did not differ significantly before starting the experiment (week 0). By week 6, continuing through to the end of the intervention (week 10), mice in the high-fat diet group had significantly higher mean body weight than the control group (Figure 1).
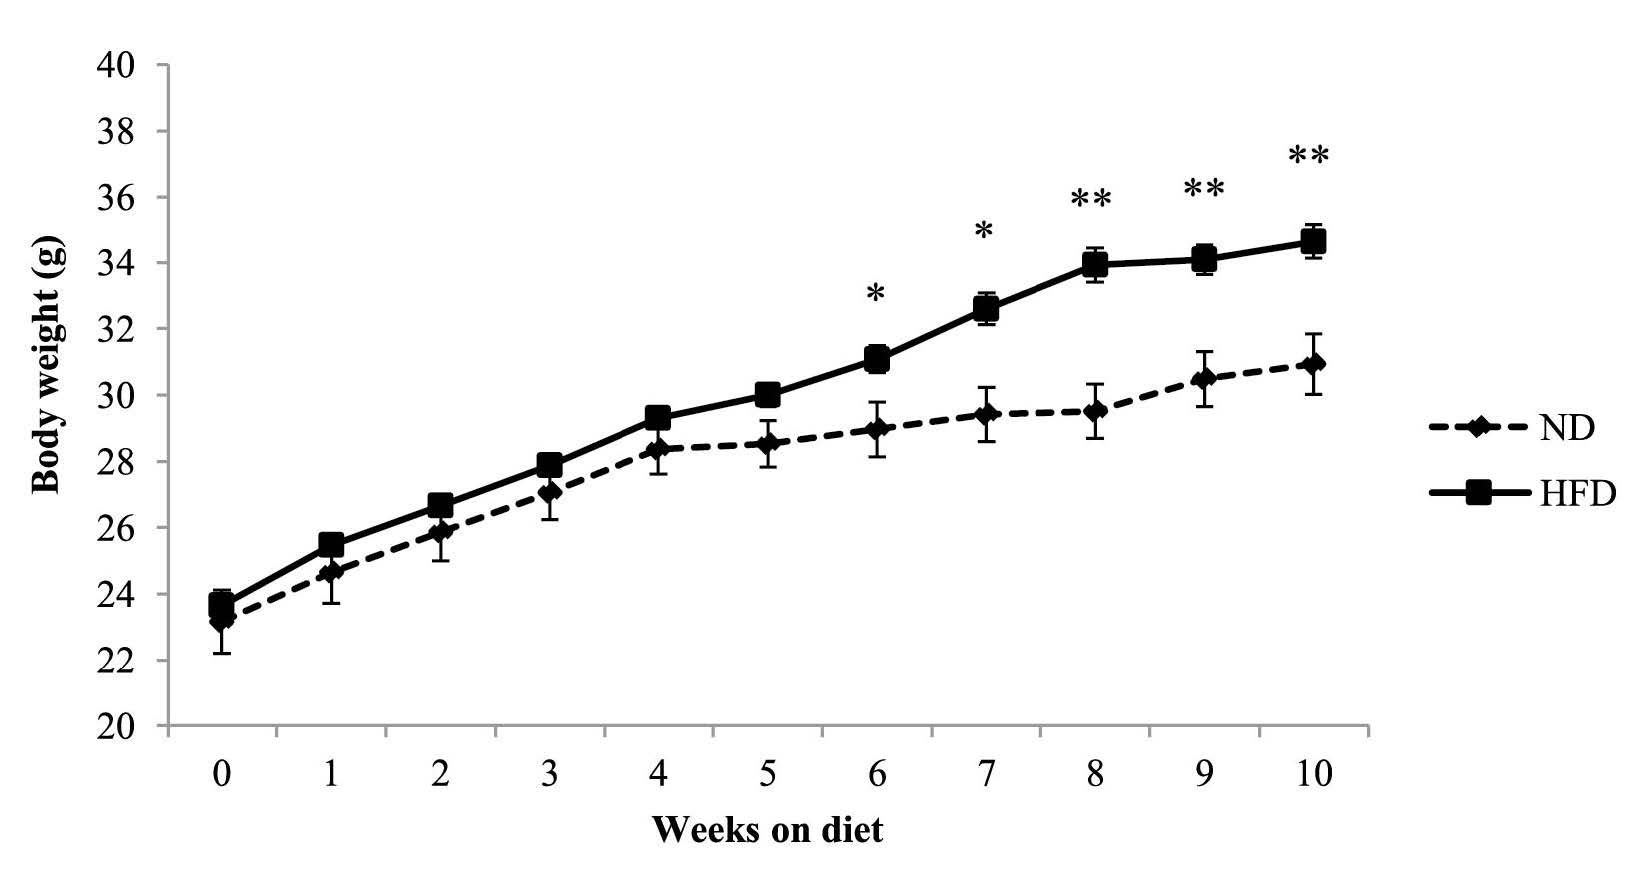
Figure 1. Body weight of C57BL/6Mlac mice fed either a normal (11% kcal fat) or high-fat (61% kcal fat) diet for 10 weeks.
Note: Body weight was recorded every week during the feeding period. Data are expressed as mean ± SEM (n=6 in normal diet group, n=33 in high-fat diet group). *P<0.05, **P<0.01 vs. normal diet group (Student’s t-test). Abbreviations: ND, normal diet; HFD, high-fat diet.
Food intake of mice in the high-fat diet group was significantly lower than the control group for all but weeks 1 and 8 (Figure 2). In contrast, caloric intake of mice in the high-fat diet group was significantly higher than the control group (Figure 3).
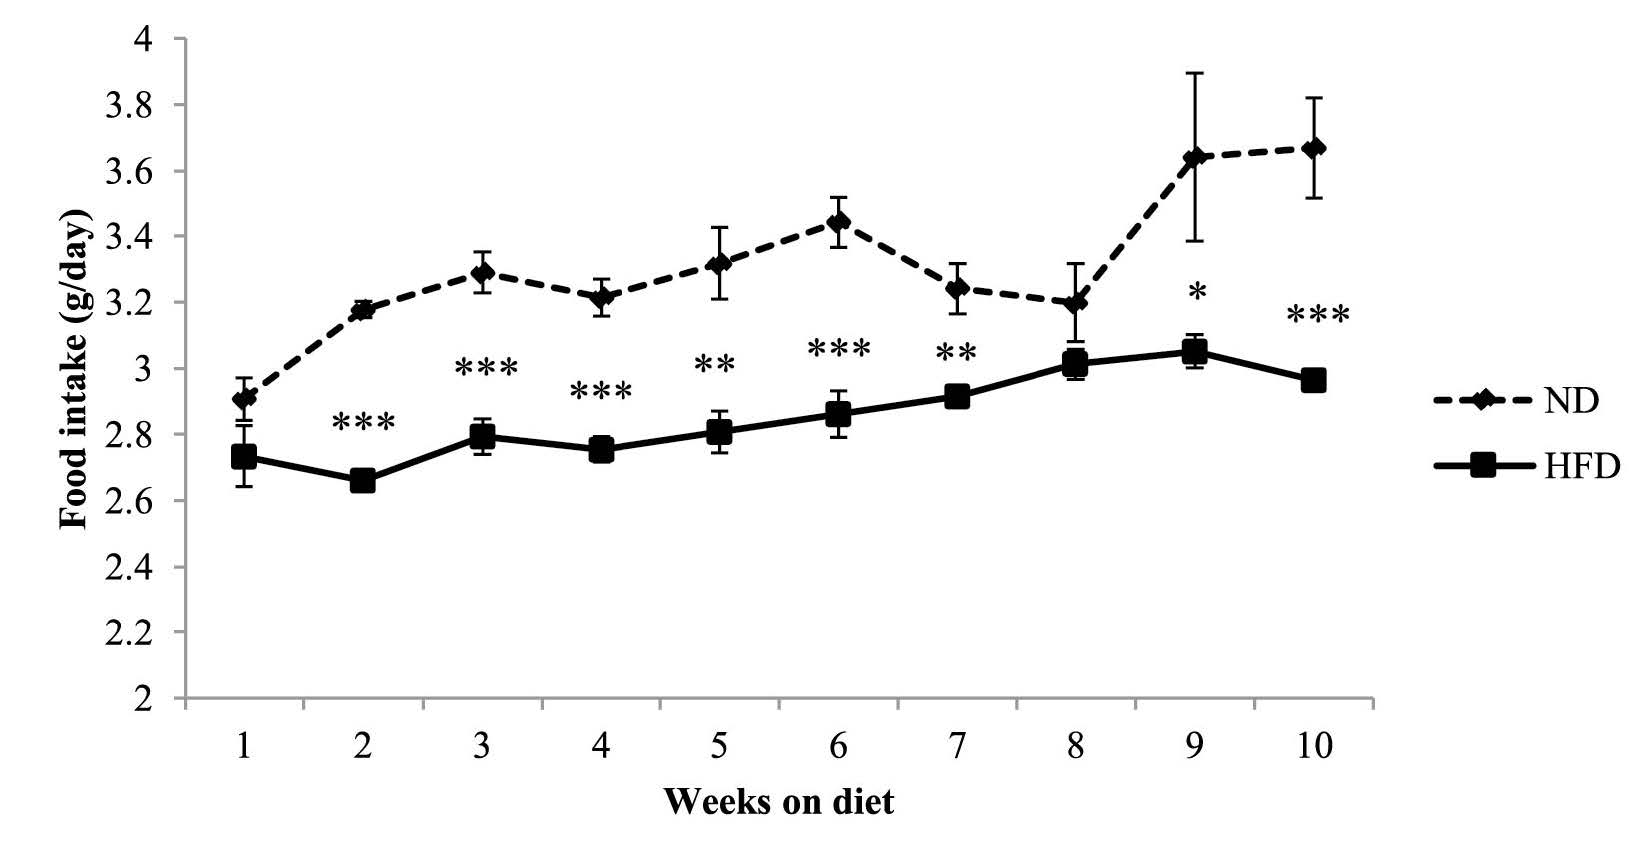
Figure 2. Food intake of C57BL/6Mlac mice fed either a normal (11% kcal fat) or high-fat (61% kcal fat) diet for 10 weeks.
Note: Food intake was measured daily during the feeding period. Data are expressed as mean ± SEM (n=6 in the normal diet group, n=33 in high-fat diet group). *P<0.05, **P<0.01, ***P<0.001 vs. the normal diet group (Student’s t-test). Abbreviations: ND, normal diet; HFD, high-fat diet.
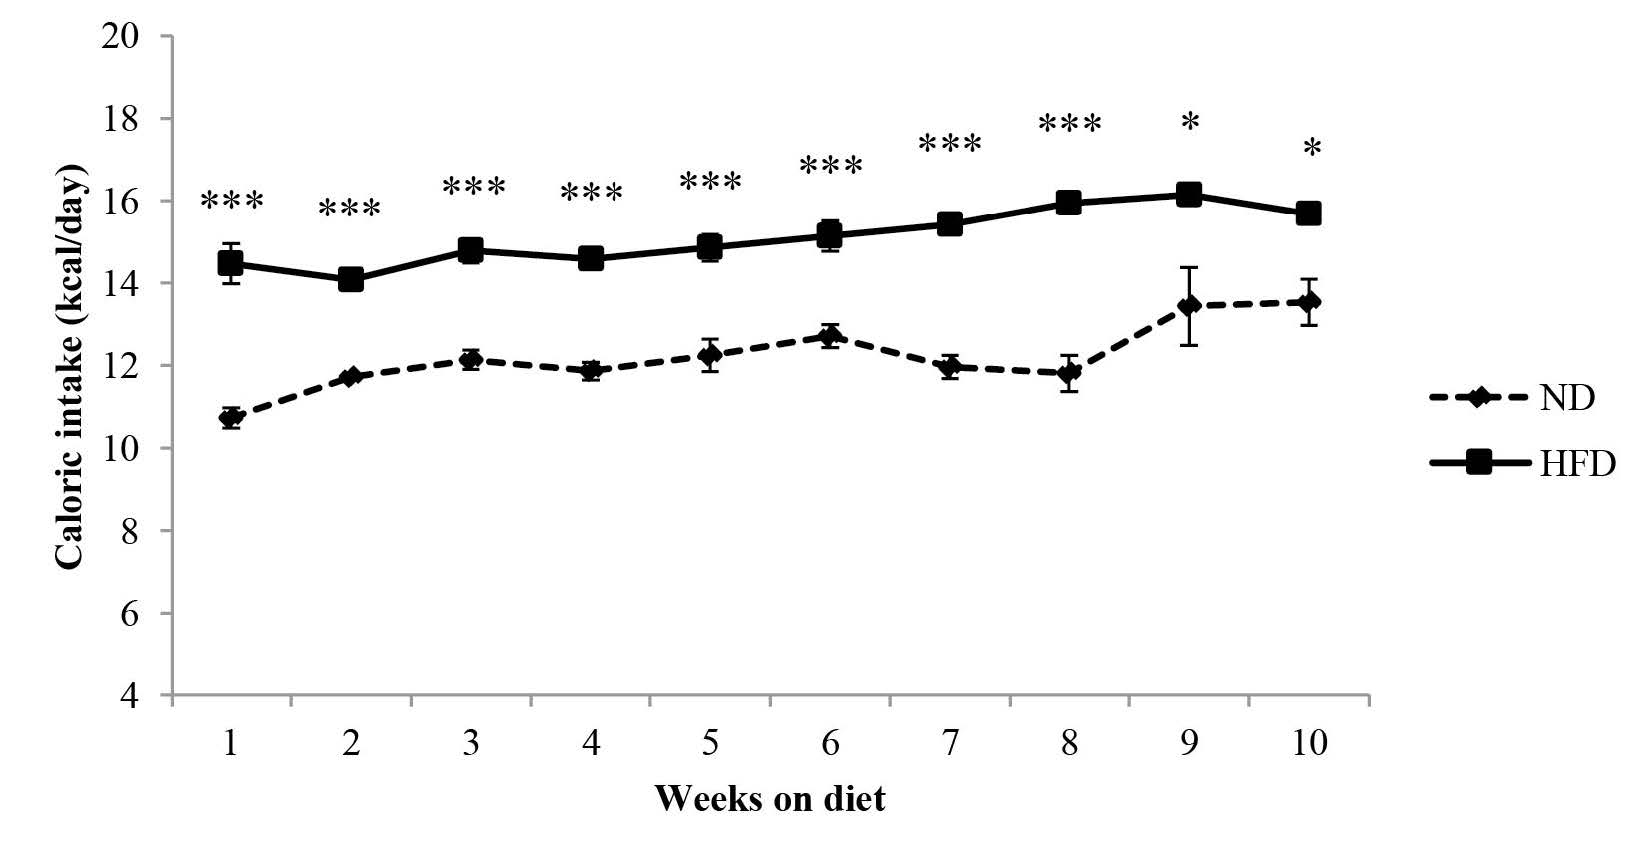
Figure 3. Caloric intake of C57BL/6Mlac mice fed either a normal (11% kcal fat) or high-fat (61% kcal fat) diet for 10 weeks.
Note: Caloric intake was calculated based on the kcal/g of each diet. Data are expressed as mean ± SEM (n=6 in the normal diet group, n=33 in high-fat diet group). *P<0.05, ***P<0.001 vs. the normal diet group (Student’s t-test). Abbreviations: ND, normal diet; HFD, high-fat diet.
Effect of the high-fat diet on serum lipid levels
At the end of the 10-week experiment, mice on the high-fat diet were significantly heavier than the control group (Figure 1). They also had significantly higher levels of serum total cholesterol, HDL-C, triglyceride, and LDL-C compared to the control group (Table 2).
Table 2. Serum lipid levels in C57BL/6Mlac mice fed a high-fat diet.
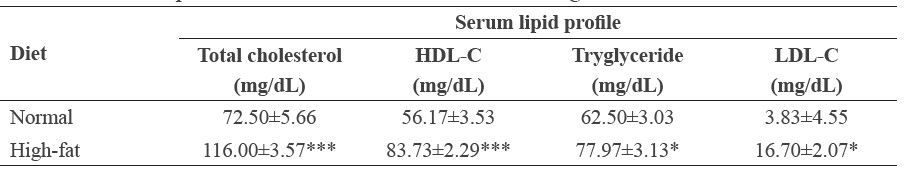
Note: C57BL/6Mlac mice were fed either a normal (11% kcal fat) or high-fat (61% kcal fat) diet for 10 weeks. At the end of feeding, blood was collected after overnight fast. Serum was isolated from blood. Serum total cholesterol, HDL-C, tryglyceride and LDL-C levels were determined using assay kits from Abcam. Data are expressed as mean ± SEM (n=6 in the normal diet group, n=33 in high-fat diet group). *P<0.05, ***P<0.001 vs. the normal diet group (Student’s t-test). Abbreviations: HDL-C, high-density lipoprotein cholesterol; LDL-C, low-density lipoprotein cholesterol.
Effect of the high-fat diet on depression-like behaviors
The tail suspension and forced swimming tests were used determine whether the highfat diet produced depression-like behavior in mice. At the end of week 10, mice fed the high fat diet had significantly longer immobility times, indicating depressive behavior, in the forced swimming test than the control mice fed a normal diet (Table 3). However, the immobility times in the tail suspension test did not differ significantly between the two groups.
Table 3. Depression-like behaviors in C57BL/6Mlac mice fed high-fat diet.
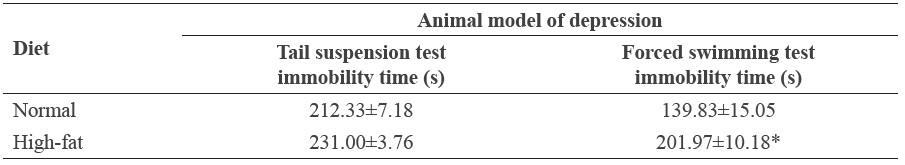
Note: C57BL/6Mlac mice were fed either a normal (11% kcal fat) or high-fat (61% kcal fat) diet for 10 weeks. At the end of feeding, mice were subjected to the tail suspension and forced swimming tests. Immobility times were measured using a Smart video tracking system. Data are expressed as mean ±SEM (n=6 in the normal diet group, n=33 in high-fat diet group). *P<0.05 vs. the normal diet group (Student’s t-test).
Relationship between immobility times and serum lipid levels
Based on the Pearson correlation statistic, both total cholesterol and HDL-C levels correlated positively with immobility times of the forced swimming test for mice fed the high-fat diet, but not for the control group (Figure 4). No significant correlations were found between any of the other lipid parameters and immobility times of the forced swimming test in either the high-fat or control groups. Therefore, it is likely that the high-fat diet increased total cholesterol and HDL-C levels that, in turn, increased immobility time in the forced swimming test (an indicator of depression in mice).
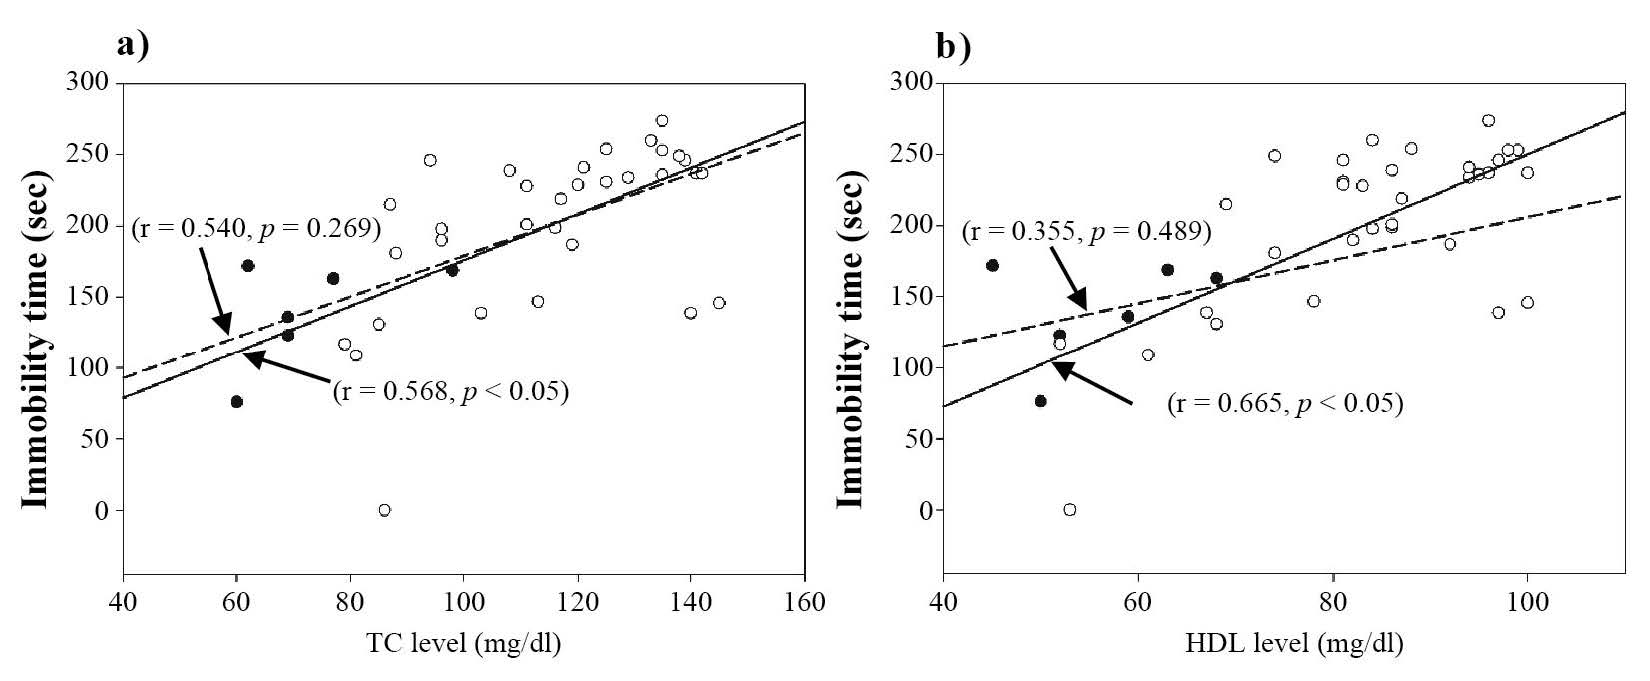
Figure 4. Positive correlations between a) total cholesterol level and immobility time of the forced swimming test and b) HDL level and immobility time of the forced swimming test.
Note: The open and closed circles represent data for individual mice in the high-fat and normal diet groups, respectively. The solid and dashed lines represent the linear relationship between the two sets of data in the high-fat and normal-diet groups, respectively.
DISCUSSION
This study demonstrated the relationship between cholesterol levels and depression-like behavior in mice fed with a high-fat diet. These mice had significantly higher body weight (Figure 1) compared to the control mice fed a normal diet as a result of consuming more calories (Figure 3), not more grams of food (Figure 2).
High-fat diets have been proposed to be involved in many health conditions, including hypercholesterolemia, atherosclerosis, diabetes mellitus, cardiovascular disease, and cancer (Kuller, 1997; Marshall and Bessesen, 2002). Our study supported the role of a high-fat diet in promoting hypercholesterolemia and depression-like behaviors using an inbred-mice model. Consuming a high-fat diet for 10 weeks increased serum triglyceride, total cholesterol, LDL-C, and HDL-C levels in male C57BL/6Mlac mice. These changes in the serum lipid profile were consistent with results from previous studies in mice (Williams et al., 2014) and humans (Guay et al., 2012). The mechanism by which high-fat diets increased serum lipids, including HDL-C, in mice is unclear. However, a study in humans proposed an imbalance between lipid absorption and synthesis as a cause of dyslipidemia (Ebbert and Jensen, 2013). The types and percentage of fat in a diet might also affect the serum lipid profile (Mohseni-Takalloo et al., 2014).
We used two standard tests – forced swimming (Porsolt et al., 1977) and tail suspension (Steru et al., 1985) – to detect depression-like behavior in rodents. Abelaira et al. (2013) supported the use of both tests as predictive models of depression-like activity. In our study, the increased immobility time was observed in the forced swimming test, but not in the tail suspension test. Hascoet et al. (1991) showed that the forced swimming test was more specific than the tail suspension test for predicting depression-like activity. Another study in mice found increased whole brain concentrations of dopamine, dihydroxyphenylacetate, and serotonin in the forced swimming test, but not in the tail suspension test (Renard et al., 2003).
In our study, the mice with high serum cholesterol levels from the high-fat diet exhibited depression-like behavior as indicated by increased immobility time in the forced swimming test, but not the tail suspension test. The severity of this depression-like behavior was highly correlated with serum total cholesterol and HDL-C levels. This is the first study to show this positive correlation between HDL-C levels and depression-like behavior in mice. While increased HDL-C levels in the mice fed the high-fat diet was likely an important contributing factor in the development of the depression-like behavior, its mechanism is unknown.
The mechanism of depression in relation to high serum cholesterol is unclear, although several mechanisms have been proposed. Cholesterol is an integral part of cellular membranes called lipid rafts (Simons and Ikonen, 1997). These lipid rafts have been suggested to serve as a platform for receptor sorting that affects downstream signaling (Becher et al., 2001). Neurotransmitter receptors found to operate in these lipid rafts includee GABA-B receptor (Becher et al., 2001), α7-subunit nicotinic receptor (Bruses et al., 2001), and ionotropic AMPA receptor (Suzuki et al., 2001). These receptors have been proposed to be associated with the etiology of depression. Excessive cholesterol could reduce membrane fluidity and disrupt the functioning of the lipid rafts, thereby altering the conformation and function of these membrane receptors (Ohvo-Rekila et al., 2002). Cholesterol could change the function of ion channels, enzymes, and receptors by directly binding to these structures (Haines, 2001; Ohvo-Rekila et al., 2002; Papakostas et al., 2004). Excess cholesterol in cell membranes could produce neurodegeneration by inhibiting neuronal growth (Zhang and Liu, 2015). Several studies have suggested that enhancement of γ-secretase enzyme activity in CNS neurons by membrane cholesterol inhibits neuronal and dendritic growth and promotes the formation of β-amyloid that possibly causes Alzheimer’s dementia (Wahrle et al., 2002; Papakostas et al., 2004).
The type of dietary fat could also influence the behavioral signs of anxiety and depression. Dietary fat derived from plants (soybean oil), animals (lard), and fish (fish oil) display different fatty acid composition profiles (Mizunoya et al., 2013). Fatty acids can be grouped into three main classes: saturated, monounsaturated, and polyunsaturated (Mizunoya et al., 2013). Mice fed with lard demonstrated higher anxiety, as determined by the elevated plus-maze test, than mice fed with soybean oil. Therefore, saturated fat type may be an important factor inducing behavioral change in animal models. Hu et al. (2014) demonstrated that rats fed with a high-fat diet (custard powder 10%, lard 20%, cholesterol 2.5%, sodium cholate 0.2%, thiamazole 0.1%, sucrose 2%, and regular diet 65.2%) for nine weeks showed decreased preference for sucrose (anhedonia). The high-fat diet in our study contained 33% lard that was high in saturated fat, supporting the role of saturated fat in inducing depression.
Impaired leptin activity in the hippocampus has also been proposed to be involved in depression associated with obese mice (Yamada et al., 2011). Leptin administration also inhibited diencephalic nitric oxide synthase, leading to increased serotonin metabolism in mice (Leibowitz and Alexander, 1998). Because serotonin has a role in depressive diseases, it is possible that leptin may play a role in mood regulation (Korner et al., 1999; Lagiou et al., 1999). In our study, the changes in immobility times in the forced swimming test, but not in the tail suspension test, like Renard et al. (2003), supported the involvement of dopamine and serotonin in the pathology of depression. Other studies have shown that a highfat diet decreased local levels of brain-derived neurotrophic factor and related neurogenesis or synaptodendritic connections (Lindqvist et al., 2006; Park et al., 2010; Arnold et al., 2014). Sharma and Fulton (2013) suggested that chronic consumption of a high-fat diet and obesity induced plasticity-related changes in the reward circuitry of the brain.
Insulin resistance in the brain has also been proposed to be involved in the development of depression. Zemdegs et al. (2015) demonstrated that mice fed with a high-fat diet showed increased body weight, hyperglycemia, and impaired glucose tolerance. In addition, mice have also shown anxiogenic-like/ depressive-like symptoms that were associated with reduced extracellular 5-HT levels in the hippocampus (Zemdegs et al., 2015). Mice consuming a highfat diet also showed impaired spatial working memory and brain insulin resistance (Arnold et al., 2014). Although mice with brain insulin resistance exhibited age-related depression-like behaviors (Kleinridders et al., 2015), no study has demonstrated a direct link between brain insulin resistance induced by consuming a high-fat diet and the development of depressionlike behaviors. Future studies are required to determine whether and how high-fat, dietinduced, brain insulin resistance can cause depression-like behaviors.
CONCLUSION
This study demonstrated that consuming a high-fat diet for 10 weeks increased serum triglyceride, total cholesterol, HDL-C, and LDL-C levels and induced depression-like behavior in male C57BL/6Mlac mice. A positive correlation between immobility times in the forced swimming test and both total cholesterol and HDL-C indicated a strong link between hyperlipidemia and depression-like behaviors in mice.
ACKNOWLEDGMENT
This study was supported by the Faculty of Medicine Endowment Fund for Research, Chiang Mai University, Chiang Mai, Thailand.
REFERENCES
Abelaira, H.M., Reus, G.Z., and Quevedo, J. 2013. Animal models as tools to study the pathophysiology of depression. Revista Brasileira De Psiquiatria. 35(Suppl 2): S112-120.
Arnold, S.E., Lucki, I., Brookshire, B.R., Carlson, G.C., Browne, C.A., Kazi, H., Bang, S., Choi, B.R., Chen, Y., McMullen, M.F., and Kim, S.F. 2014. High fat diet produces brain insulin resistance, synaptodendritic abnormalities and altered behavior in mice. Neurobiology of Disease. 67: 79-87. https://doi.org/10.1016/j.nbd.2014.03.011
Atshaves, B.P., McIntosh, A.L., Storey, S.M., Landrock, K.K., Kier, A.B., and Schroeder, F. 2010. High dietary fat exacerbates weight gain and obesity in female liver fatty acid binding protein gene-ablated mice. Lipids. 45(2): 97-110. https://doi.org/10.1007/s11745-009-3379-2
Becher, A., White, J.H., and McIlhinney, R.A. 2001. The gamma-aminobutyric acid receptor B, but not the metabotropic glutamate receptor type-1, associates with lipid rafts in the rat cerebellum. Journal of Neurochemistry. 79(4): 787-795. https://doi.org/10.1046/j.1471-4159.2001.00614.x
Brigitta, B. 2002. Pathophysiology of depression and mechanisms of treatment. Dialogues in Clinical Neuroscience. 4(1): 7-20.
Bruses, J.L., Chauvet, N., and Rutishauser, U. 2001. Membrane lipid rafts are necessary for the maintenance of the (alpha)7 nicotinic acetylcholine receptor in somatic spines of ciliary neurons. The Journal of Neuroscience. 21(2): 504-512.
Ebbert, J.O., and Jensen, M.D. 2013. Fat depots, free fatty acids, and dyslipidemia. Nutrients. 5(2): 498-508. https://doi.org/10.3390/nu5020498
Gamez-Mendez, A.M., Vargas-Robles, H., Ríos, A., and Escalante, B. 2015. Oxidative stressdependent coronary endothelial dysfunction in obese mice. Public Library of Science One. 10(9): e0138609. https://doi.org/ 10.1371/journal.pone.0138609
Guay, V., Lamarche, B., Charest, A., Tremblay, A.J., and Couture, P. 2012. Effect of short-term low- and high-fat diets on low-density lipoprotein particle size in normolipidemic subjects. Metabolism. 61(1): 76-83. https://doi.org/10.1016/j.metabol.2011.06.002
Haines, T.H. 2001. Do sterols reduce proton and sodium leaks through lipid bilayers? Progress in Lipid Research. 40(4): 299-324. https://doi.org/10.1016/S0163-7827(01)00009-1
Hascoet, M., Bourin, M., and Bradwejn, J. 1991. Behavioral models in mice. Implication of the alpha noradrenergic system. Progress in Neuro-psychopharmacology and Biological Psychiatry. 15(6): 825-840. https://doi.org/10.1016/0278-5846(91)90011-O
Hu, H., Xu, Y., Liu, C., Zhao, H., Zhang, H., and Wang, L. 2014. Changes in behavior and in brain glucose metabolism in rats after nine weeks on a high fat diet: a randomized controlled trial. Shanghai Archives of Psychiatry. 26(3): 129-137. https://doi.org/10.3969/j.issn.1002-0829.2014.03.004
Kleinridders, A., Cai, W., Cappellucci, L., Ghazarian, A., Collins, W.R., Vienberg, S.G., and Kahn, C.R. 2015. Insulin resistance in brain alters dopamine turnover and causes behavioral disorders. Proceedings of the National Academy of Sciences of the United State of America. 112(11): 3463-3468. https://doi.org/10.1073/pnas.1500877112
Korner, J., Chua Jr., S.C., Williams, J.A., Leibel, R.L., and Wardlaw, S.L. 1999. Regulation of hypothalamic proopiomelanocortin by leptin in lean and obese rats. Neuroendocrinology. 70(6): 377-383. https://doi.org/10.1159/000054499
Kukuia, K.K., Mante, P.K., Woode, E., Ameyaw, E.O., and Adongo, D.W. 2014. Antidepressant effects of Mallotus oppositifolius in acute murine models. ISRN Pharmacology. 2014: 324063. https://doi.org/10.1155/2014/324063
Kuller, L.H. 1997. Dietary fat and chronic diseases: epidemiologic overview. Journal of the American Dietetic Association. 97(7 Suppl): S9-15. https://doi.org/10.1016/S0002-8223(97)00724-4
La Vecchia, C. 1992. Cancers associated with high-fat diets. Journal of the National Cancer Institute Monographs. 12: 79-85.
Lagiou, P., Signorello, L.B., Mantzoros, C.S., Trichopoulos, D., Hsieh, C.C., and Trichopoulou, A. 1999. Hormonal, lifestyle, and dietary factors in relation to leptin among elderly men. Annals of Nutrition and Metabolism. 43(1): 23-29. https://doi.org/10.1159/000012763
Ledochowski, M., Murr, C., Sperner-Unterweger, B., Neurauter, G., and Fuchs, D. 2003. Association between increased serum cholesterol and signs of depressive mood. Clinical Chemistry and Laboratory Medicine. 41(6): 821-824. https://doi.org/10.1515/CCLM.2003.124
Leibowitz, S.F., and Alexander, J.T. 1998. Hypothalamic serotonin in control of eating behavior, meal size, and body weight. Biological Psychiatry. 44(9): 851-864. https://doi.org/10.1016/S0006-3223(98)00186-3
Lindqvist, A., Mohapel, P., Bouter, B., Frielingsdorf, H., Pizzo, D., Brundin, P., and Erlanson-Albertsson, C. 2006. High-fat diet impairs hippocampal neurogenesis in male rats. Europena Journal of Neurology. 13(12): 1385-1388. https://doi.org/10.1111/j.1468-1331.2006.01500.x
Marshall, J.A., and Bessesen, D.H. 2002. Dietary fat and the development of type 2 diabetes. Diabetes Care. 25(3): 620-622. https://doi.org/10.2337/diacare.25.3.620
Mizunoya, W., Ohnuki, K., Baba, K., Miyahara, H., Shimizu, N., Tabata, K., Kino, T., Sato, Y., Tatsumi, R., and Ikeuchi, Y. 2013. Effect of dietary fat type on anxiety-like and depression-like behavior in mice. SpringerPlus. 2(1): 165. https://doi.org/10.1186/2193-1801-2-165
Mohseni-Takalloo, S., Mirmiran, P., Hosseini-Esfahani, F., and Azizi, F. 2014. Dietary fat intake and its relationship with serum lipid profiles in tehranian adolescents. Journal of Food and Nutrition Research. 2(6): 330-334. https://doi.org/ 10.12691/jfnr-2-6-10
Nakao, M., and Yano, E. 2004. Relationship between major depression and high serum cholesterol in Japanese men. The Tohoku Journal of Experimental Medicine. 204(4): 273-287. https://doi.org/10.1620/tjem.204.273
Ohvo-Rekila, H., Ramstedt, B., Leppimaki, P., and Slotte, J.P. 2002. Cholesterol interactions with phospholipids in membranes. Progress in Lipid Research. 41(1): 66-97. https://doi.org/10.1016/S0163-7827(01)00020-0
Papakostas, G.I., Ongur, D., Iosifescu, D.V., Mischoulon, D., and Fava, M. 2004. Cholesterol in mood and anxiety disorders: review of the literature and new hypotheses. European Neuropsychopharmacology. 14(2): 135-142. https://doi.org/10.1016/S0924-977X(03)00099-3
Park, H.R., Park, M., Choi, J., Park, K.Y., Chung, H.Y., and Lee, J. 2010. A high-fat diet impairs neurogenesis: involvement of lipid peroxidation and brain-derived neurotrophic factor. Neuroscience Letters. 482(3): 235-239. https://doi.org/10.1016/j.neulet.2010.07.046
Porsolt, R.D., Le Pichon, M., and Jalfre, M. 1977. Depression: a new animal model sensitive to antidepressant treatments. Nature. 266(5604): 730-732. https://doi.org/10.1038/266730a0
Renard, C.E., Dailly, E., David, D.J., Hascoet, M., and Bourin, M. 2003. Monoamine metabolism changes following the mouse forced swimming test but not the tail suspension test. Fundamental and Clinical Pharmacology. 17(4): 449-455. https://doi.org/10.1046/j.1472-8206.2003.00160.x
Sharma, S., and Fulton, S. 2013. Diet-induced obesity promotes depressive-like behaviour that is associated with neural adaptations in brain reward circuitry. International Journal of Obesity. 37(3): 382-389. https://doi.org/ 10.1038/ijo.2012.48
Simons, K., and Ikonen, E. 1997. Functional rafts in cell membranes. Nature. 387(6633): 569-572. https://doi.org/10.1038/42408
Steru, L., Chermat, R., Thierry, B., and Simon, P. 1985. The tail suspension test: a new method for screening antidepressants in mice. Psychopharmacology. 85(3): 367-370.
Suzuki, T., Ito, J., Takagi, H., Saitoh, F., Nawa, H., and Shimizu, H. 2001. Biochemical evidence for localization of AMPA-type glutamate receptor subunits in the dendritic raft. Brain Research Molecular Brain Research. 89(1-2): 20-28. https://doi.org/10.1016/S0169-328X(01)00051-1
Wahrle, S., Das, P., Nyborg, A.C., McLendon, C., Shoji, M., Kawarabayashi, T., Younkin, L.H., Younkin, S.G., and Golde, T.E. 2002. Cholesterol-dependent gamma-secretase activity in buoyant cholesterol-rich membrane microdomains. Neurobiology of Disease. 9(1): 11-23. https://doi.org/10.1006/nbdi.2001.0470
Williams, L.M., Campbell, F.M., Drew, J.E., Koch, C., Hoggard, N., Rees, W.D., Kamolrat, T., Thi Ngo, H., Steffensen, I.L., Gray, S.R., et al. 2014. The development of dietinduced obesity and glucose intolerance in C57Bl/6 mice on a high-fat diet consists of distinct phases. Public Library of Science One. 9(8): e106159. https://doi.org/10.1371/journal.pone.0106159
Yamada, N., Katsuura, G., Ochi, Y., Ebihara, K., Kusakabe, T., Hosoda, K., and Nakao, K. 2011. Impaired CNS leptin action is implicated in depression associated with obesity. Endocrinology. 152(7): 2634-2643. https://doi.org/10.1210/en.2011-0004
Zemdegs, J., Quesseveur, G., Jarriault, D., Penicaud, L., Fioramonti, X., and Guiard, B.P. 2015. High fat diet-induced metabolic disorders impairs serotonergic function and anxiety-like behaviours in mice. British Journal of Pharmacology. 173(13): 2095-2110.https://doi.org/10.1111/bph.13343
Zhang, J., and Liu, Q. 2015. Cholesterol metabolism and homeostasis in the brain. Protein and Cell. 6(4): 254-264. https://doi.org/10.1007/s13238-014-0131-3
Jutamas Ruanpang1, Apisate Pleumsamran1,2, Juntima Pleumsamran1,2, and Salin Mingmalairak1*
1 Department of Physiology, Faculty of Medicine, Chiang Mai University, Chiang Mai 50200, Thailand
2 The Northern Neuroscience Center, Maharaj Nakorn Chiang Mai Hospital, Faculty of Medicine, Chiang Mai University, Chiang Mai 50200, Thailand
*Corresponding author. E-mail: mingmalairak_s@yahoo.com
Total Article Views