 ISSN: 2822-0838 Online

A Comparison of Extraction Methods on α-Mangostin Yield, Total Phenolic and Flavonoid Content and Antioxidant Activity in Garcinia mangostana Linn.
Chiramet Auranwiwat*, Nahathai Intama, Thunwadee Limtharakul, Monsicha Pinthong, Wiriyanporn Sumsakul, and Stephen G. PynePublished Date : November 13, 2025
DOI : https://doi.org/10.12982/NLSC.2026.019
Journal Issues : Number 1, January-March 2026
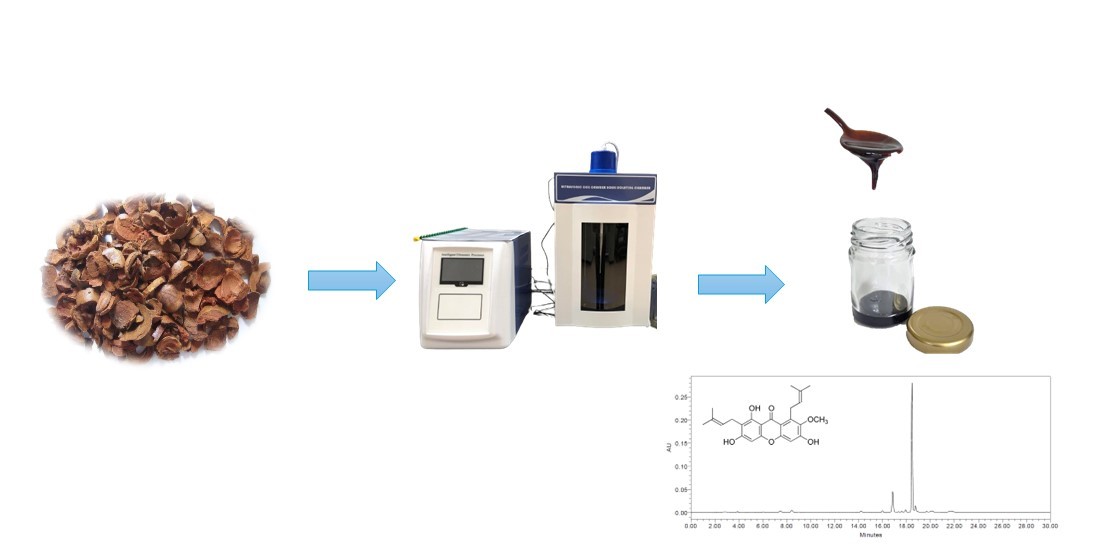
Abstract Mangosteen (Garcinia mangostana) is a source of phenolic compounds that exhibit interesting antioxidant activities. A comparison of three different extraction methods of mangosteen pericarps has been investigated using both conventional and modern methods including maceration, stirring, and ultrasonic assisted extraction (UAE). Of these methods stirring the plant material in EtOH for 24 h provided the highest extraction yield of 28.04 ± 5.83% on a dry weight basis while the other methods resulted in extraction yields of between 21.87 ± 3.09-25.62 ± 4.58 %. The determination of α-mangostin content was made by High Performance Liquid Chromatography (HPLC) analysis. The extraction methods using stirring or UAE gave a similar α-mangostin content of 26.25 ± 4.11 and 25.31 ± 0.49 %w/w, respectively. All extracts prepared under different extraction procedures were investigated for their total phenolic and flavonoid contents which were 34.87 ± 2.76-51.37± 9.21 mg GAE/g extract and 20.86 ± 3.65-23.42 ± 1.57 mg QE/g extract, respectively. The antioxidant activities of all extracts showed IC50 values of between 65.84 ± 0.87-88.15 ± 1.39 µg/mL.
Keywords: Garcinia mangostana, α-mangostin, Total phenolic, Total flavonoid
Graphical Abstract:
Citation: Auranwiwat, C., Intama, N., Limtharakul, T., Pinthong, M., Sumsakul, W., and Pyne, S.G. 2026. A comparison of extraction methods on α-mangostin yield, total phenolic and flavonoid content and antioxidant activity in Garcinia mangostana Linn. Natural and Life Sciences Communications. 25(1): e2026019.
INTRODUCTION
The green extraction technology is included in the 12 principles of green chemistry, these include, supercritical fluid extraction (SFE), microwave assisted extraction (MAE), and ultrasonic assisted extraction (UAE) (Xynos et al., 2012; Sridhar et al., 2021; Guana et al., 2023; Ray et al., 2023; Bavisetty et al., 2024; Thaisungnoen et al., 2024). In general, there are two types of methods for UAE, using either an ultrasound probe or an ultrasound bath. The probe type is a direct method for sonication using the ultrasonic probe to make direct contact with the sample, whereas the bath type is an indirect method using ultrasonic wave transfer to a sample in a liquid medium and container (Carreira-Casais et al., 2021; Islam et al., 2023; Kumar et al., 2023; Shen et al., 2023; Zhang et al., 2024).
Garcinia mangostana Linn. belongs to the Clusiaceae family which has the common name of mangosteen. The pericarps of mangosteen have been used in traditional medicine to relieve diarrhea and to treat foot cracks and wounds (Manasathien and Piyanut Khanema, 2015; Ovalle-Magallanes et al., 2017). The literature indicates that the major constituents in G. mangostana are xanthones, which are phenolic compounds, especially α-mangostin and α-mangostin (Jujun et al., 2008; Wang et al., 2018; Mohammad et al., 2019; Mohamed and Ibrahim, 2020; Tran et al., 2021; Tangyenyongwatana and Gritsanapan, 2022; Tang et al., 2023). G. mangostana extract exhibited various biological activities including antibacterial, anticancer, anti-inflammatory, and antioxidant activities. The major phytochemical component α-mangostin has been investigated in vitro and in vivo for its anticancer, anti-inflammatory, and antiviral activities (Watanapokasin et al., 2010; Auranwiwat et al., 2014; Abood et al., 2020; Suksamran et al., 2022; Alam et al., 2023).
This current study reported here, was designed to enhance the extraction yield of the total phenol and flavonoid content and α-mangostin from the mangosteen pericarps using conventional and modern extraction methods. The antioxidant activity of the extracts was also examined.
MATERIALS AND METHODS
Materials
The Ultra-High Performance Liquid Chromatography (UHPLC) was performed on an ACQUITY Arc LC System, WatersTM, MA, USA. The UV–vis absorption spectrum was measured with a microplate reader from Thermo Scientific, USA. A standard sample of α-mangostin was obtained from TCI (Tokyo, Japan), while ascorbic acid, gallic acid and quercetin were purchased from Sigma Aldrich (MO, USA). 2,2-Diphenyl-1-picrylhydrazyl (DPPH) was obtained from SRL (Maharashtra, India). Folin & Ciocalteu's phenol reagent was acquired from Loba (Mumbai, India). Aluminium chloride, potassium acetate and sodium carbonate were purchased from Kemaus (NSW, Australia). Acetonitrile and MeOH were HPLC grade from RCI Labscan (Bangkok, Thailand) EtOH was received from Liquor Distillery Organization (Chachoengsao, Thailand).
Plant material
The pericarps of G. mangostana were obtained from Khlung district, Chantaburi. The plant has been identified and deposited at the Bangkok herbarium, Bangkok, Thailand (voucher specimen number, BK no. 085237).
G. mangostana extraction
The pericarps of G. mangostana were washed with water and cut to small pieces then dried in an oven at 40-50 °C for 48 h. The dried materials were blended and kept in sealed bags before use. All extractions used 20 g of dried plant materials and 200 mL of EtOH as the solvent. Each extraction process was performed at room temperature and repeated three times. The resulting solution was filtrated through a Whatman® No.1 filter paper and concentrated under reduced pressure to obtain a brown viscous material. For the maceration extraction process the dried plant material (20 g) was macerated in EtOH (200 mL) for 24 h. For the stirring extraction method, the dried plant material (20 g) was stirred as a suspension in EtOH (200 mL) for 8 h or 24 h. For the ultrasonic assisted extraction (UAE), a suspension of the dried plant material (20 g) in EtOH (200 mL) was sonicated for 15 or 30 min in a beaker with power at 20 kW.
Determination of α-mangostin content in extracts
HPLC conditions
The method for determination of the α-mangostin content in the extracts was modified from Boonrat and Indranupakorn (2015). This method was performed on a Kromasil 100-5-C18 column (4.6 x 250 mm, 5 µm) and column temperature was kept at 30°C. The injection volume was 20 µL and a flow rate of 1.0 mL/min. The detection wavelength was 320 nm. The gradient of mobile phase consisted of 0.1% formic acid in deionized water (A) and acetonitrile (B) which increased peak shape and removed other matrixes from analytical column as showed in Table 1.
Table 1. The gradient system for determination α-mangostin.
|
Time (min) |
%A |
%B |
|
0 |
35 |
65 |
|
10 |
35 |
65 |
|
15 |
3 |
97 |
|
16 |
3 |
97 |
|
20 |
35 |
65 |
|
30 |
35 |
65 |
Method validation
The method for the determination α-mangostin has been validated followed the International Conference on Harmonization guidelines (ICH Q2R2, 2023) and acceptance criteria was applied from AOAC International (Appendix F: Guidelines for Standard Method Performance Requirements). The validation included the determination of specificity, linearity, range, limit of detection (LOD) and limit of quantitation (LOQ), precision and accuracy to ensure the content of active compound in samples.
Specificity
The specificity of the method was investigated by separately injecting of MeOH (blank), α-mangostin standard and crude extract. The chromatogram of each injection was compared retention time with standard and resolution of analyte peak.
Linearity and range
A standard curve for α-mangostin was created by plotting the HPLC peak area versus the concentration for each standard solution. A stock solution of α-mangostin was prepared at the concentration 400 µg/mL and was then diluted to give six samples of concentrations running from 3.125-100 µg/mL. The linear regression equation was explained by y = ax ± b, where x and y are the concentration and peak area, respectively. Linearity was established in terms of the correlation coefficient (r2). The study of each concentration was measured in triplicate.
Limit of detection (LOD) and limit of quantitation (LOQ)
The limits of detection (LOD) and quantification (LOQ) were determined from the calibration curve. The LOD was calculated as 3.3σ/S, and the LOQ as 10σ/S, where σ represents the standard deviation of the response and S is the slope of the calibration curve.
Precision
The precision study was determined for α-mangostin in the six samples each in triplicate which were run under the same conditions as standard α-mangostin. The precisions were expressed as the relative standard deviation (RSD, %).
Accuracy
The accuracy test was a performing recovery study. The standard α-mangostin at three levels, low (24 µg/mL), medium (30 µg/mL), and high levels (36 µg/mL), was added to the extract then the total α-mangostin content in each sample was determined. The samples were analyzed in triplicate and recovery was calculated.
Sample preparation
The determination the amount of α-mangostin in the G. mangostana extracts, 25 mg of each dried extract was dissolved in MeOH (10 mL) and the solution was sonicated for 5 min. The sample solution was transferred to a 25 mL volumetric flask and then diluted to 100 µg/mL, filtered through a syringe filter (0.22 µm) then injected into the HPLC. The concentrations of α-mangostin were calculated using a standard curve method.
Determination of total phenolic content
For the measurement of the total phenolic content in the G. mangostana extracts the Folin-Ciocalteu colorimetric method was applied (Yusnawan et al., 2018). Gallic acid (GA) was used as the standard compound to compare with the crude extracts. The gallic acid standard solutions were prepared at the concentrations of 3.125-100 µg/mL. The sample solution was prepared from the dried extract and dissolved with 80% EtOH to obtain concentration of 1,000 µg/mL. The extract sample or the solution of the standard compound (10 µL) was mixed with 10% Folin-Ciocalteu phenol reagent and kept for 6 min. Then 100 µL of 7% Na2CO3 solution was added followed by 80 µL of deionized water (DI). The mixture was incubated in the dark at room temperature for 90 min. The absorbance of the mixture was then measured at 765 nm. The total phenolic content was reported in terms of mg gallic acid equivalent (GAE)/g extract (mg GAE/g extract).
Determination of total flavonoid content
The aluminum chloride colorimetric method reported by Singsai et al. (2020) was used in this study. A stock solution of quercetin was prepared at 1,000 µg/mL and diluted to give samples of concentration ranging from 6.25-100 µg/mL while the crude extract solution was prepared at 1,000 µg/mL based on dried extract. A 50 µL of standard quercetin or the extract sample was added to a microcentrifuge tube. Then a solution of 75 µL EtOH, 5 µL of AlCl3, 5 µL of CH3COOK, and 140 µL of deionized water was mixed with the standard or the extract sample and then incubated for 30 min in the dark at room temperature. Then 200 µL of the above reaction mixture was transferred to 96-well plate and the absorbance was determined at 415 nm. The absorbance of the standard solution of quercetin was plotted to produce the standard curve. The flavonoid content was calculated from the standard curve of quercetin and reported in terms of mg quercetin equivalent (QE)/g extract (mg QE/g extract).
Determination of DPPH radical scavenging assay
The antioxidant activity was determined using the DPPH assay using a modification of the method from Singsai et al. (2020). The DPPH reagent was prepared to 200 µM in EtOH. The concentrations of standard L-ascorbic acid and those of the crude extracts were in the range of 6.25-250 µg/mL. L-ascrobic acid or extract (50 µL) was mixed with DPPH (100 µL) in a 96 well plate and incubated for 30 min in the dark at room temperature. The absorbance of the solution was measured at 515 nm using DPPH as a control. The ability to scavenge DPPH radical was calculated as follows: DPPH radical scavenging activity (%) = [(Abscontrol - Abssample)/ (Abscontrol)] x 100.
RESULTS
The extraction yield of G. mangostana
The pericarps of G. mangostana were extracted with EtOH by maceration, stirring, and ultrasonic assisted extraction (UAE). The extraction yields were calculated on a dry weight basis which ranged between 21.87 ± 3.09-28.04 ± 5.83%. The method of stirring for 24 h provided the highest yield of 28.04 ± 5.83%. The extraction yield obtained from stirring for 24 h was higher than that from maceration, which can be explained by the extraction mechanism. In maceration, the diffusion of compounds from plant cells to the solvent occurs slowly, whereas stirring provides continuous agitation that enhances solvent contact and mass transfer (Murugan and Parimelazhagan, 2014). Furthermore, UAE at 30 min gave a significant extraction yield of 25.62 ± 4.58% as illustrated in Table 2.
Table 2. The extraction yields of α-mangostin from different extraction methods.
|
No. |
Method |
Time |
Yield (%w/w) |
a-mangostin (%w/w) |
|
|
1 |
Maceration |
24 h |
21.87 ± 3.09 |
22.33 ± 5.26 |
|
|
2 |
Stirring |
8 h |
24.66 ± 4.74 |
16.16 ± 2.72 |
|
|
3 |
Stirring |
24 h |
28.04 ± 5.83 |
26.25 ± 4.11 |
|
|
4 |
UAE |
15 min |
22.67 ± 3.80 |
16.54 ± 0.81 |
|
|
5 |
UAE |
30 min |
25.62 ± 4.58 |
25.31 ± 0.49 |
|
|
Note: Results are shown as mean ± %RSD of three measurements |
|
||||
The determination α-mangostin content in the extracts
A HPLC method was developed for the quantification of α-mangostin in all five extracts. The HPLC chromatogram of blank (MeOH), standard α-mangostin and G. mangostana extract, using 0.1% formic acid in deionized water and acetonitrile as the eluent, are shown in Figure 1 (A-C). The chromatographic separations under this condition presented good resolution with resolution value of α-mangostin and the nearby peak as 2.56 while chromatogram of MeOH as blank did not exhibit any peak at retention of α-mangostin at 18.0 min. As expected, α-mangostin and γ-mangostin where the major and the second most prominent compounds, respectively (Watanapokasin et al., 2010).
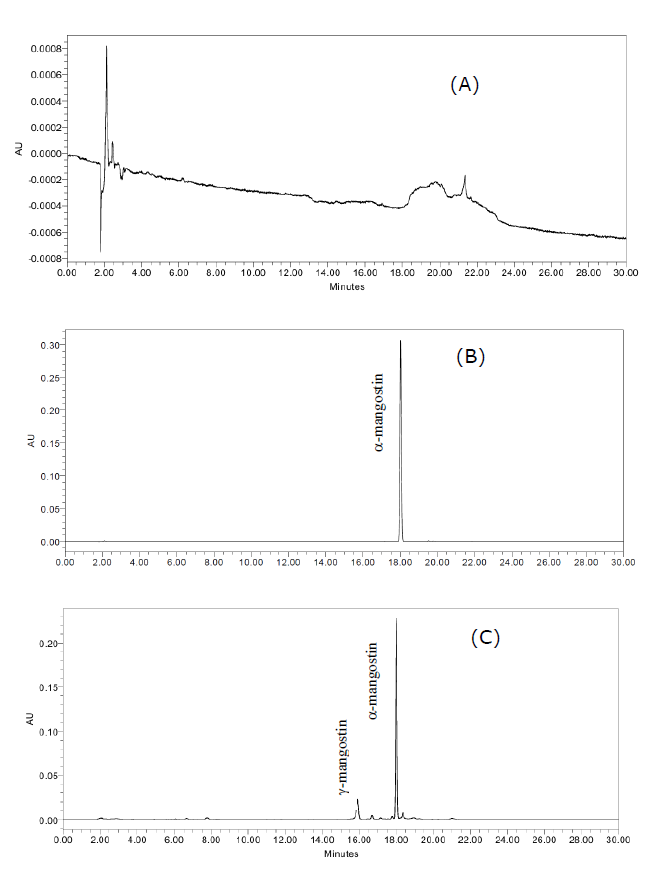
Figure 1. HPLC chromatogram of blank (MeOH) (A), a commercial sample of α-mangostin concentration at 25 µg/mL (B) and G. mangostana extract using UAE (C).
The validation of this method was investigated for the scope of linearity, range, LOD, LOQ, precision and accuracy. The specificity of this method was specific to determine α-mangostin. There were no other signals that eluted in the same retention time of α-mangostin at 18.0 min. The calibration curve for α-mangostin showed linearity in the concentration range of 3.125-100 µg/mL. The linear regression was y = 77426x-63634 with a correlation coefficient (r2) of 0.9996. The precision of the measurement of α-mangostin in the extract presented in term of %RSD was 1.53% which is an acceptable value from the AOAC international guidelines. Furthermore, the spike standard α-mangostin at three concentration levels based on α-mangostin content at 30.73 µg/mL in a validated sample which showed %recovery in the range 99.07-102.02%. The calculated limit of detection (LOD) and limit of quantification (LOQ) showed the limit at 2.76 and 8.37 µg/mL, respectively as shown in Tables 3 and 4.
Table 3. The parameters for method validation parameters for determination of α-mangostin.
|
No. |
Parameter |
Results |
|
1 |
Linear range (µg/mL) |
3.125-100 |
|
2 |
Linear regression |
y = 77426x-63634 |
|
3 |
Correlation coefficient (r2) |
0.9996 |
|
4 |
LOD (µg/mL) |
2.76 |
|
5 |
LOQ (µg/mL) |
8.37 |
|
6 |
α-mangostin (µg/mL in 100 µg/mL of crude extract) |
30.73 |
Table 4. The precision and accuracy of α-mangostin in G. mangostana extract using UAE.
|
No. |
Sample |
%RSD |
% Recovery |
|
|
1 |
G. mangostana extract |
1.53 |
- |
|
|
2 |
G. mangostana extract + α-mangostin 24 µg/mL |
0.64 |
102.07 |
|
|
3 |
G. mangostana extract + α-mangostin 30 µg/mL |
0.84 |
99.07 |
|
|
4 |
G. mangostana extract + α-mangostin 36 µg/mL |
1.39 |
100.52 |
|
|
Note: Results are shown as mean ± %RSD of three measurements |
|
|||
Total phenolic and flavonoid contents in G. mangostana extracts
From the determination of total phenolic content (TPC) in the extracts using the Folin–Ciocalteu assay, the stirring method for 24 h exhibited the highest phenolic content at 51.37 ± 9.21 mg GAE/g extract. The maceration for 24 h and UAE for 30 min presented similar TPC contents at 41.81 ± 4.08 and 40.06 ± 3.80 mg GAE/g extract, respectively as shown in Table 5.
A comparison of flavonoid content from the different extraction methods showed a significant and similar total flavonoid content in the extracts with values ranging between 20.86 ± 3.65-23.42 ± 1.57mg QE/g extract. The highest level was obtained from the extract made by stirring for 24 h.
Table 5. The total phenolic and flavonoid contents in G. mangostana extracts.
|
No. |
Method (Time) |
Total phenolic content |
Total flavonoid content (mg QE/g extract) |
|
|
1 |
Maceration (24 h) |
41.81 ± 4.08 |
23.27 ± 1.20 |
|
|
2 |
Stirring (8 h) |
34.87 ± 2.76 |
22.00 ± 3.19 |
|
|
3 |
Stirring (24 h) |
51.37 ± 9.21 |
23.42 ± 1.57 |
|
|
4 |
UAE (15 min) |
37.62 ± 1.72 |
20.86 ± 3.65 |
|
|
5 |
UAE (30 min) |
40.06 ± 3.80 |
21.85 ± 4.37 |
|
|
Note: Results are shown as mean ± %RSD of three measurements |
|
|||
Antioxidant activity of G. mangostana extract
The five extracts of G. mangostana pericarps were subjected to determination of their antioxidant activities using the DPPH assay. The extracts showed IC50 values between 65.84 ± 0.87-88.15 ± 1.39 µg/mL as shown in Table 6. The highest antioxidant activity was from the 24 h stirring method [especially condition for 24 h] having an IC50 value of 65.84 ± 0.87 µg/mL.
Table 6. The antioxidant activity using DPPH assay of G. mangostana extracts.
|
No. |
Method (Time) |
Antioxidant, IC50 (µg/mL) |
||
|
1 |
Maceration (24 h) |
88.15 ± 1.39 |
||
|
2 |
Stirring (8 h) |
71.14 ± 2.55 |
||
|
3 |
Stirring (24 h) |
65.84 ± 0.87 |
||
|
4 |
UAE (15 min) |
79.89 ± 1.56 |
||
|
5 |
UAE (30 min) |
81.74 ± 1.90 |
||
|
|
L-ascorbic acid |
138.69 |
||
|
Note: Results are shown as mean ± %RSD of three measurements |
|
|||
DISCUSSION
An investigation of three different extraction methods for G. mangostana pericarps resulted in different results including extraction yield, α-mangostin content, total phenolic, total flavonoid, and antioxidant activity. Extraction techniques and extraction time have influenced the percent yield of the crude extracts (Marliani et al., 2022; Gligor et al., 2023; Wang et al., 2024). The extraction method using stirring provided the highest yield of 28.04 ± 5.83% while the other methods using UAE or maceration gave between 21.87 ± 3.09-25.62 ± 4.58%. Higher yields of extract material were obtained with longer extraction times and the mechanism of extraction method. Furthermore, UAE provided a higher extraction rate than other methods, as was found by Jitrangsri et al. (2020).
To determine the major natural product component in G. mangostana extract, the method for measurement α-mangostin has been validated followed ICH guidelines (Q2R2) guidelines (ICH, 2023) and AOAC International (Appendix F: Guidelines for Standard Method Performance Requirements). The validation method included a study of specificity, linearity, range, precision, and accuracy. The sample concentration range for this method was 3.125-100 µg/mL with a correlation coefficient (r2) of 0.9996. The lowest concentration that can be determined by this method was 2.8 and 8.4 µg/mL for LOD and LOQ, respectively. The precision and accuracy of determination α-mangostin in the extracts were express in term of %RSD and %recovery which are acceptable values in the ICH (Q2R2) guidelines and AOAC International was less than 2% for %RSD and between 98-102% for %recovery. This study presented the values of %RSD and %recovery between 0.6-1.5% and 99.1-102.1%. Therefore, our analytical method has met the criteria of the ICH guidelines.
The phytochemical constituents in G. mangostana extract were studied by total phenolic and flavonoid content together with α-mangostin content. The extraction method using stirring for 24 h obtained the highest total phenolic and flavonoid content at 51.37 ± 9.21 mg GAE/g extract and 23.42 ± 1.57 mg QE/g extract, respectively. Furthermore, maceration provided total phenolic similar amount to the UAE method at 30 min. Flavonoid content was not significantly different between the three different extraction methods however longer extraction times provided higher content values as found in the method using maceration and stirring for 24 h. The content of α-mangostin corresponded well to the total phenolic content for which the highest amount was obtained from the stirring method. For the UAE method for 30 min the α-mangostin content was not different in amount from the stirring method after 24 h according to the ultrasonic wave attack to cell wall of G. mangostana and produced hot-spots with extreme pressure and high local temperature (Da Porto et al., 2013). Based on time considerations the UAE method should be the method of choice for the extraction of α-mangostin on a larger scale operation (Jacotet-Navarro et al., 2016; Belwal et al., 2019; Mehta et al., 2022).
The in vitro study of the antioxidant activity of the G. mangostana extracts using the DPPH assay showed IC50 values between 65.84 ± 0.87–88.15 ± 1.39 µg/mL. The most potent extract arising from the stirring for 24 h which showed the lowest IC50 at 65.8 µg/mL. The antioxidant results correlated with the total phenolic content in these extracts.
CONCLUSION
Three extraction methods for G. mangostana pericarps were investigated using maceration, stirring and ultrasonic assisted extraction (UAE) methods. The best extraction method found was the stirring method for 24 h using ethanol as the solvent which showed the highest extraction yield, total phenolics, total flavonoids, α-mangostin content, and antioxidant activity. Thus, G. mangostana extract can be used to develop cosmeceutical products, herbal products and herbal medicine. However, UAE can be another choice for extraction, which shows good extraction efficiency by reducing time and energy consumption in the process. Thus, the UAE method can be considered as a green process that is designed to minimize environmental impact by reducing the use of hazardous solvent, energy, and resources while maximizing efficiency and sustainability (Roobab et al., 2025).
ACKNOWLEDGEMENTS
We thank Thailand Science Research and Innovation (TSRI) for financial support. CA acknowledges the Thailand Institute of Scientific and Technological Research (TISTR) for facilities.
AUTHOR CONTRIBUTIONS
Chiramet Auranwiwat designed and conducted the analytical experiments, performed the data analysis and wrote the manuscript. Nahathai Intama and Thunwadee Limtharakul performed the extraction processes. Monsicha Pinthong and Wiriyanporn Sumsakul performed the DPPH assays. Thunwadee Limtharakul and Stephen G. Pyne assisted in the final drafting of the manuscript.
CONFLICT OF INTEREST
The authors declare that they hold no competing interests.
REFERENCES
Abood, W.N., Sarwan W. Bradosty, S.W., Shaikh, F.K., Salehen, N. Farghadani, R., Agha, N.F.S., Al-Medhtiy, M.H., Kamil, T.D.A., Agha, A.S., et al. 2020. Garcinia mangostana peel extracts exhibit hepatoprotective activity against thioacetamide-induced liver cirrhosis in rats. Journal of Functional Foods. 74: 104200. https://doi.org/10.1016/j.jff.2020.104200
Alam, M., Rashid, S., Fatima, K., Adnan, M., Shafie, A., Akhtar, M.S., Ganie, A.H., Eldin, S.M., Islam, A., Ilyas Khan, I., et al. 2023. Biochemical features and therapeutic potential of α-mangostin: Mechanism of action, medicinal values, and health benefits. Biomedicine & Pharmacotherapy. 163: 114710. https://doi.org/10.1016/j.biopha.2023.114710
AOAC International. 2016. Guidelines for standard method performance requirements. AOAC Official Methods of Analysis. 1-18.
Auranwiwat, C., Trisuwan, K., Saiai, A., Pyne, S.G., and Ritthiwigrom, T. 2014. Antibacterial tetraoxygenated xanthones from the immature fruits of Garcinia cowa. Fitoterapia. 98: 179-183. https://doi.org/10.1016/j.fitote.2014.08.003
Bavisetty, S.C.B., Karnjanapratum, S., Dave, J., Purba, D.T., Tanaji Kudre, T., Maser, W.H., Maiyah, N., Kingwascharapong, P., and Ali, A.M.M. 2024. Ultrasonication on collagen yield, physiochemical and structural properties from seabass (Lates calcarifer) scales as affected by pretreatment and extraction conditions. Natural and Life Sciences Communications. 23: e2024003. https://doi.org/10.12982/NLSC.2024.003
Belwal, T., Huang, H., Li, L., Duan, Z., Zhang, X., Aalim, H., and Luo, Z. 2019. Optimization model for ultrasonic-assisted and scale-up extraction of anthocyanins from Pyrus communis 'Starkrimson' fruit peel. Food Chemistry. 297: 124993. https://doi.org/10.1016/j.foodchem.2019.124993
Boonrat, C. and Indranupakorn, R. 2015. Influence of extraction techniques and solvents on α-mangostin amounts from mangosteen (Garcinia mangostana L.) pericarp. Thai Bulletin of Pharmaceutical Sciences. 10: 1-11.
Carreira-Casais, A., Otero, P., Garcia-Perez, P., Garcia-Oliveira, P., Pereira, A.G., Carpena, M., Soria-Lopez, A., Simal-Gandara, J., and Prieto, M.A. 2021. Benefits and drawbacks of ultrasound-assisted extraction for the recovery of bioactive compounds from marine algae. International Journal of Environmental Research and Public Health. 18(17): 9153. https://doi.org/10.3390/ijerph18179153
Da Porto, C., Porretto, E., and Decorti, D. 2013. Comparison of ultrasound-assisted extraction with conventional extraction methods of oil and polyphenols from grape (Vitis vinifera L.) seeds. Ultrasonics Sonochemistry. 20(4): 1076–1080. https://doi.org/10.1016/j.ultsonch.2012.12.002
Gligor, O., Clichici, S., Moldovan, R., Muntean, D., Ana-Maria Vlase, A.-M., Nadăs, G.C., Matei, I.A., Filip, G.A., Laurian Vlase, L., and Gianina Cris, G. 2023. The effect of extraction methods on phytochemicals and biological activities of green coffee beans extracts. Plants. 12: 712. https://doi.org/10.3390/plants12040712
Guana, Z., Chen, Q., Xu, Y., Hana, C., Wanga, M., Zhao, T., Zhaoa, H., and Fu, M. 2023. Ultrasonic-microwave extraction of glucoside alkaloids from potato peel residue and its antibacterial activity. Natural Product Research. 38(23): 4141–4145. https://doi.org/10.1080/14786419.2023.2278755
International Council for Harmonisation of Technical Requirements for Pharmaceuticals for Human Use. 2023. Validation of analytical procedures Q2(R2). 1-36.
Islam, M., Malakar, S., Rao, M.V., Kumar, N., and Sahu, J.K. 2023. Recent advancement in ultrasound‑assisted novel technologies for the extraction of bioactive compounds from herbal plants: A review. Food Science and Biotechnology. 32: 1763-1782. https://doi.org/10.1007/s10068-023-01346-6
Jacotet-Navarro, M., Rombaut, N., Deslis, S., Fabiano-Tixier, A.-S., Pierre, F.-X., Bily, A., and Chemat, F. 2016. Towards a "dry" bio-refinery without solvents or added water using microwaves and ultrasound for total valorization of fruit and vegetable by-products. Green Chemistry. 18: 3106-3115. https://doi.org/10.1039/C5GC02542G
Jitrangsri, K., Chaidedgumjorn, A., and Satiraphan, M. 2020. Effect of ethanol percentage upon various extraction methods of peanut based on antioxidant activity with trans-resveratrol and total phenolic contents. Pharmaceutical Sciences Asia. 47: 164-172. https://doi.org/10.29090/psa.2020.02.018.0056
Jujun, P., Pootakham, K., Pongpaibul, Y., Chadarat Duangrat, C., and Tharavichitkul, P. 2008. Acute and repeated dose 28-day oral toxicity study of Garcinia mangostana Linn. rind extract. Chiang Mai University Journal of Natural Science. 7: 199-208.
Kumar, G., Upadhyay, S., Yadav, D.K., Malakar, S., Dhurve, P., and Suri, S. 2023. Application of ultrasound technology for extraction of color pigments from plant sources and their potential bio-functional properties: A review. Journal of Food Process and Engineering. 46: e14238. https://doi.org/10.1111/jfpe.14238
Manasathien, J. and Piyanut Khanema, P. 2015. Antioxidant and cytotoxic activities of mangosteen Garcinia mangostana pericarp extracts. KKU Research Journal. 20: 381-392.
Marliani, N., Artika, I.M., and Nurcholis, W. 2022. Optimization extraction for total phenolic, flavonoid contents, and antioxidant activity with different solvents and uplc-ms/ms metabolite profiling of Justicia gendarussa Burm.f. Chiang Mai University Journal of Natural Sciences. 21: e2022046. https://doi.org/10.12982/CMUJNS.2022.046
Mehta, N., Jeyapriya. S., Kumar, P., Verma, A.K., Umaraw, P., Khatkar, S.K., Khatkar, A.B., Pathak, D., Kaka, U., and Sazili, A.Q. 2022. Ultrasound-assisted extraction and the encapsulation of bioactive components for food applications. Foods. 11: 2973. https://doi.org/10.3390/foods11192973
Mohammad, N.A., Zaidel, D.N.A., Muhamad, I.I., Hamid, M.A., Yaakob, H., and Jusoh, Y.M.M. 2019. Optimization of the antioxidant-rich xanthone extract from mangosteen (Garcinia mangostana L.) pericarp via microwave-assisted extraction. Heliyon. 5: e02571. https://doi.org/10.1016/j.heliyon.2019.e02571
Mohamed, G.A. and Ibrahim, S.R.M. 2020. New benzophenones and a dihydroflavanonol from Garcinia mangostana pericarps and their antioxidant and cytotoxic activities. Phytochemistry Letters. 39: 43-48. https://doi.org/10.1016/j.phytol.2020.07.007
Murugan, R. and Parimelazhagan, T. 2014. Comparative evaluation of different extraction methods for antioxidant and anti-inflammatory properties from Osbeckia parvifolia Arn. -An in vitro approach. Journal of King Saud University-Science. 26: 267-275. https://doi.org/10.1016/j.jksus.2013.09.006
Ovalle-Magallanes, B., Eugenio-Pérez, D., and Pedraza-Chaverri, J. 2017. Medicinal properties of mangosteen (Garcinia mangostana L.): A comprehensive update. Food and Chemical Toxicology. 109: 102-122. https://doi.org/10.1016/j.fct.2017.08.021
Ray, A., Dubey, K.K., Marathe, S.J., and Singhal, R. 2023. Supercritical fluid extraction of bioactives from fruit waste and its therapeutic potential. Food Bioscience. 52: 102418. https://doi.org/10.1016/j.fbio.2023.102418
Roobab, U., Aadil, R.M., Kurup, S.S., and Maqsood, S. 2025. Comparative evaluation of ultrasound-assisted extraction with other green extraction methods for sustainable recycling and processing of date palm bioresources and by-products: A review of recent research. Ultrasonics Sonochemistry. 114: 107252. https://doi.org/10.1016/j.ultsonch.2025.107252
Shen, L., Pang, S., Zhong, M., Sun, Y., Qayum, A., Liu, Y. Rashid, A., Xu, B., Liang, Q., Haile Ma, H., and Ren, X. 2023. A comprehensive review of ultrasonic assisted extraction (UAE) for bioactive components: Principles, advantages, equipment, and combined technologies. Ultrasonics Sonochemistry. 101: 106646. https://doi.org/10.1016/j.ultsonch.2023.106646
Singsai, K., Sakdavirote, A., Wechpanishkitkul, K. and Moonsamai, A. 2020. The comparison of phenolic compounds, flavonoids and antioxidant activities of the ethanolic extracts of shoots, leaves, fruits and seeds of Leucaena leucocephala. Naresuan Phayao Journal. 13: 66-73.
Sridhar, A., Ponnuchamy, M., Kumar, P.S., Kapoor, A., Dai‑Viet N. Vo, and Prabhakar, S. 2021. Techniques and modeling of polyphenol extraction from food: A review. Environmental Chemistry Letters. 19: 3409-3443. https://doi.org/10.1007/s10311-021-01217-8
Suksamran, N., Anantawat, V., Wattanaarsakit, P., Wei, C., Rahman, M.A., Majima, H.J., and Tangpong, J. 2022. Mangosteen vinegar from Garcinia mangostana: Quality improvement and antioxidant properties. Heliyon. 8: e11943. https://doi.org/10.1016/j.heliyon.2022.e11943
Tang, Z., Huang, G., and Huang, H. 2023. Ultrasonic/cellulase-assisted extraction of polysaccharide from Garcinia mangostana rinds and its carboxymethylated derivative. Ultrasonics Sonochemistry. 99: 106571. https://doi.org/10.1016/j.ultsonch.2023.106571
Tangyuenyongwatana, P. and Gritsanapan, W. 2022. Development of sunscreen containing alpha-mangostin riched extract with anti-tyrosinase activities. Chiang Mai University Journal of Natural Sciences. 21: e2022064. https://doi.org/10.12982/CMUJNS.2022.064
Thaisungnoen, K., Umar, M., Singh, M., and Anal, A.K. 2024. Ultrasonic-assisted extraction of bioactive extract from Napier grass (Pennisetum purpureum), evaluation of its bioactivity, antimutagenicity and cytotoxicity. Natural and Life Sciences Communications. 23: e2024014. https://doi.org/10.12982/NLSC.2024.014
Tran, T.H., Nguyen, V.T., Le, H.T., Nguyen, H.M., Tran, T.H., Thi, T.D., Nguyen, X.C., and Ha, M.T. 2021. Garcinoxanthones S-V, new xanthone derivatives from the pericarps of Garcinia mangostana together with their cytotoxic and antioxidant activities. Fitoterapia. 151: 104880. https://doi.org/10.1016/j.fitote.2021.104880
Wang, W., Liao, Y., Huang, X., Tang, C., and Cai, P. 2018. A novel xanthone dimer derivative with antibacterial activity isolated from the bark of Garcinia mangostana. Natural Product Research. 32: 1769-1774. https://doi.org/10.1080/14786419.2017.1402315
Wang, L. Sun, Z., Wang, L., and Tian, S. 2024. Optimization of ultrasonic-assisted extraction of polyphenols from Salvia deserta Schang flowers based on response surface methodology and deep neural network and analysis of its in vitro antioxidant activities. Industrial Crops & Products. 213: 118389. https://doi.org/10.1016/j.indcrop.2024.118389
Watanapokasin, R., Jarinthanan, F., Jerusalmi, A., Suksamrarn, S., Nakamura, Y., Sukseree, S., Uthaisang-Tanethpongtamb, W., Ratananukul, P., and Sano, T. 2010. Potential of xanthones from tropical fruit mangosteen as anti-cancer agents: Caspase-dependent apoptosis induction in vitro and in mice. Applied Biochemistry and Biotechnology. 162: 1080-1094. https://doi.org/10.1007/s12010-009-8903-6
Xynos, N., Papaefstathiou, G., Psychis, M., Argyropoulou, A., Aligiannis, N., and Skaltsounis, A.-L. 2012. Development of a green extraction procedure with super/subcritical fluids to produce extracts enriched in oleuropein from olive leaves. The Journal of Supercritical Fluids. 67: 89-93. https://doi.org/10.1016/j.supflu.2012.03.014
Yusnawan, E. 2018. Effects of different extraction methods on total phenolic content and antioxidant activity in soybean cultivars. Earth and Environmental Science. 102: 012039. https://doi.org/10.1088/1755-1315/102/1/012039
Zhang, L., Li, J., Huo, Y., Yang, W., Chen, J., Gao, Z., and Yang, Z. 2024. Ultrasonic extraction and antioxidant evaluation of oat saponins. Ultrasonics Sonochemistry. 109: 106989. https://doi.org/10.1016/j.ultsonch.2024.106989
OPEN access freely available online
Natural and Life Sciences Communications
Chiang Mai University, Thailand. https://cmuj.cmu.ac.th
Chiramet Auranwiwat1, *, Nahathai Intama2, Thunwadee Limtharakul2, Monsicha Pinthong1, Wiriyanporn Sumsakul1, and Stephen G. Pyne3
1 Expert Centre of Innovative Herbal Products, Thailand Institute of Scientific and Technological Research, Pathum Thani 12120, Thailand.
2 Department of Chemistry, Faculty of Science, Chiang Mai University, Chiang Mai 50200, Thailand.
3 School of Science, Molecular Horizons Institute, University of Wollongong, Wollongong, NSW 2522, Australia.
Corresponding author: Chiramet Auranwiwat, E-mail: chiramet@tistr.or.th
ORCID iD:
Chiramet Auranwiwat: https://orcid.org/0000-0003-1375-4381
Thunwadee Limtharakul: https://orcid.org/0000-0002-0426-3663
Monsicha Pinthong: https://orcid.org/0000-0001-5970-2232
Wiriyanporn Sumsakul: https://orcid.org/0000-0002-6081-794X
Stephen G. Pyne: https://orcid.org/0000-0003-0462-0277
Total Article Views
Editor: Sirasit Srinuanpan,
Chiang Mai University, Thailand
Article history:
Received: August 6, 2024;
Revised: October 31, 2025;
Accepted: November 4, 2025;
Online First: November 13, 2025