 ISSN: 2822-0838 Online

Volumetric Changes in the Pharyngeal Airways of Skeletal Class III Patients Following Various Orthognathic Surgeries: A Short-/Long-Term Follow-Up
Unthika Soodtoetong, Jira Kitisubkanchana, Natchalee Srimaneekarn, Lukas Benedikt Seifert, and Chakorn Vorakulpipat*Published Date : October 3, 2025
DOI : https://doi.org/10.12982/NLSC.2026.006
Journal Issues : Number 1, January-March 2026
Abstract Orthognathic surgery corrects skeletal deformities affecting the pharyngeal airway. This study assessed immediate and long-term volumetric changes in the airway after surgery. In this observational study, upon orthognathic surgery, 52 class III deformity patients underwent three types of surgery: isolated mandibular setback, maxillomandibular setback, and mandibular setback with maxillary advancement. Cone-beam computed tomography was used to analyze the nasopharyngeal, oropharyngeal, and hypopharyngeal airway volumes at three time points. In isolated mandibular setback, oropharyngeal and hypopharyngeal volumes significantly decreased immediately after surgery, without long-term relapse. Maxillomandibular setback showed reduced hypopharyngeal volume in both follow-ups. Mandibular setback with maxillary advancement slightly increased nasopharyngeal volume, while oropharyngeal and hypopharyngeal volumes decreased postoperatively, increasing in the long term. Linear regression analysis revealed a prediction model for % change in pharyngeal volume using ∆B (P<0.05). Orthognathic surgery, particularly isolated mandibular setback, narrows the pharyngeal airway. Monitoring postoperative airway changes is crucial, especially for obstructive sleep apnea patients. Consideration of bimaxillary surgery with maxillary advancement may prevent the narrowing of the airway, especially in the immediate postoperative phase. Further investigation is needed to understand the dynamic long-term changes in the pharyngeal volume and also clinical outcomes, whether relapse or body compensation. A deeper understanding of these long-term effects will be critical for optimizing treatment planning, enhancing patient safety, and refining surgical strategies in orthognathic surgery.
Keywords: Pharyngeal airway changes, Airway prediction, Skeletal class III deformities, Orthognathic surgery, Obstructive sleep apnea
Graphical Abstract:

Citation: Soodtoetong, U., Kitisubkanchana, J., Srimaneekarn, N., Seifert, L.B., and Vorakulpipat, C. 2026. Volumetric changes in the pharyngeal airways of skeletal class iii patients following various orthognathic surgeries: A short-/long-term follow-up. Natural and Life Sciences Communications. 25(1): e2026006.
INTRODUCTION
Skeletal class III malocclusion, which has a multifactorial etiology, is characterized by dental or skeletal discrepancies. The incidence of mandibular prognathism is as low as 1% in Caucasian populations and as high as 15% in Asian populations (Allwright, 1964; Emrich et al., 1965). Orthognathic surgery is an option for correcting class III skeletal deformities (Chen et al., 2005; Jakobsone et al., 2010), possibly including isolated mandibular setback, maxillary advancement, maxillary advancement combined with mandibular setback, and rarely, maxillomandibular setback (Figure 1). However, jaw movement through orthognathic surgery also affects the pharyngeal airway due to the complex surrounding structures, including the velum, the base of the tongue, the hyoid and the adjacent soft tissue (Greco et al., 1990). According to the literature, maxillomandibular advancement increases the posterior airway space (PAS), whereas setbacks reduce it (Chen et al., 2007; Alcalde et al., 2019; Sahoo et al., 2021), possibly leading to obstructive sleep apnea (OSA). Some studies suggest that maxillary advancement combined with mandibular setback surgery is beneficial for preventing postoperative airway impairment since mandibular setbacks cause reduced PAS (Mattos et al., 2011; Park et al., 2012; Fernández-Ferrer et al., 2015; Choi et al., 2020).
The greatest changes in airway volume are observed directly after surgery, followed by subsequent relapse over long-term observation (Chang et al., 2015; Khaghaninejad et al., 2022). In 2021, Chen et al. (2021) reported that large mandibular setbacks can lead to constriction of the pharyngeal airway and thus to airway obstruction immediately after surgery, which should be considered when planning orthognathic surgery. Some studies have revealed airway volume alterations following orthognathic surgery. Most reports have studied the changes in the PAS in 2 dimensions after mandibular setback on lateral cephalograms (Chen et al., 2005; Muto, 2008). Although it is considerably more challenging to predict airway volume alterations in bimaxillary surgery, a few studies have produced a formula that can predict airway volume alterations after each surgical procedure (Brunetto et al., 2014; Hart et al., 2015). Additionally, the analytic bounds of each study were distinct, and some investigations did not distinguish between anatomical segments. A variety of computer applications have been created and are now widely used for digitally planning orthodontic therapy and orthognathic surgery, e.g., Dolphin3D software (Dolphin Imaging & Management System, Chatsworth, CA, USA) (El and Palomo, 2010; Alves et al., 2012; Weissheimer et al., 2012). In addition, quantitative analysis of areas including the PAS can now be performed.
The pharyngeal airway can be divided into three anatomical segments as described by Park et al. (2012): the nasopharynx (NP), oropharynx (OP), and hypopharynx (HP). Various surgical methods for the correction of mandibular prognathism have been developed and are now widely used, e.g., mandibular setbacks with or without maxillary orthognathic surgery. These different surgical procedures might affect each level of the PAS differently. A study using cone-beam computed tomography (CBCT) revealed that mandibular setback decreased the pharyngeal volume, predominantly in the OP and HP (Park et al., 2012), whereas maxillary advancement increased the NP volume (Chang et al., 2015). Another study showed that maxillary advancement with mandibular setback did not have a substantial effect on the pharyngeal airway as a whole due to the sum of the volume changes (Lee et al., 2012).
In our study, three different surgical methods, bilateral sagittal split ramus osteotomy (BSSRO) setback, LeFort I osteotomy and BSSRO setback, and LeFort I advancement and BSSRO setback, were used to correct mandibular prognathism. The objective of this investigation is to evaluate the impact of maxillomandibular surgical procedures on postoperative airway dimensions, both immediately following surgery and at long-term follow-up. Therefore, the aim of this study was to quantitatively analyze and compare volumetric changes in the pharyngeal airway at three anatomical segments following these methods. In addition, postoperative airway stability and the relationship between the distance of mandibular movement and airway volume changes were investigated.
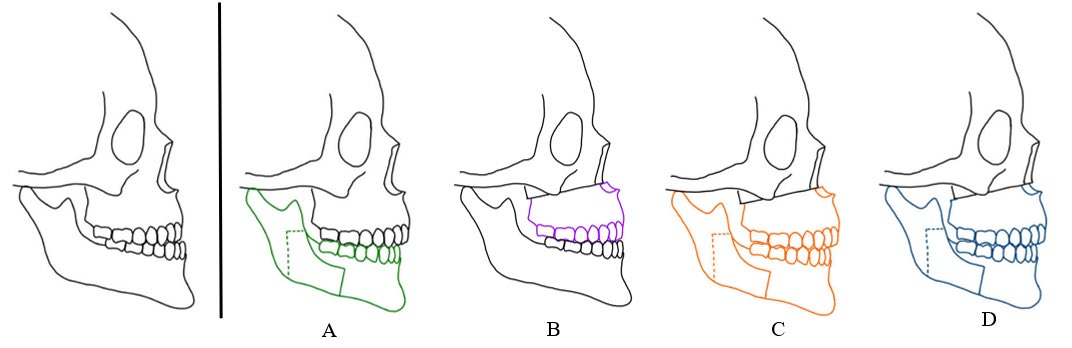
Figure 1. Common treatment options for skeletal class III deformities. A) Isolated mandibular setback, B) Maxillary advancement, C) Maxillary advancement with mandibular setback, D) Maxillomandibular setback.
MATERIALS AND METHODS
This study was approved by the ethics committee of the Institutional Review Board of the Faculty of Dentistry/Faculty of Pharmacy, Mahidol University (COA. MU-DT/PY-IRB 2020/0.62.0810). Each subject acknowledged the protocol and then written informed consent forms for publication were signed.
In this observational study, patients with skeletal class III deformities who underwent orthognathic surgery at the Department of Oral and Maxillofacial Surgery, Faculty of Dentistry, Mahidol University, between 2017 and 2020 were included in this study. The sample for this observational study consisted of a consecutive series of patients with skeletal class III deformities who underwent orthognathic surgery and met all inclusion and exclusion criteria. The surgical planning was performed to correct the skeletal deformities, patients with normal maxilla configuration had only mandibular setbacks while patients with retrognathic maxilla received maxillary advancement with mandibular setback and patients with maxilla prognathism received maxillomandibular setback surgery.
The patients were assigned to three groups according to the method of orthognathic surgery: bilateral sagittal split ramus osteotomy (BSSRO) setback (group I), LeFort I osteotomy and BSSRO setback (group II), and LeFort I advancement and BSSRO setback (group III). Internal rigid fixation was performed with 2.0 miniplates and screws in a standard fashion by the same surgeon. All of the patients had a body mass index (BMI) between 18.5 and 22.9 kg/m2 and no underlying diseases. The following exclusion criteria were used: (a) additional maxillary and/or mandibular surgery (i.e., segmented osteotomy, subapical osteotomy, or genioplasty), (b) previous orthognathic surgery, (c) severe facial asymmetry, or (d) a diagnosis of respiratory disease that could affect pharyngeal airway configuration.
CBCT images obtained at three time points, preoperative (T0), immediately postoperative (T1), and 6 months postoperative (T2), were retrieved. All CBCT scans were taken using a CS 9,500 machine (Carestream Health, Rochester, NY, USA) with a voltage of 90 kVp, current of 10 mA, field of view of 18x20.6 cm, voxel size of 0.3 mm3 and scanning time of 10.80 seconds or a Planmeca Proface Mid machine (Planmeca, Helsinki, Finland) with a voltage of 90 kVp, current of 8 mA, field of view of 17.5x20 cm, voxel size of 0.4 mm3 and scanning time of 27 seconds. The subjects were seated in an upright position with maximum intercuspation, and the Frankfort horizontal plane was parallel to the floor.
To evaluate airway characteristics, the CBCT data were exported in DICOM format. The airway was analyzed using Dolphin3D Imaging software (version 11.95, Dolphin Imaging & Management system, Chatsworth, CA, USA). To perform the jaw distance and volume measurements, reference points and planes were identified, as shown in Table 1.
Table 1. Landmarks and planes.
|
References |
Definitions |
|
A-point |
the deepest point in concavity of anterior maxilla |
|
B-point |
the deepest point in concavity of anterior mandible |
|
FH plane |
the Frankfort horizontal plane |
|
Na-PP plane |
the plane which perpendicular to the FH plane and passed through Nasion point |
|
PNS-V plane |
the plane which passed the Posterior nasal spine point to the most posterior point of the Vomer |
|
CV1 |
the plane which parallels to the FH plane and passed through the most inferoanterior point of the 1st cervical vertebra |
|
CV2 |
the plane which parallels to the FH plane and passed through the most inferoanterior point of the 2nd cervical vertebra |
|
CV4 |
the plane which parallels to the FH plane and passed through the most inferoanterior point of the 4th cervical vertebra |
Midsagittal CBCT images were selected. Maxillary and mandibular movement was measured in mm using the difference in the distance from points A (Maxillary movement) and point B (Mandibular movement) to the Na‒PP plane at each time point (Figure 2). For airway analysis, the pharyngeal airway was divided into 3 levels according to Park’s protocol (Park et al., 2012), the nasopharynx (NP; between the PNS-V plane and CV1 plane), oropharynx (OP; between the CV1 and CV2 planes), and hypopharynx (HP; between the CV2 and CV4 planes) (Figure 3). The airway volume at each level was analyzed using the Sinus/Airway tool in Dolphin software. The area of interest was manually outlined at each airway level (NP, OP and HP) as previously described. Then, the threshold value was selected to fill the degree of airway at a detection sensitivity of 70% and the airway volume was automatically calculated in mm3. The excess selected area was manually selected from the axial and coronal CBCT images at the corresponding level (Figure 4). Airway measurements were made at T0, T1 and T2. A generalized linear model with repeated measures analysis was used to identify significant differences in airway volume among the three time points, with a P value less than 0.05 considered to indicate statistical significance. To eliminate confounding factors of the baseline volume, the altered airway volume was calculated as a percentage change before prediction analysis (Brunetto et al., 2014). The skeletal relapse was defined as the anteroposterior change in the position of the A-point or B-point from the immediate postoperative (T1) to the 6-month postoperative (T2) time point.
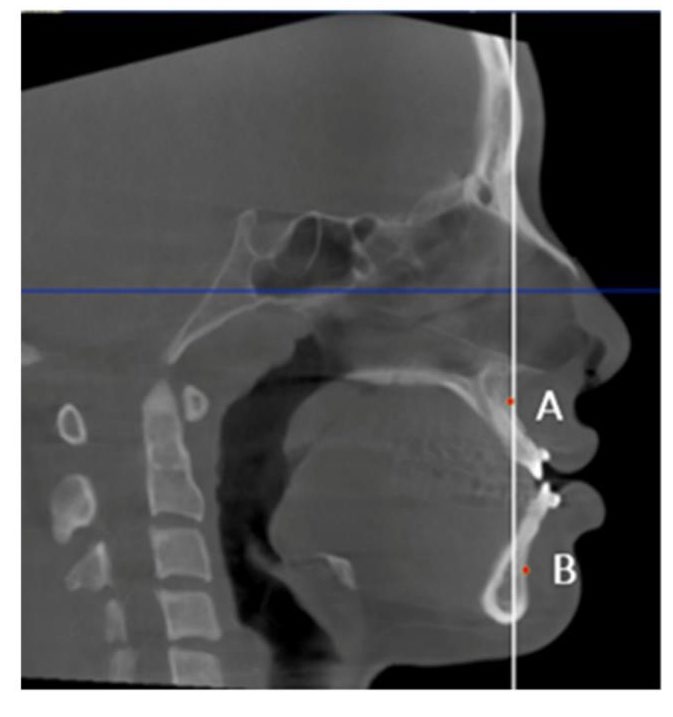
Figure 2. Skeletal movement measured using the distance from points A and B to the Na–PP plane (white line).
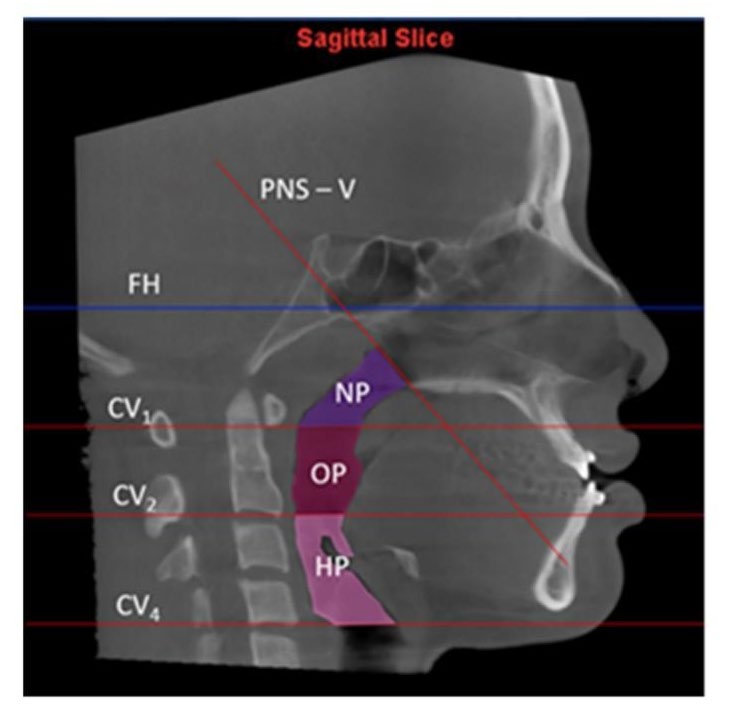
Figure 3. Boundaries of each airway level.
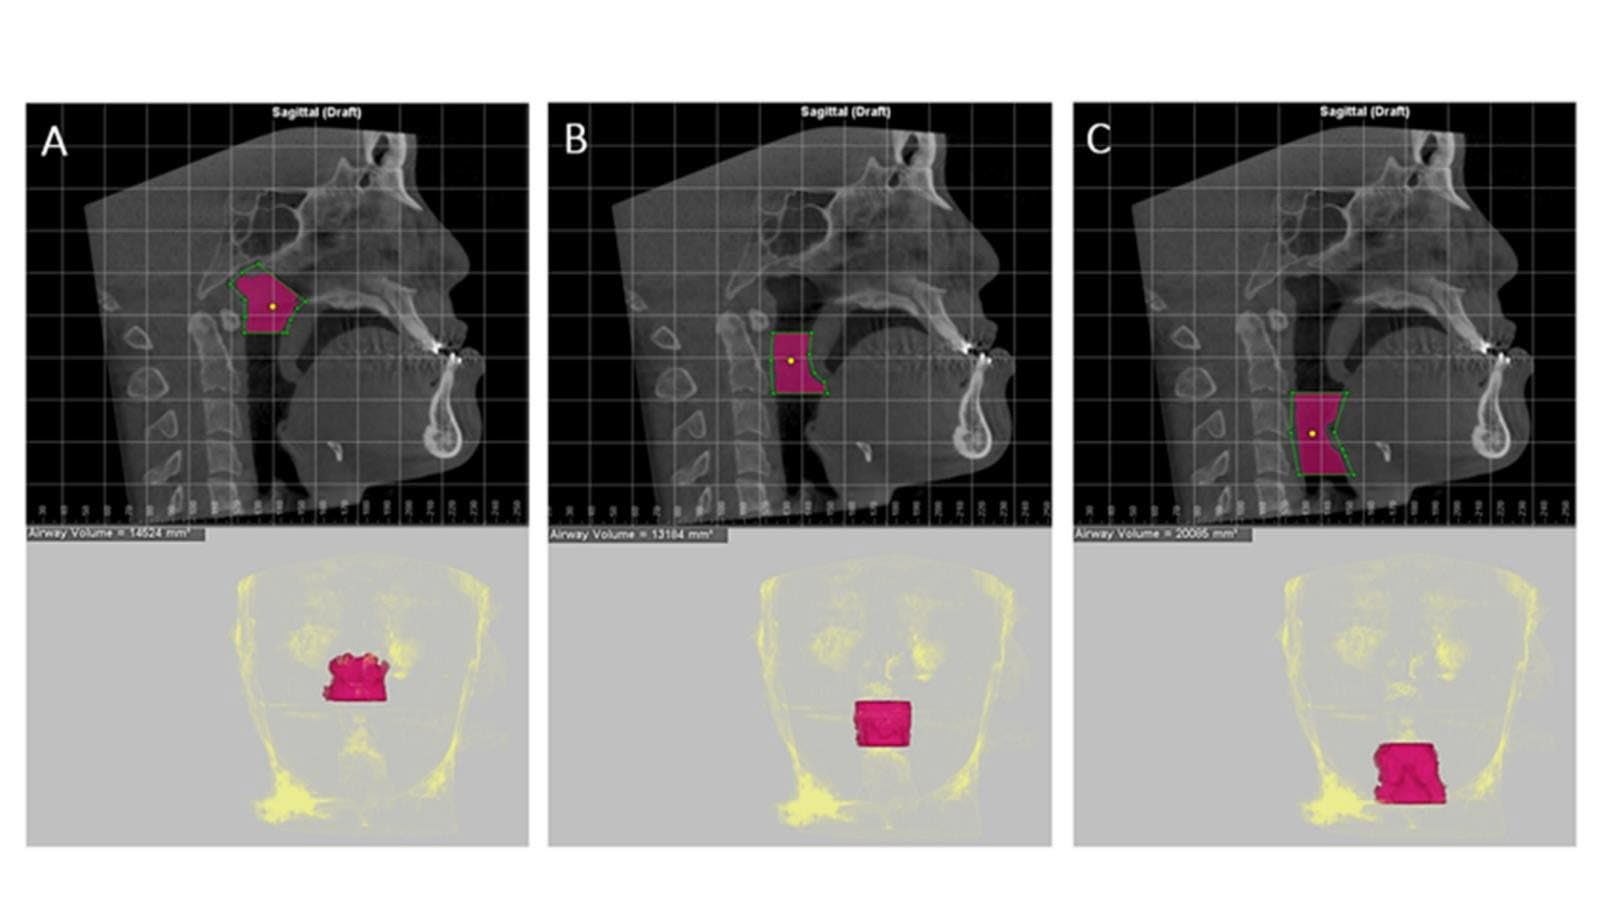
Figure 4. Measurement of the pharyngeal airway volume at 3 levels. The green lines indicate the airway level boundaries, while the purple area indicates the designated region of interest; the threshold value selected was 70%. The morphology of the airway was determined as follows. A: Nasopharynx. B: Oropharynx. C: Hypopharynx.
Statistical analysis
All CBCT analyses were performed by an examiner (US) who was previously calibrated with an oral and maxillofacial radiologist (JK). To determine the reliability of the findings, CBCT images of 10 randomly selected subjects were measured twice at 2-week intervals. The intraclass correlation coefficient was analyzed, and values of 0.82-0.98 were obtained, indicating high reliability.
Statistical analyses were performed using IBM SPSS Statistics for Windows, Version 27.0 (IBM Corp., Armonk, NY, USA). To compare airway volumes between time points, the change in volume for each patient was calculated by subtracting the measurement from the earlier time point from that of the later time point (e.g., T1−T0, T2−T1, and T2−T0). A paired t-test was then performed on these calculated differences to determine if the mean change was significantly different. A P value of <0.05 was considered to indicate statistical significance for all analyses. Then, to investigate the relationship between skeletal movement and airway changes, the outcome variable was first calculated as a percentage change from the baseline (T0) volume to normalize for inter-individual variations. Simple and multiple linear regression models were then used to determine the relationships between anteroposterior skeletal movement (∆A and ∆B) and the percentage change in airway volume for each surgical group.
RESULTS
CBCT images of 52 patients (16 men, 36 women) aged 21-61 years (average age 27 ± 6.81 years) were included in the present study. There were 19 subjects in group I, with an average mandibular setback of 7.32 ± 3.28 mm (range 2.9-17.0 mm) and a mandible relapse of 0.6 ± 1.61 mm; 11 subjects in group II, with an average initial maxillary setback of 2.03 ± 1.29 mm (range 0.5-4.5 mm), a mandibular setback of 6.82 ± 2.92 mm (range 1.4-11.2 mm), a maxillary relapse of -0.6 ± 0.98 mm, and a mandible relapse of 0.4 ± 1.19 mm; and 22 subjects in group III, with an average maxillary advancement of 2.19 ± 1.14 mm (range 0.7-5.7 mm), a mandibular setback of 8.04 ± 4.57 mm (range 0.2-20.3 mm), a maxillary relapse of -0.7 ± 0.78 mm, and a mandible relapse of 1.1 ± 1.32 mm.
Table 2 shows the changes in airway volume at three time points for the three orthognathic surgery procedures. In group I, the NP volume was slightly decreased from T0 to T1 without a significant difference, but at T2 (6 months postoperatively), there was a highly significant increase compared to the NP volume at T1 (P = 0.003). Moreover, the OP volume, HP volume and total volume at T1 were also drastically and significantly decreased compared to the values at T0 (OP volume, P = 0.011; HP volume, P = 0.001; and total volume, P = 0.002). However, the HP volume (P = 0.049) and total volume (P = 0.025) were significantly increased at T2 compared to T1. In contrast, at T2, no statistically significant differences were evident compared to T0 at any level of the pharynx (T0−T2).
In group II, the HP volume at T1 was significantly decreased compared to that at T0 (P = 0.007) and was still significantly decreased at T2 compared to that at T0 (P = 0.046). Moreover, the total volume was significantly decreased at T1 compared to that at T0 (P = 0.002) and at T2 compared to that at T0 (P = 0.010). There were no statistically significant differences in the NP or OP volume at any time point.
In group III, the OP volume at T1 was significantly decreased compared to that at T0 (P = 0.011) and still significantly decreased at T2 compared to that at T0 (P = 0.020), and the HP volume at T1 was significantly decreased compared to that at T0 (P = 0.036). However, at T2, there was no statistically significant difference in volume compared to that at T1 (T0−T2). No statistically significant differences were evident in the NP or total volume at any time point (Figure 5).
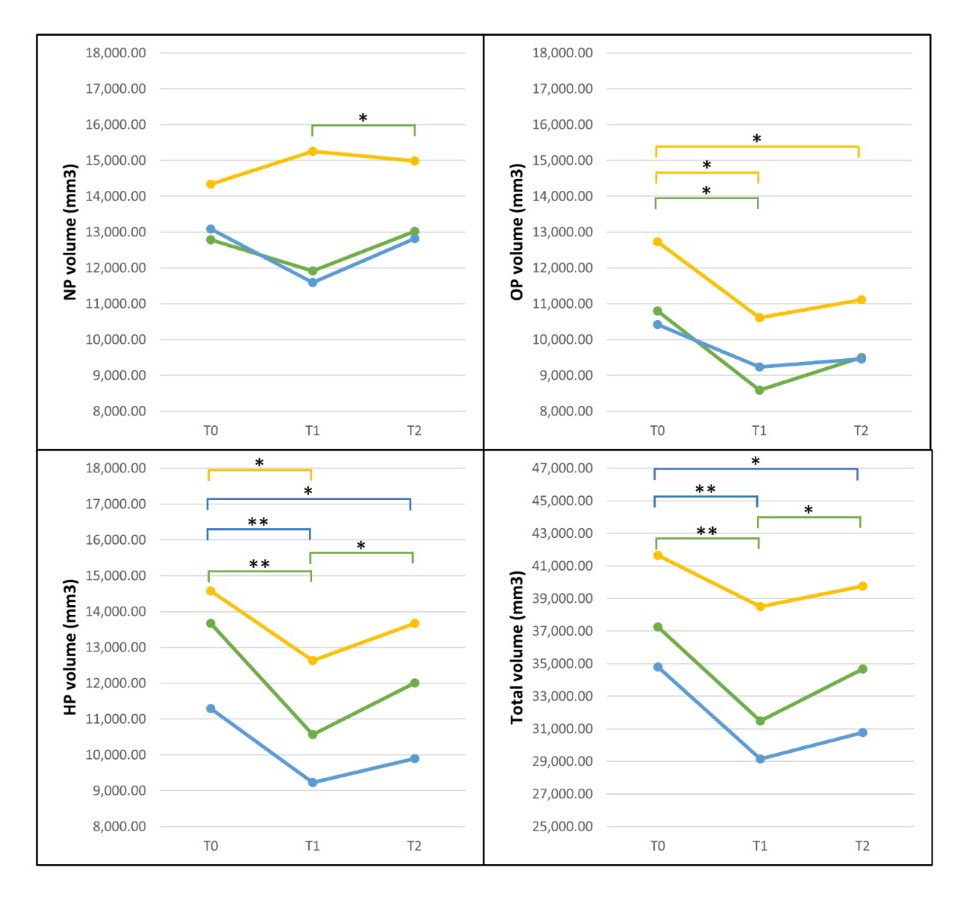
Figure 5: Comparison of airway volume changes following three orthognathic surgery procedures at three time points: green, group I; blue, group II; and yellow, group III. *Significantly different at P<0.05, **Significantly different at P<0.01
Table 2. Comparisons of airway volume changes following orthognathic surgery.Note: *Significantly different at P<0.05, **Significantly different at P<0.01
|
|
|
|
T0 - T1 |
T1 -T2 |
T0 -T2 |
|
Group I |
NP volume (mm3) |
Mean |
-872.74 |
1108.84 |
236.11 |
|
SD |
433.71 |
284.93 |
326.65 |
||
|
P-value |
0.178 |
0.003* |
1.000 |
||
|
OP volume (mm3) |
Mean |
-2214.58 |
917.05 |
-1297.53 |
|
|
SD |
661.13 |
524.66 |
592.14 |
||
|
P-value |
0.011* |
0.293 |
0.125 |
||
|
HP volume (mm3) |
Mean |
-3110.95 |
1438.16 |
-1672.79 |
|
|
SD |
614.88 |
542.85 |
707.48 |
||
|
P-value |
0.001** |
0.049* |
0.088 |
||
|
Total volume (mm3) |
Mean |
-5791.11 |
3214.16 |
-2576.95 |
|
|
SD |
1380.08 |
1082.94 |
1391.56 |
||
|
P-value |
0.002** |
0.025* |
0.242 |
||
|
Group II |
NP volume (mm3) |
Mean |
-1492.64 |
1224.64 |
-268.00 |
|
SD |
603.21 |
426.84 |
492.17 |
||
|
P-value |
0.099 |
0.050 |
1.000 |
||
|
OP volume (mm3) |
Mean |
-1180.64 |
224.36 |
-956.27 |
|
|
SD |
1222.72 |
228.01 |
1342.12 |
||
|
P-value |
1.000 |
1.000 |
1.000 |
||
|
HP volume (mm3) |
Mean |
-2062.36 |
663.09 |
-1399.27 |
|
|
SD |
508.43 |
438.88 |
479.35 |
||
|
P-value |
0.007** |
0.485 |
0.046* |
||
|
Total volume (mm3) |
Mean |
-5663.00 |
1622.91 |
-4040.09 |
|
|
SD |
1161.77 |
1157.51 |
1050.25 |
||
|
P-value |
0.002** |
0.573 |
0.010* |
||
|
Group III |
NP volume (mm3) |
Mean |
914.09 |
-270.46 |
643.64 |
|
SD |
514.41 |
572.12 |
322.87 |
||
|
P-value |
0.270 |
1.000 |
0.178 |
||
|
OP volume (mm3) |
Mean |
-2120.50 |
496.36 |
-1624.14 |
|
|
SD |
650.08 |
523.33 |
538.67 |
||
|
P-value |
0.011* |
1.000 |
0.020* |
||
|
HP volume (mm3) |
Mean |
-1939.09 |
1037.82 |
-901.27 |
|
|
SD |
704.82 |
696.58 |
471.16 |
||
|
P-value |
0.036* |
0.453 |
0.208 |
||
|
Total Volume (mm3) |
Mean |
-3145.50 |
1263.73 |
-1881.77 |
|
|
SD |
1474.88 |
1413.05 |
979.90 |
||
|
P-value |
0.135 |
1.000 |
0.205 |
Note: *Significantly different at P<0.05, **Significantly different at P<0.01
P-values were derived from paired t-tests comparing airway volumes between the two time points indicated in each column header (e.g., the P-value in the T0–T1 column corresponds to the T0 vs. T1 comparison).
Linear regression analyses of the relationship between jaw movement and percentage of airway volume change are shown in Table 3. In the isolated mandibular setback group, the regression model demonstrated a statistically significant association with airway changes. The amount of mandibular setback explained 37% of the variance in oropharyngeal volume change between T0 and T1 (R2 = 0.37). Similarly, mandibular setback accounted for 22% of the variance in the total airway volume change and the regression equations were %OP change T0–T1=13.19+4.14 (∆B) and %total change T0–T1=3.23+2.31 (∆B). However, in groups II and III, no significant correlations were found (Table 4-5).
Table 3. Linear regression analysis showing the effect of mandibular movement in mm on the percent change in airway volume in group I.
|
|
Regression equation |
R2 |
P-value |
|
NP volume T0-T1 T0-T2 T1-T2 |
1.18+0.84∆B 7.11+0.44∆B 9.01+2.07∆B |
0.03 0.01 0.03 |
0.482 0.631 0.494 |
|
OP volume T0-T1 T0-T2 T1-T2 |
13.19+4.14∆B 2.93+1.42∆B 11.87+10.35∆B |
0.37 0.04 0.08 |
0.006** 0.438 0.230 |
|
HP volume T0-T1 T0-T2 T1-T2 |
-7.59+1.45∆B 3.35+1.75∆B 11.06+9.84∆B |
0.07 0.07 0.15 |
0.288 0.286 0.103 |
|
Total volume T0-T1 T0-T2 T1-T2 |
3.21+2.31∆B 4.06+1.22∆B 8.30+6.69∆B |
0.22 0.06 0.15 |
0.041* 0.320 0.100 |
Note: ∆B, distance of mandibular movement; SD, standard deviation
*Significantly different at P<0.05; **Significantly different at P<0.01
Table 4. Linear regression analysis showing the effect of jaw movement in mm on the percent change in airway volume in group II.
|
|
Regression equation |
R2 |
P-value |
|
NP volume T0-T1 T0-T2 T1-T2 |
18.02+6.95∆A+2.09∆B 15.80+2.39∆A+1.47∆B 11.02-2.81∆A+0.57∆B |
0.31 0.28 0.04 |
0.224 0.266 0.863 |
|
OP volume T0-T1 T0-T2 T1-T2 |
-39.41-3.14∆A-1.42∆B -18.79-2.53∆A-1.34∆B 2.52+2.51∆A+2.97∆B |
0.05 0.01 0.32 |
0.803 0.947 0.209 |
|
HP volume T0-T1 T0-T2 T1-T2 |
-11.49+0.83∆A+0.99∆B -10.36-1.63∆A+1.23∆B 12.33+9.72∆A+3.49∆B |
0.02 0.14 0.27 |
0.932 0.551 0.280 |
|
Total volume T0-T1 T0-T2 T1-T2 |
-6.69+2.44∆A+0.83∆B 3.08+0.10∆A+2.16∆B 3.02+9.33∆A+3.31∆B |
0.05 0.42 0.14 |
0.823 0.111 0.550 |
Note: ∆A, distance of maxillary movement; ∆B, distance of mandibular movement; SD, standard deviation
*Significantly different at P<0.05; **Significantly different at P<0.01
Table 5. Linear regression analysis showing the effect of jaw movement in mm on the percent change in airway volume in group III.
|
|
Regression equation |
R2 |
P-value |
|
NP volume T0-T1 T0-T2 T1-T2 |
8.41-1.24∆A-0.30∆B 2.88+2.97∆A+0.09∆B 9.02+5.86∆A-3.55∆B |
0.01 0.07 0.12
|
0.908 0.496 0.303 |
|
OP volume T0-T1 T0-T2 T1-T2 |
1.61-4.00∆A+0.62∆B -11.19+2.81∆A+0.40∆B 8.60-0.15∆A-2.08∆B |
0.05 0.04 0.01 |
0.598 0.708 0.871 |
|
HP volume T0-T1 T0-T2 T1-T2 |
4.25-0.44∆A+1.89∆B -0.41+2.01∆A+1.06∆B 7.74+5.50∆A+9.22∆B |
0.16 0.09 0.16 |
0.200 0.417 0.200 |
|
Total volume T0-T1 T0-T2 T1-T2 |
5.73-1.80∆A+0.92∆B -1.56+2.15∆A+0.66∆B 7.45+3.69∆A+0.61∆B |
0.07 0.08 0.03
|
0.527 0.433 0.762 |
Note: ∆A, distance of maxillary movement; ∆B, distance of mandibular movement; SD, standard deviation
*Significantly different at P<0.05; **Significantly different at P<0.01
DISCUSSION
This study demonstrated that isolated mandibular setback caused significant immediate reductions in oropharyngeal and hypopharyngeal volumes, which gradually recovered over time. Maxillomandibular setback resulted in persistent reductions in hypopharyngeal volume at both short- and long-term follow-ups, whereas mandibular setback combined with maxillary advancement showed less pronounced airway constriction, with partial recovery in the long term. Regression analysis revealed that mandibular setback was a significant predictor of immediate airway reduction, with approximately 4% decrease in oropharyngeal volume per millimeter of setback.
Currently, CBCT is widely used in dentistry because it can provide imaging of anatomical structures in three dimensions. In orthognathic surgery, CBCT data can be used for treatment planning and quantitative prediction of airway changes after surgical treatment. The Dolphin3D program was chosen for this study because it can be used for surgical planning as well as pharyngeal airway assessment and allows the user to customize the threshold value. Alves et al performed airway volume measurements using Dolphin3D software and reported that there was no significant difference when selecting threshold values of 70-75% compared to water volume as the gold standard (Alves et al., 2012). In addition, they found that the threshold value of 73% was the most accurate value for airway volume analysis. However, in the present study, when we set the threshold value to 73%, the airway volume measured by the software seemed to be overestimated. Therefore, the value of 70% was selected in this study as the recommendation of an oral and maxillofacial radiologist. According to the literature, there are several variations in airway boundaries at each anatomical airway level. We chose hard tissue as a reference using Park’s protocol because it can be accurately represented at the same position at each time point (Park et al., 2012; Lee et al., 2013). Soft tissue is pliable and affected by head position; when obtaining a CBCT image, the patient's head posture impacts the airway volume by collapsing the cross-sectional axial area in the retropalatal and retroglossal regions (Cooke, 1990; Solow and Sandham, 2002). Additionally, several studies have reported alterations in the pharyngeal airway at various times following orthognathic surgery without specifying the exact follow-up time. Numerous studies have indicated that postoperative edema and inflammation lead to initial constriction of the pharyngeal airway. Saitoh, (2004) and Kawakami et al. (2005) revealed that postoperative edema can resolve within a month, while Hochban et al. (1996) and Chen et al. (2007) found no significant change in the airway measurements between the short-term (3-6 months postoperative) and long-term (2 years postoperative) follow-up. As a consequence, comparing airway analyses from different studies is complicated. In our study, we focused on 2 time points: immediately postoperative (representing short-term studies, average 9.32 ± 5.28 days), which showed the narrowest airway affected by postoperative swelling, and long-term postoperative (average 6.94 ± 1.34 months), which represented long-term airway stability.
In group I, the NP volume decreased from T0–T1 and significantly increased from T1–T2, with no difference from T0–T2. This was consistent with previous studies showing that isolated mandibular setbacks had no influence on the NP airway (Park et al., 2012; Fernández-Ferrer et al., 2015). This may be associated with postoperative edema, which occurs immediately following surgery. However, over time, the surrounding soft tissue undergoes adaptation, enabling near-complete restoration of normal function (Kawakami et al., 2005; Sahoo et al., 2021; Khaghaninejad et al., 2022). Mandibular setbacks and postoperative inflammation caused a significant decrease in the OP, HP, and total pharyngeal volume at T0–T1. The oropharynx (OP) is situated behind the jaw and the base of the tongue. As a result, the volume of the oropharynx is significantly decreased after the operation. Similarly, the decrease in the volume of the hypopharynx (HP) is influenced by the posterior displacement of the hyoid bone, elongation of the suprahyoid muscles, and constriction of the space behind the tongue (retroglossal area) (Kawakami et al., 2005; Park et al., 2012). During the immediate postoperative period, there is a reported increase in both the OP and HP volumes, as noted during long-term follow-up (Hochban et al., 1996). The long-term improvement in airway volume following surgery may result from physiological adaptations aimed at preventing the collapse of the pharyngeal airway. Kawakami et al. (2005) reported that after surgery, the hyoid bone progressively moved back to its original position, causing the pharyngeal airway to return to almost the same volume as before. Several studies have reported predictions of the PAS with strong correlations in lateral cephalograms using mandibular movement (Chen et al., 2005; Muto et al., 2008). Our study revealed that mandibular movement can be used as an indicator of the percentage change in the OP volume during T0–T1 and can also predict the total volume during T0–T1 in isolated mandibular setback surgery. The regression model for isolated mandibular setback demonstrated that the amount of mandibular movement (∆B) was a significant predictor of immediate postoperative airway changes. The regression coefficient for the oropharynx indicates that for each millimeter the mandible is surgically setback, the OP volume is predicted to decrease by 4.14% (P = 0.006), and the total airway volume is predicted to decrease by 2.31% (P = 0.041) This intervention may successfully prevent acute postoperative airway constriction in individuals with obstructive sleep apnea (OSA) or those at greater risk for this condition. Nevertheless, we cannot predict the long-term outcomes due to the potential for the muscle to adjust in order to compensate, as previously described.
Within group II, the amount of NP showed a more pronounced reduction from T0 to T1 than in group I, followed by a slight increase from T1 to T2. These data indicate that maxillary setbacks resulted in a decrease in NP volume, but this change was not statistically significant. This finding is consistent with previous research published by Jang et al. (2018). The OP, HP, and total volume all showed similar decreasing trends immediately after surgery and improved in the long term. There was no significant decrease in the OP volume over time. However, both the HP and total volume drastically decreased during T0–T1, despite undergoing an adaptation; at the long-term follow-up, the volume was still significantly decreased compared to that in the preoperative state (T0–T2), which was different from the results in group I when unilateral mandibular setbacks were compared to maxillomandibular setbacks. Lee et al. (2013) reported that maxillomandibular setback resulted in a significant decrease in volume at all three pharyngeal airway levels. Nevertheless, there were no reports of postoperative obstructive sleep apnea (OSA) in any of the patients at the 6-month follow-up.
In group III, the NP volume increased from T0–T1 and decreased from T1–T2. The movement of the maxilla is connected to the nasopharynx through the muscles and ligaments of the soft palate and maxilla, which are connected to the upper region of the throat (Brunetto et al., 2014). Patients who undergo maxillary advancement have an increase in pharyngeal depth, resulting in the elongation of their soft palates. This elongation is a compensatory mechanism to close the velopharyngeal port and promote the expansion of the airway (Schendel et al., 1979; Hart et al., 2015; Rosário et al., 2016). However, no significant difference was detected. This might be because there was minor advancement of the maxilla in this study. Chang et al. (2015) reported that isolated maxillary advancement of more than 7 mm significantly increased the NP volume in the short and long term, with the largest expansion occurring immediately after surgery and decreasing over time but not returning to baseline. Surprisingly, in the current study, forward repositioning of the maxilla increased the OP and HP volumes only to a limited extent (Park et al., 2012; Chang et al., 2015). This might be due to differences in the surrounding tissue of the pharyngeal airway volume at each level. The NP is surrounded mainly by bone, which results in more significant alterations in volume due to maxillary movement. However, the OP and HP are encased in soft tissue, which can lead to minor volume fluctuations. This is due to the proximity of soft tissue, such as edema. Another hypothesis is that the surrounding muscle is of a different quality; however, the consequences are still uncertain. For the OP and HP, we found that the volume was also significantly reduced at T0–T1, which might be due to the effects of mandibular setback.
The regression model explained a statistically significant portion of the variance in airway changes in the isolated mandibular setback group. The R2 value of 0.37 for the oropharyngeal volume change (T0–T1) indicates that approximately 37% of the variability in the immediate postoperative volume change can be attributed to the amount of mandibular setback. Similarly, mandibular movement accounted for 22% of the variance in the total volume change. While these associations are significant, the R2 values suggest that other factors not included in the model, such as soft tissue adaptation and postoperative edema, account for a substantial portion of the remaining variance. Therefore, while the model is useful for quantifying the direct impact of skeletal movement, its standalone predictive accuracy is moderate, and it should be used as one of several tools in clinical assessment. We found no correlation between skeletal movements and the percentage of airway volume change in bimaxillary surgery groups II and III. Our results are similar to those of a previous study by Panou et al. (2013), who reported no correlation between jaw movement and airway volume change. In contrast, Brunetto et al. (2014) reported significant associations between maxillary movement and changes in upper airway volume, as well as between mandibular movement and changes in lower airway volume. There is evidence from numerous studies. An attempt was made to establish the correlation between jaw movements and changes in the pharyngeal airway. However, due to the complex and interconnected nature of the airway structure, which cannot be separated from its various activities, accurately predicting the outcome becomes challenging. Zhang et al. (2023) established a long-term correlation between maxillomandibular movement and changes in the pharyngeal airway. Specifically, they observed that only the antero-posterior movement of the mandible is associated with these changes. However, the vertical movements of the lower jaw and the forward–backward and up–down motions of the upper jaw did not have a substantial impact on the anatomy of the airway. This finding is consistent with our findings, which showed that mandibular setback significantly decreased the airway volume immediately after surgery.
This study has several strengths, including the use of 3D CBCT volumetric analysis, comparison across three surgical groups, assessment of both immediate and long-term outcomes, and high intra-examiner reliability. Nonetheless, limitations include the retrospective design, modest sample size from a single institution, a six-month follow-up that may not capture long-term adaptations, and the restriction to non-obese skeletal Class III patients, which limits generalizability. Clinically, the findings demonstrate that isolated mandibular setback is strongly associated with airway narrowing, with an immediate reduction of approximately 4% in oropharyngeal volume per millimeter of setback, underscoring the need for careful risk assessment in patients with narrow baseline airways or OSA susceptibility. Importantly, combining mandibular setback with maxillary advancement may mitigate this effect, and the regression models developed here provide a valuable tool to help clinicians anticipate postoperative airway changes and optimize treatment planning.
CONCLUSIONS
This study quantitatively analyzed pharyngeal airway changes in skeletal Class III patients undergoing three types of orthognathic surgery. Isolated mandibular setback produced significant immediate reductions in oropharyngeal and hypopharyngeal volumes, which partially recovered over time, while maxillomandibular setback caused more persistent airway narrowing. In contrast, mandibular setback with maxillary advancement showed less airway reduction, suggesting a protective effect of maxillary advancement. Regression analysis confirmed that the extent of mandibular setback was a significant predictor of immediate airway constriction. These findings emphasize the importance of considering bimaxillary surgery with maxillary advancement to mitigate postoperative airway compromise, particularly in patients with narrow baseline airways or OSA risk, and highlight the need for long-term follow-up studies to link volumetric changes with functional outcomes.
ACKNOWLEDGEMENTS
We would like to thank all staffs in department of oral and maxillofacial radiology that helps facilitate cone beam computed tomography imaging and submit the information for research.
AUTHOR CONTRIBUTIONS
Unthika Soodtoetong: data acquisition, statistical analysis, manuscript preparation, literature research.
Jira Kitisubkanchana: data acquisition, manuscript editing, literature research.
Natchalee Srimaneekarn: data acquisition, statistical analysis, data analysis.
Lukas Benedikt Seifert: definition of intellectual content, manuscript review.
Chakorn Vorakulpipat: Study concept, study design, definition of intellectual content, manuscript review, manuscript editing.
All authors reviewed and approved of the final manuscript.
CONFLICT OF INTEREST
The authors declare that they hold no competing interests.
REFERENCES
Alcalde, L.F.A., Faria, P.E.P., Nogueira, R.L.M., Chihara, L., and Sant'Ana, E. 2019. Computed tomography visualizing alterations in the upper airway after orthognathic surgery. Journal of Cranio-Maxillo-Facial Surgery. 47(7): 1041–1045. https://doi.org/10.1016/j.jcms.2019.04.006
Allwright, W.C. 1964. A survey of handicapping dentofacial anomalies among Chinese in Hong Kong. International Dental Journal. 14: 505-519.
Alves, M., Jr., Baratieri, C., Mattos, C.T., Brunetto, D., Fontes, R.daC., Santos, J.R., and Ruellas, A.C. 2012. Is the airway volume being correctly analyzed?. American Journal of Orthodontics and Dentofacial Orthopedics. 141(5): 657–661. https://doi.org/10.1016/j.ajodo.2011.11.019
Brunetto, D.P., Velasco, L., Koerich, L., and Araújo, M.T. 2014. Prediction of 3-dimensional pharyngeal airway changes after orthognathic surgery: A preliminary study. American Journal of Orthodontics and Dentofacial Orthopedics. 146(3): 299–309. https://doi.org/10.1016/j.ajodo.2014.05.024
Chang, M.K., Sears, C., Huang, J.C., Miller, A.J., Kushner, H.W., and Lee, J.S. 2015. Correlation of airway volume with orthognathic surgical movement using cone-beam computed tomography. Journal of Oral and Maxillofacial Surgery. 73(12 Suppl): S67–S76. https://doi.org/10.1016/j.joms.2015.09.002
Chen, F., Terada, K., Hanada, K., and Saito, I. 2005. Predicting the pharyngeal airway space after mandibular setback surgery. Journal of Oral and Maxillofacial Surgery. 63(10): 1509–1514. https://doi.org/10.1016/j.joms.2005.06.007
Chen, F., Terada, K., Hua, Y., and Saito, I. 2007. Effects of bimaxillary surgery and mandibular setback surgery on pharyngeal airway measurements in patients with Class III skeletal deformities. American Journal of Orthodontics and Dentofacial Orthopedics. 131(3): 372–377. https://doi.org/10.1016/j.ajodo.2005.06.028
Chen, C.M., Yu, T.Y., Chou, S.T., Cheng, J.H., Chen, S.C., Pan, C.Y., and Tseng, Y.C. 2021. Changes in tongue area, pharyngeal area, and pharyngeal airway velocity after correction of mandibular prognathism. Journal of Clinical Medicine. 10(19): 4560. https://doi.org/10.3390/jcm10194560
Choi, Y., Kim, Y.I., Kim, S.S., Park, S.B., Son, W.S., and Kim, S.H. 2020. Immediate effects of mandibular posterior displacement on the pharyngeal airway space: A preliminary study. Korean Journal of Orthodontics. 50(2): 129–135. https://doi.org/10.4041/kjod.2020.50.2.129
Cooke M.S. 1990. Five-year reproducibility of natural head posture: A longitudinal study. American Journal of Orthodontics and Dentofacial Orthopedics. 97(6): 489–494. https://doi.org/10.1016/S0889-5406(05)80029-0
El, H. and Palomo, J.M. 2010. Measuring the airway in 3 dimensions: A reliability and accuracy study. American Journal of Orthodontics and Dentofacial Orthopedics. 137(4 Suppl): S50.e1–S52. https://doi.org/10.1016/j.ajodo.2010.01.014
Emrich, R.E., Brodie, A.G., and Blayney, J.R. 1965. Prevalence of class 1, class 2, and class 3 malocclusions (Angle) in an urban population. An epidemiological study. Journal of Dental Research. 44(5): 947–953. https://doi.org/10.1177/00220345650440053301
Fernández-Ferrer, L., Montiel-Company, J.M., Pinho, T., Almerich-Silla, J.M., and Bellot-Arcís, C. 2015. Effects of mandibular setback surgery on upper airway dimensions and their influence on obstructive sleep apnoea - a systematic review. Journal of Cranio-Maxillo-Facial Surgery. 43(2): 248–253. https://doi.org/10.1016/j.jcms.2014.11.017
Greco, J.M., Frohberg, U., and Van Sickels, J.E. 1990. Long-term airway space changes after mandibular setback using bilateral sagittal split osteotomy. International Journal of Oral and Maxillofacial Surgery. 19(2): 103–105. https://doi.org/10.1016/s0901-5027(05)80204-8
Hart, P.S., McIntyre, B.P., Kadioglu, O., Currier, G.F., Sullivan, S.M., Li, J., and Shay, C. 2015. Postsurgical volumetric airway changes in 2-jaw orthognathic surgery patients. American Journal of Orthodontics and Dentofacial Orthopedics. 147(5): 536–546. https://doi.org/10.1016/j.ajodo.2014.12.023
Hochban, W., Schürmann, R., Brandenburg, U., and Conradt, R. 1996. Mandibular setback for surgical correction of mandibular hyperplasia─does it provoke sleep-related breathing disorders?. International Journal of Oral and Maxillofacial Surgery. 25(5): 333–338. https://doi.org/10.1016/s0901-5027(06)80024-x
Jakobsone, G., Neimane, L., and Krumina, G. 2010. Two- and three-dimensional evaluation of the upper airway after bimaxillary correction of Class III malocclusion. Oral Surgery, Oral Medicine, Oral Pathology, Oral Radiology, and Endodontics. 110(2): 234–242. https://doi.org/10.1016/j.tripleo.2010.03.026
Jang, S.I., Ahn, J., Paeng, J.Y., and Hong, J. 2018. Three-dimensional analysis of changes in airway space after bimaxillary orthognathic surgery with maxillomandibular setback and their association with obstructive sleep apnea. Maxillofacial Plastic and Reconstructive Surgery. 40(1): 33. https://doi.org/10.1186/s40902-018-0171-3
Kawakami, M., Yamamoto, K., Fujimoto, M., Ohgi, K., Inoue, M., and Kirita, T. 2005. Changes in tongue and hyoid positions, and posterior airway space following mandibular setback surgery. Journal of Cranio-Maxillo-Facial Surgery. 33(2): 107–110. https://doi.org/10.1016/j.jcms.2004.10.005
Khaghaninejad, M.S., Khojastehpour, L., Danesteh, H., Changizi, M., and Ahrari, F. 2022. Changes in the pharyngeal airway after different orthognathic procedures for correction of class III dysplasia. Maxillofacial Plastic and Reconstructive Surgery. 44(1): 23. https://doi.org/10.1186/s40902-022-00352-8
Lee, J.Y., Kim, Y.I., Hwang, D.S., and Park, S.B. 2013. Effect of maxillary setback movement on upper airway in patients with class III skeletal deformities: Cone beam computed tomographic evaluation. The Journal of Craniofacial Surgery. 24(2): 387–391. https://doi.org/10.1097/SCS.0b013e31827fef0f
Lee, Y., Chun, Y.S., Kang, N., and Kim, M. 2012. Volumetric changes in the upper airway after bimaxillary surgery for skeletal class III malocclusions: A case series study using 3-dimensional cone-beam computed tomography. Journal of Oral and Maxillofacial Surgery. 70(12): 2867–2875. https://doi.org/10.1016/j.joms.2012.03.007
Mattos, C.T., Vilani, G.N., Sant'Anna, E.F., Ruellas, A.C., and Maia, L.C. 2011. Effects of orthognathic surgery on oropharyngeal airway: A meta-analysis. International Journal of Oral and Maxillofacial Surgery. 40(12): 1347–1356. https://doi.org/10.1016/j.ijom.2011.06.020
Muto, T., Yamazaki, A., Takeda, S., and Sato, Y. 2008. Accuracy of predicting the pharyngeal airway space on the cephalogram after mandibular setback surgery. Journal of Oral and Maxillofacial Surgery. 66(6): 1099–1103. https://doi.org/10.1016/j.joms.2008.01.003
Panou, E., Motro, M., Ateş, M., Acar, A., and Erverdi, N. 2013. Dimensional changes of maxillary sinuses and pharyngeal airway in Class III patients undergoing bimaxillary orthognathic surgery. The Angle Orthodontist. 83(5): 824–831. https://doi.org/10.2319/100212-777.1
Park, S.B., Kim, Y.I., Son, W.S., Hwang, D.S., and Cho, B.H. 2012. Cone-beam computed tomography evaluation of short- and long-term airway change and stability after orthognathic surgery in patients with Class III skeletal deformities: Bimaxillary surgery and mandibular setback surgery. International Journal of Oral and Maxillofacial Surgery. 41(1): 87–93. https://doi.org/10.1016/j.ijom.2011.09.008
Rosário, H.D., de Oliveira, B.G., Pompeo, D.D., de Freitas, P.H., and Paranhos, L.R. 2016. Surgical maxillary advancement increases upper airway volume in skeletal class III patients: A cone beam computed tomography-based study. Journal of Clinical Sleep Medicine. 12(11): 1527–1533. https://doi.org/10.5664/jcsm.6282
Sahoo, N.K., Agarwal, S.S., Datana, S., and Bhandari, S.K. 2021. Quantifying Upper Airway Changes Following Mandibular Orthognathic Surgery. The Journal of Craniofacial Surgery. 32(2): 569–573. https://doi.org/10.1097/SCS.0000000000007011
Saitoh K. 2004. Long-term changes in pharyngeal airway morphology after mandibular setback surgery. American Journal of Orthodontics and Dentofacial Orthopedics. 125(5): 556–561. https://doi.org/10.1016/j.ajodo.2003.04.017
Schendel, S.A., Oeschlaeger, M., Wolford, L.M., and Epker, B.N. 1979. Velopharyngeal anatomy and maxillary advancement. Journal of Maxillofacial Surgery. 7(2): 116–124. https://doi.org/10.1016/s0301-0503(79)80023-5
Solow, B. and Sandham, A. 2002. Cranio-cervical posture: A factor in the development and function of the dentofacial structures. European Journal of Orthodontics. 24(5): 447–456. https://doi.org/10.1093/ejo/24.5.447
Weissheimer, A., Menezes, L.M., Sameshima, G.T., Enciso, R., Pham, J., and Grauer, D. 2012. Imaging software accuracy for 3-dimensional analysis of the upper airway. American Journal of Orthodontics and Dentofacial Orthopedics. 142(6): 801–813. https://doi.org/10.1016/j.ajodo.2012.07.015
Zhang, Z., Wang, S., Li, J., Yang, Z., Zhang, X., and Bai, X. 2023. Quantification of pharyngeal airway space changes after two-jaw orthognathic surgery in skeletal class III patients. BMC Oral Health. 23(1): 345. https://doi.org/10.1186/s12903-023-03075-y
OPEN access freely available online
Natural and Life Sciences Communications
Chiang Mai University, Thailand. https://cmuj.cmu.ac.th
Unthika Soodtoetong1, Jira Kitisubkanchana2, Natchalee Srimaneekarn3, Lukas Benedikt Seifert4, and Chakorn Vorakulpipat1, *
1 Department of Oral and Maxillofacial Surgery, Faculty of Dentistry, Mahidol University, Bangkok 10400, Thailand.
2 Department of Oral and Maxillofacial Radiology, Faculty of Dentistry, Mahidol University, Bangkok 10400, Thailand.
3 Department of Anatomy, Faculty of Dentistry, Mahidol University, Bangkok 10400, Thailand.
4 Department of Oral and Maxillofacial Surgery, University Hospital Basel, CH-4031 Basel, Switzerland.
Corresponding author: Chakorn Vorakulpipat, E-mail: chakorn.vor@mahidol.ac.th
ORCID iD:
Chakorn Vorakulpipat: https://orcid.org/0000-0001-6627-8732
Unthika Soodtoetong: https://orcid.org/0009-0008-3817-2226
Jira Kitisubkanchana: https://orcid.org/0000-0003-0020-863X
Natchalee Srimaneekarn: https://orcid.org/0000-0001-7454-1860
Total Article Views
Editor: Anak Iamaroon,
Chiang Mai University, Thailand
Article history:
Received: March 20, 2025;
Revised: August 30, 2025;
Accepted: September 22, 2025;
Online First: October 3, 2025