 ISSN: 2822-0838 Online

The Benefits of Biochar on Rice Growth and Yield in Tropical Riparian Wetland, South Sumatra, Indonesia
Benyamin Lakitan*, Andri Alberto, Lindi Lindiana, Kartika Kartika, Siti Herlinda, and Astuti KurnianingsihPublished Date : 2018-04-01
DOI : https://doi.org/10.12982/CMUJNS.2018.0009
Journal Issues : Number 2 , April-June 2018
ABSTRACT
Biochar improves soil quality. However, most biochar research has focused on aerobic soil conditions. The objective of this research was to evaluate the agronomic benefits of applying biochar on unfertilized rice crop, cultivated under transitional anaerobic soil conditions during early vegetative growth phase, and gradually drying out to fully aerobic at harvest time. This transitional condition is typical during the rice growing season of the tropical riparian wetlands in Indonesia. Biochar was applied in the form of fine powder at rates of 0, 0.4, 0.8, and 1.2 Mg.ha-1; no inorganic fertilizer was applied. The research was conducted on a farmer’s paddy field at Pemulutan Ulu Village, South Sumatra, Indonesia from July to November 2016. Results indicated that applying biochar at rates up to 1.2 Mg.ha-1 increased rice yield, but restrained shoot elongation rate and plant height. During the vegetative growth phase, applying biochar significantly increased the number of tillers, leaves, shoot dry weight, and root dry weight. Biochar significantly affected the following yield components: number of tillers, percentage of productive tiller, number of grains per panicle, panicle density, percentage of filled grain, and weight of 1,000 grains.
Keywords: Biochar, Rice, Soil quality, Anaerobic, Tropical climate, Riparian wetland
INTRODUCTION
Although biochar has been used for centuries to increase crop yields, interest in biochar has increased recently, particularly for its environmental, or carbon sequestration benefits. Recent research has identified several environmental and agricultural benefits of applying biochar, including carbon sequestration for reducing carbon emission into the atmosphere (Mašek et al., 2013; Mukherjee and Lal, 2013; Zhang and Ok, 2014; Jiang et al., 2016; Wang et al., 2016); phytoremediation of soil contaminants (Ahmad et al., 2014; Mohan et al., 2014; Wiszniewska et al., 2016); adjusting soil physicochemical and biochemical properties for agriculture (Herath et al., 2013; Githinji, 2014; Bai et al., 2015; Abujabhah et al., 2016; Bera et al., 2016; Haider et al., 2017); creating soil health by inducing growth of beneficial and suppressing pathogenic organisms (Lone et al., 2015; Abujabhah et al., 2016; George et al., 2016; Xu et al., 2016); and improving crop growth and yield (Vaccari et al., 2015; Agegnehu et al., 2016).
Although the environmental benefits of applying biochar have been widely recognized, its effects in agriculture have been inconsistent and sometimes controversial. There are many sources for such inconsistency. Biochar can be produced using a wide variety of feedstock, processed at different pyrolysis temperatures, applied at different particle sizes and rates, and time of application relative to stages of crop growth and development. Different crops may also respond differently to biochar application.
Researchers have reported different effects. For instance, biochar produced at different temperatures varied in their effect on N uptake by Eruca sativa (Zhou et al., 2017) and on growth of lettuce (Hunter et al., 2017). High temperature during pyrolysis increased stability of biochar in soil (Mašek et al., 2013), but had short-lived effects on crop yields (Hall and Bell, 2015; Griffin et al., 2017). Moreover, Hagner et al. (2016) reported that pyrolysis temperature only marginally influenced biochar-induced effects on soil pH, water holding capacity (WHC), soil organisms, and plant growth. Finer particle size of biochar increased soil enzyme activity (Liang et al., 2016). Biochar applied at a rate of 2% by mass promoted lettuce growth (Hunter et al., 2017).
While many researchers have studied the effects of biochar on the chemical and biological properties of soil, fewer studies have investigated its effects on crop growth and yield. Our particular interest is to study whether biochar can improve farming in the riparian wetlands of Indonesia. Riparian wetlands in Indonesia are characterized by long-term flooding during the rainy season and gradual drying out entering into the dry season. Currently, farmers in the riparian wetlands of South Sumatra, Indonesia only grow one rice crop per year, with productivity well below the national average (Kartika et al., 2018). Our previous study showed that low cropping intensity was rooted in unpredictable and uncontrollable flooding (Lakitan et al., 2018). Local farmers transplant rice seedlings (at about 20 cm tall and 3 weeks old) when the floodwater in the paddy fields subsides to a depth of less than 15 cm, with the soil under anaerobic conditions. At harvest, the soil in the paddy fields has dried out, and are under fully aerobic conditions. Therefore, farming these riparian wetlands involves a gradual transition in the soil from anaerobic to aerobic over the course of the rice growing season.
Very little is known about the effects of biochar on crop growth and yield under such transitional anaerobic-aerobic conditions as is found in the riparian wetlands of Indonesia. To address this, our research investigated the benefits of biochar application on growth and yield of rice cultivated during the anaerobic-aerobic transition of soils in the tropical riparian wetlands of South Sumatra, Indonesia.
MATERIALS AND METHODS
This research was conducted on a farmer’s paddy field at Pemulutan Ulu Village (3°06’34.6”S, 104°45’58.3”E), South Sumatra, Indonesia. Soil characteristics prior to biochar application were: pH 4.23 (acidic); C-organic 21.47 g.kg-1; total N 1.57 g.kg-1; available-P 61.65 mg.l-1; and K, Na, Ca, Mg, Al, and CEC 0.38, 2.16, 2.38, 0.45, 2.16, and 26.10 cmol. kg-1, respectively.
Biochar was applied to the paddy fields one week before transplanting. Four rates of biochar were applied on four plots separated by embankments, to prevent lateral movement of the applied biochar, under flooded paddy field condition. The biochar was wood biochar; it was applied at 0.4 Mg.ha-1 (B04), 0.8 Mg.ha-1 (B08), and 1.2 Mg.ha-1 (B12) in the form of fine powder, sieved with a 1-mm screen. Biochar was not applied to one plot (0 Mg.ha-1) as the control (B00). Following application, the biochar was mixed into the submerged soil using a hand tractor until no trace of biochar remained floating on the water surface. During biochar mixing, the depth of the floodwater was 20 ± 5 cm. Biochar mixing also served to level the paddy field surface of each plot.
The plots were constructed as long strips. The long strips were sectioned into seven blocks to separate the non-treatment effects due to anticipated heterogeneous soil condition and aerial spaces surround the plots. Each experimental unit consisted of a 11 m x 25 m plot. Parameter data were analyzed based on the Strip Block Design. As biochar application rates increased, the trends of the selected parameters were evaluated using best-fitted regression. Correlations among parameters were also evaluated.
Rice used was Ciherang variety. Seeds for seedling preparation were sown on seedbed, layered with 3-cm thick nursery media (biochar produced from empty oilpalm fruit bunch was mixed with soil and sand at a ratio of 2:1:1 v/v/v), placed on top of a perforated polyethylene sheet such that excess water could pass through the sheet. Seeds were spread evenly on the surface of the media, pressed down gently into the mixed media, then covered with a thin layer of the same media, and finally covered with another polyethylene sheet; they remained like this for a week. This rice seedling preparation procedure is known as samir system by local farmers.
Seeds were sown on June 3, 2016, at which time it was expected that the floodwater would subside within 2-3 weeks at the latest. However, when the seedlings were two weeks old, the floodwater in the paddy field was still too deep for transplanting. Therefore, the seedlings were divided into clumps and temporarily transferred to a shallow part of the paddy field to provide more space for the seedlings to grow, while waiting for the floodwater to subside to a level that was technically feasible for transplanting the seedlings into the paddy field. The floodwater subsided enough to transplant the seedlings at four weeks after sowing (or two weeks after they had been temporarily transferred).
Before transplanting, the soil was ploughed again. No inorganic fertilizer was applied. Local farmers transplanted the seedlings using a traditional tool called tunjem for pushing seedling roots into soft muddy soil at the paddy field. Distance between seedlings was 25 cm x 25 cm, as commonly practiced by local farmers. Crop growth during vegetative phase was measured weekly from the third to the seventh week after transplanting. We assumed the intensity of the green color in leaves indicated a leaf’s health, as this has been positively associated with chlorophyll and nitrogen content. The intensity of green color in leaves was measured using a chlorophyll meter (Konica Minolta, Chlorophyll Meter, SPAD-502Plus). Based on SPAD value, chlorophyll and nitrogen contents were calculated according to Rodrigues and Miller (2000).
Two massive destructive measurements were conducted: 1) at the end of the vegetative growth phase, entering the booting period before panicle emergence and 2) at harvest. The vegetative growth parameters measured were crop height, number of tillers per hill, number of leaf, shoot dry weight, and root dry weight. Measurements at time of harvest focused on yield component parameters, and included number of tillers per hill, percentage of productive tillers, length of panicle, grains per panicle, panicle density, percentage of filled grains, and weight of 1000 grains.
Yield was calculated based on rice population per hectare, number of panicle per hill, grains per panicle, weight of 1000 grains, assumption that 10 percent of paddy field is used for non-cultivation purposes, and conversion of grain moisture content at harvest (22.8 percent) to grain moisture content at storage (12 percent).
RESULTS
Growth at vegetative phase
Crop growth was non-destructively measured during vegetative phase, starting from the third week after transplanting and terminating in the seventh week, as soon as booting stage was detectable. Increase in crop height had slowed down at the seventh week and the fastest shoot elongation rate was observed during the third to fourth week (Figure 1).
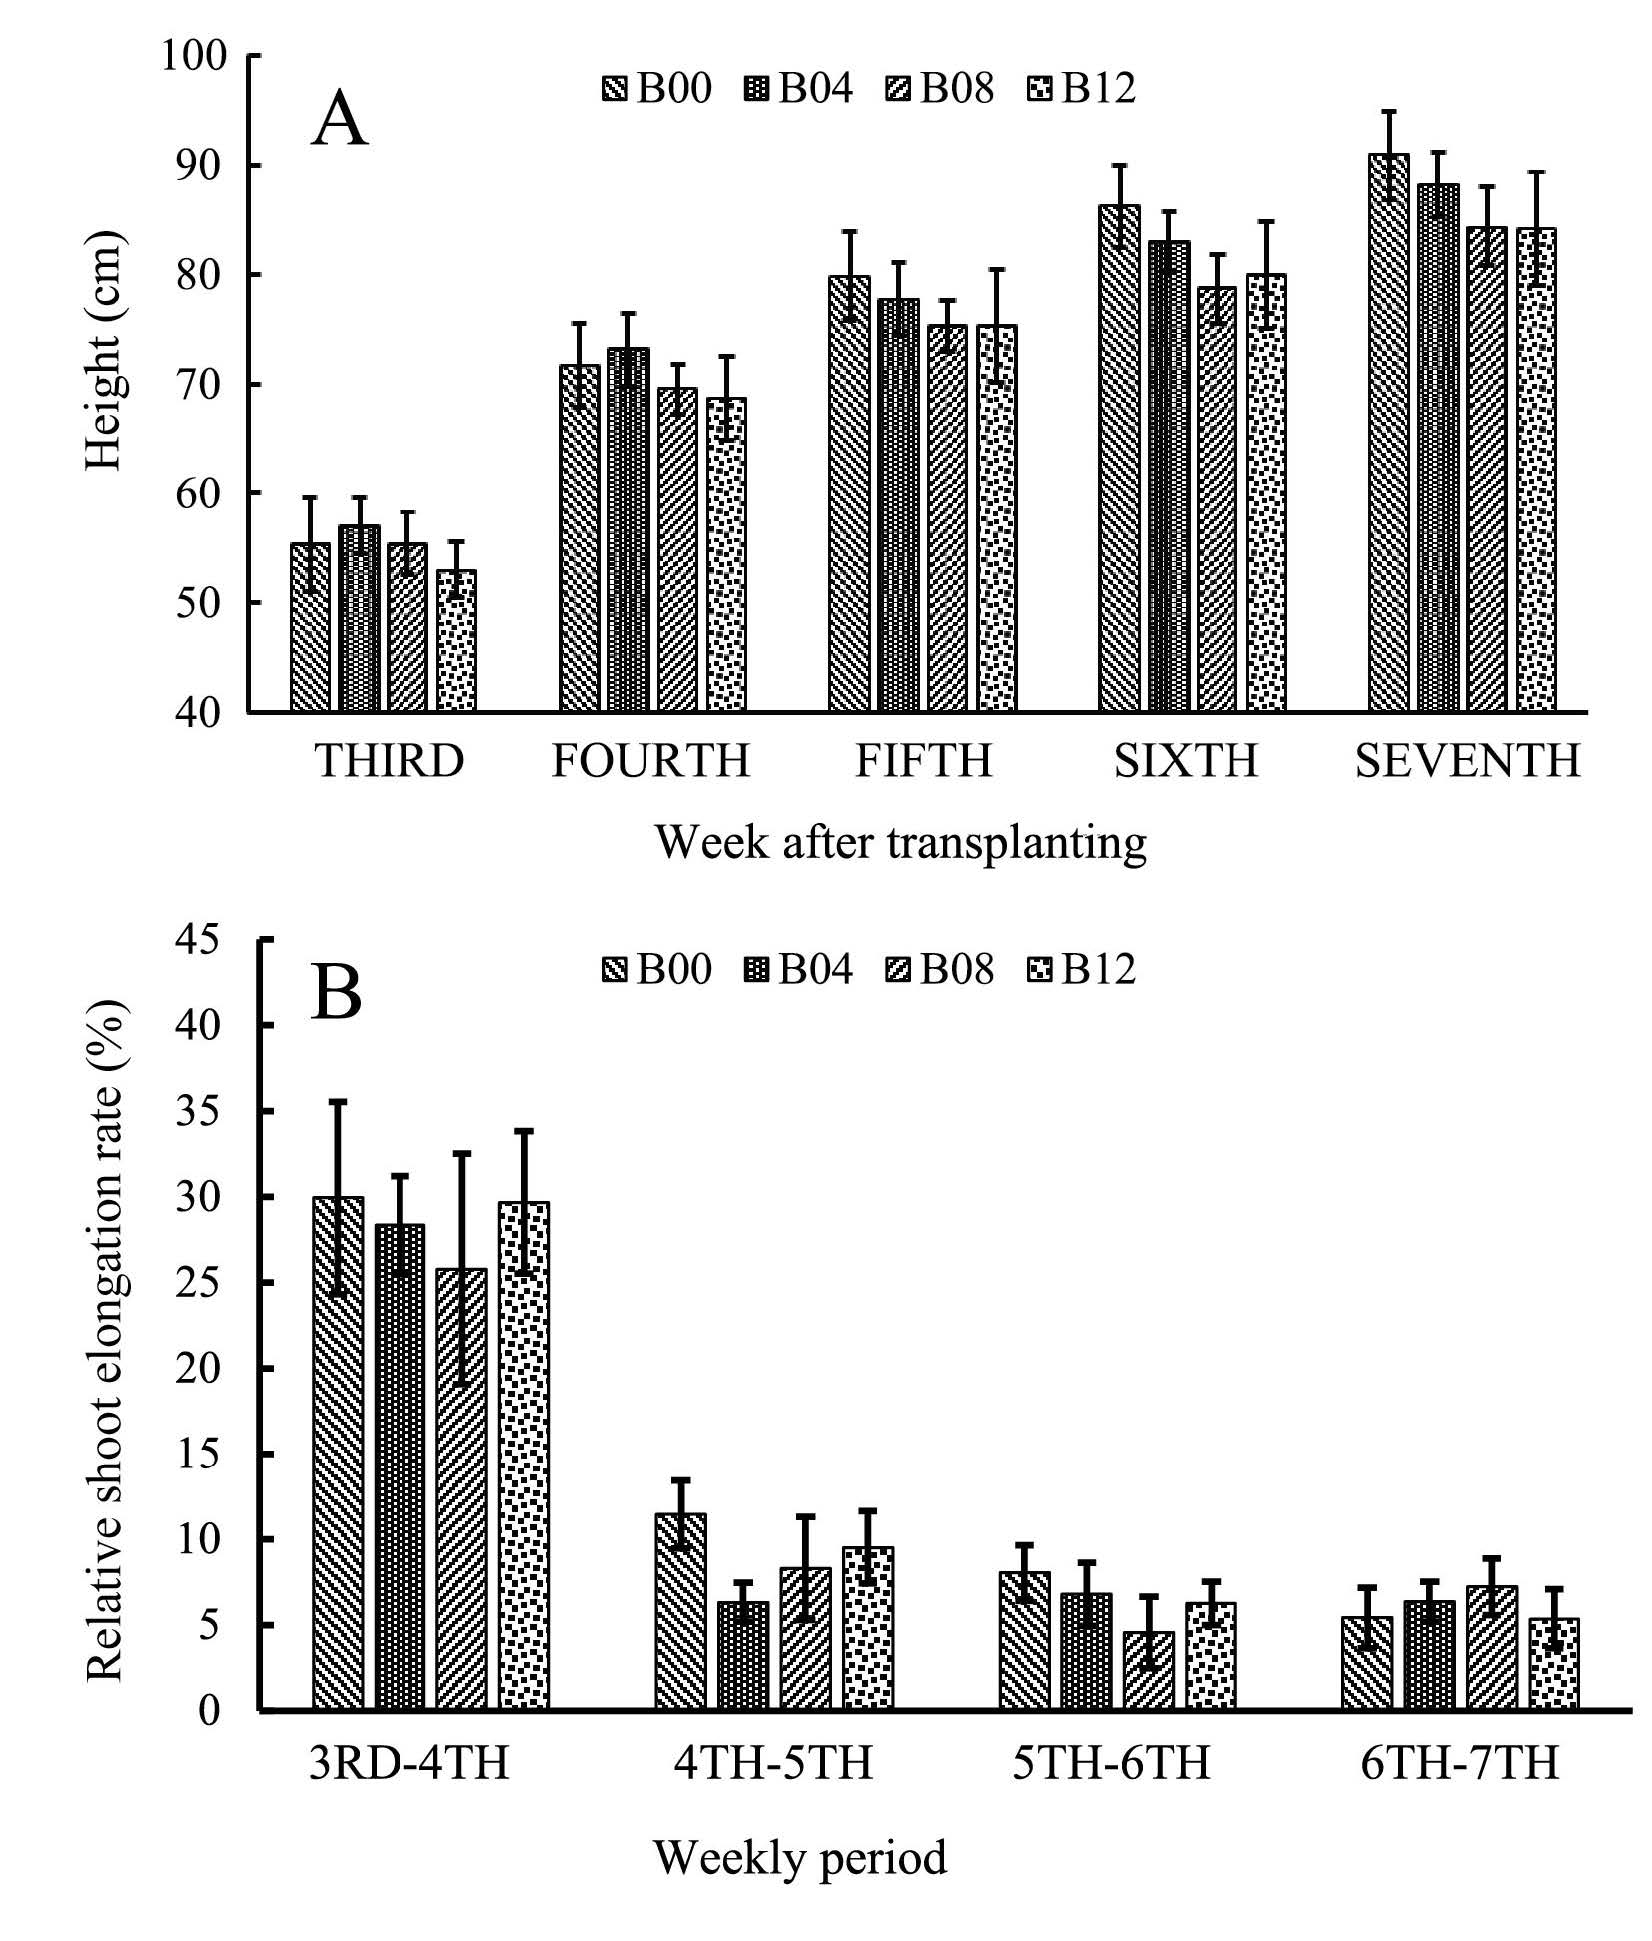
Figure 1. Crop height (A) and relative shoot elongation rate (B) during vegetative growth phase in rice treated with different rates of biochar.
Destructive measurements for vegetative growth parameters as affected by biochar were conducted at the end of the vegetative growth phase (seven weeks after transplanting), as soon as bulging of the leaf stem that concealed the developing panicle was noticeable. Significant effects of biochar were observed on number of tillers per hill, number of leaves, shoot dry weight, and root dry weight. Biochar application also significantly increased yield components, including number of tillers, percentage of productive tiller, length of panicle, number of grains per panicle, panicle density, percentage of filled grain, and weight of 1,000 grains (Table 1).
Table 1. Calculated F-value for biochar application on selected growth and yield parameters in rice grown without inorganic fertilizer on riparian wetland in South Sumatera, Indonesia.
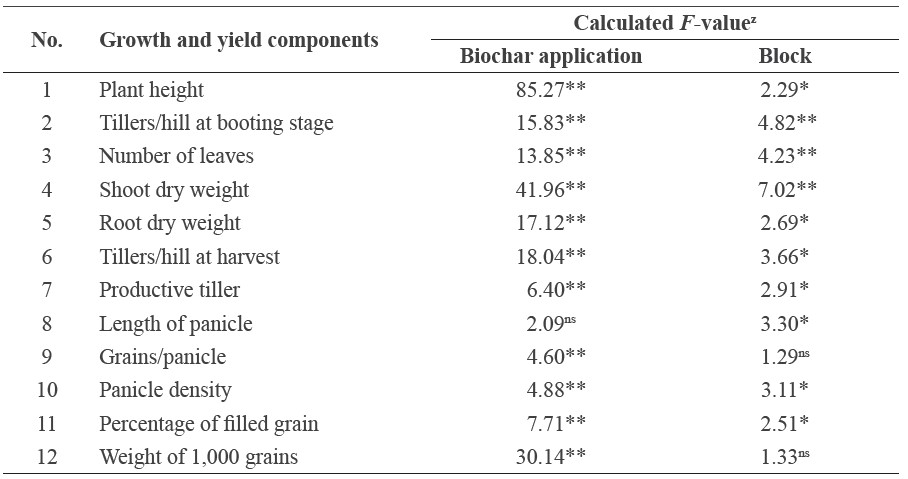
Note: ns, *, and ** were not significant, significant at P=0.05, and significant at P=0.01, respectively. F-table 0.05 = 2.51 and F-table 0.01 = 3.67
The SPAD values gradually decreased across all levels of biochar treatments, including control treatment without biochar, as the rice crop grew from the third to seventh week. Interesting to note, the higher rate of biochar application increased SPAD values during the early vegetative growth stage (week 3 to 5), but sharply declined during the late vegetative growth stage (week 5 to 7) (Figure 2). SPAD value correlated with chlorophyll and nitrogen contents (Table 2).
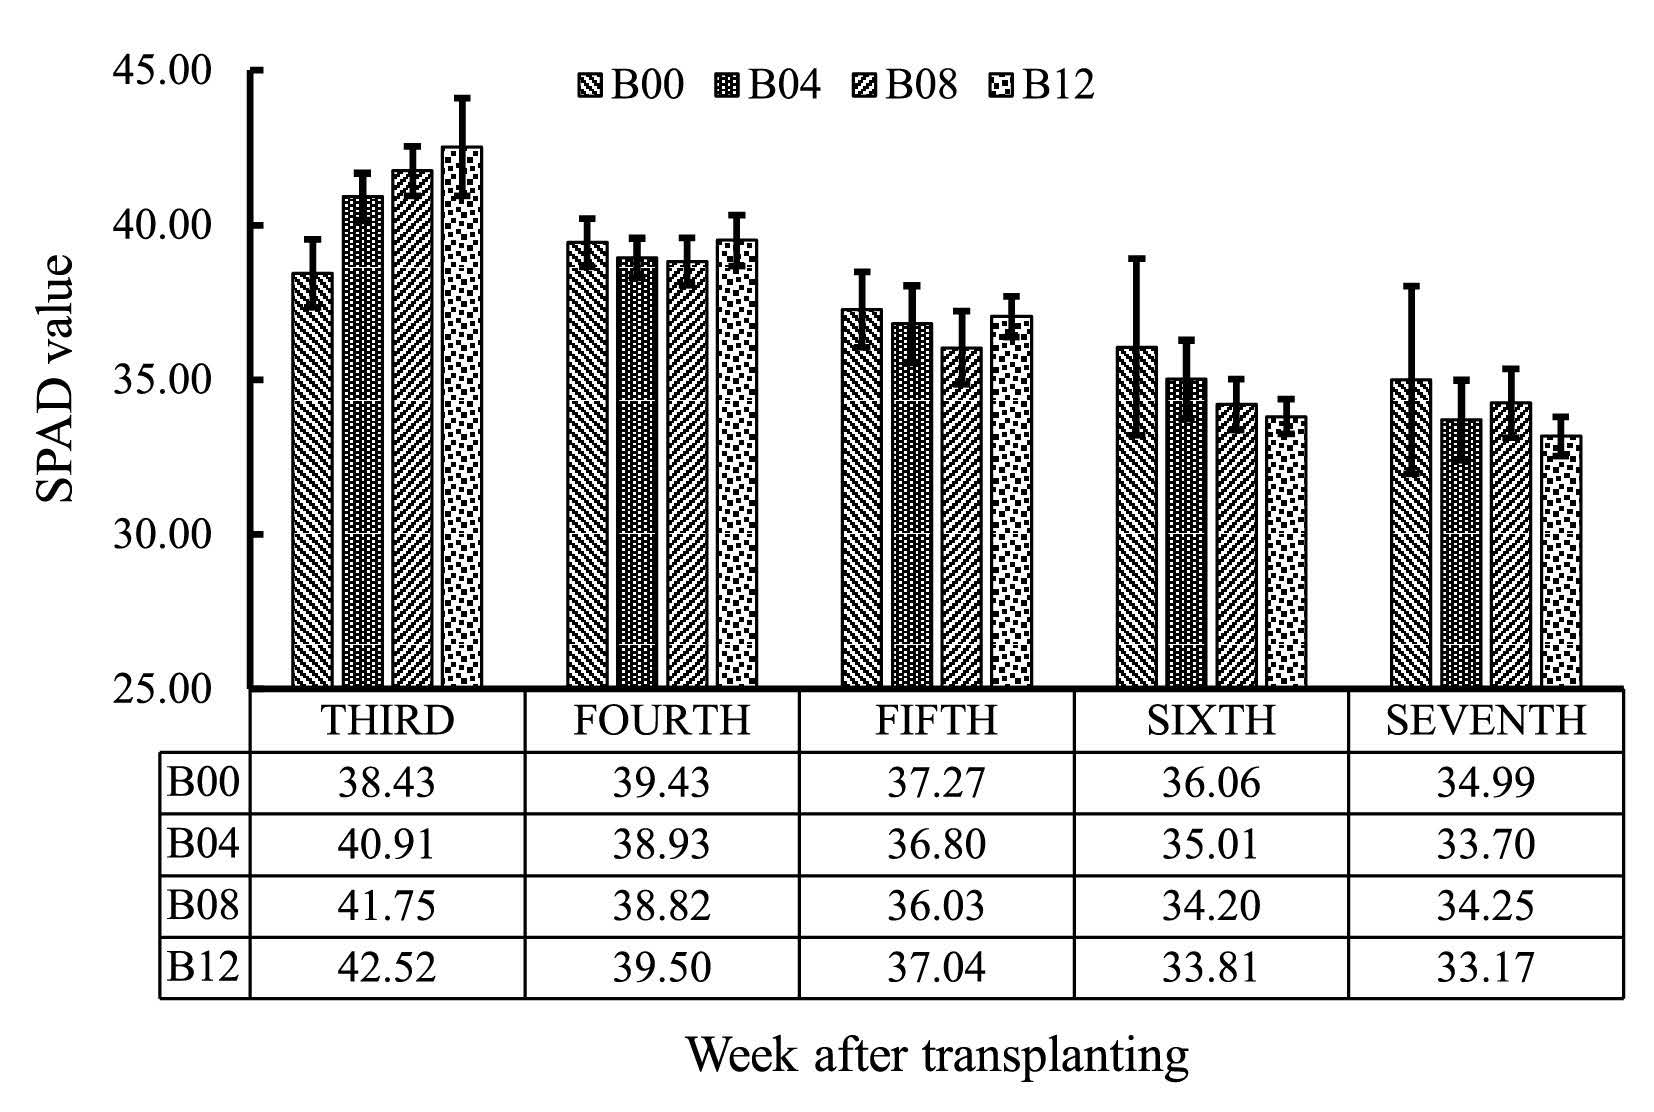
Figure 2. Declining SPAD value during vegetative growth phase of rice cultivated on tropical riparian wetland.
Table 2. Chlorophyll and nitrogen content during vegetative growth phase in rice treated with different rates of biochar application.
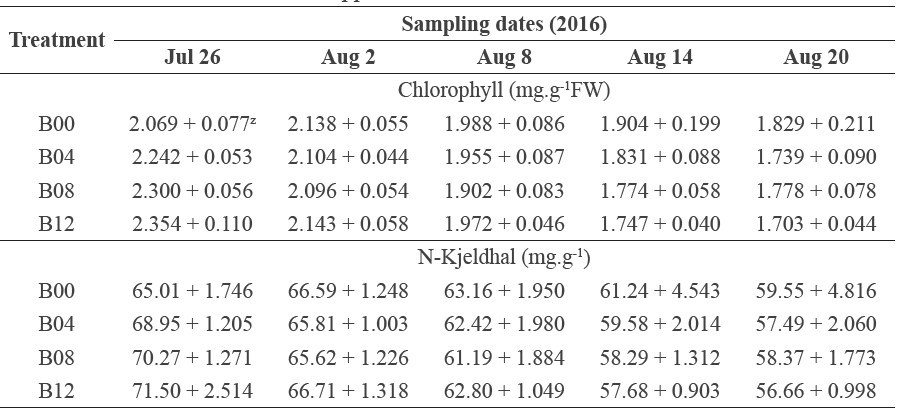
Note: Z Mean ± Standard deviation.
Reproductive growth stage and yield components
Biochar application at rates up to 1.2 Mg.ha-1 significantly affected number of tillers per hill at harvest, number of productive tillers per hill, number of grains per panicle, and weight of 1,000 grains. However, biochar application did not affect length of panicle (Table 1), implying it was more likely genetically controlled in the Ciherang rice variety used in this study.
The number of tillers and number of panicles per hill were strongly correlated. Tillers that produced panicles are defined as productive tillers. Using zero-intercept linear regression, the slope represents percentage of productive tillers (Figure 3). The regression approach revealed a significant finding that productive tillers in untreated plants were much lower (67.3%) than those in biochar treated plants (92.2%, 91.2%, and 90.9% for B04, B08, and B12, respectively).
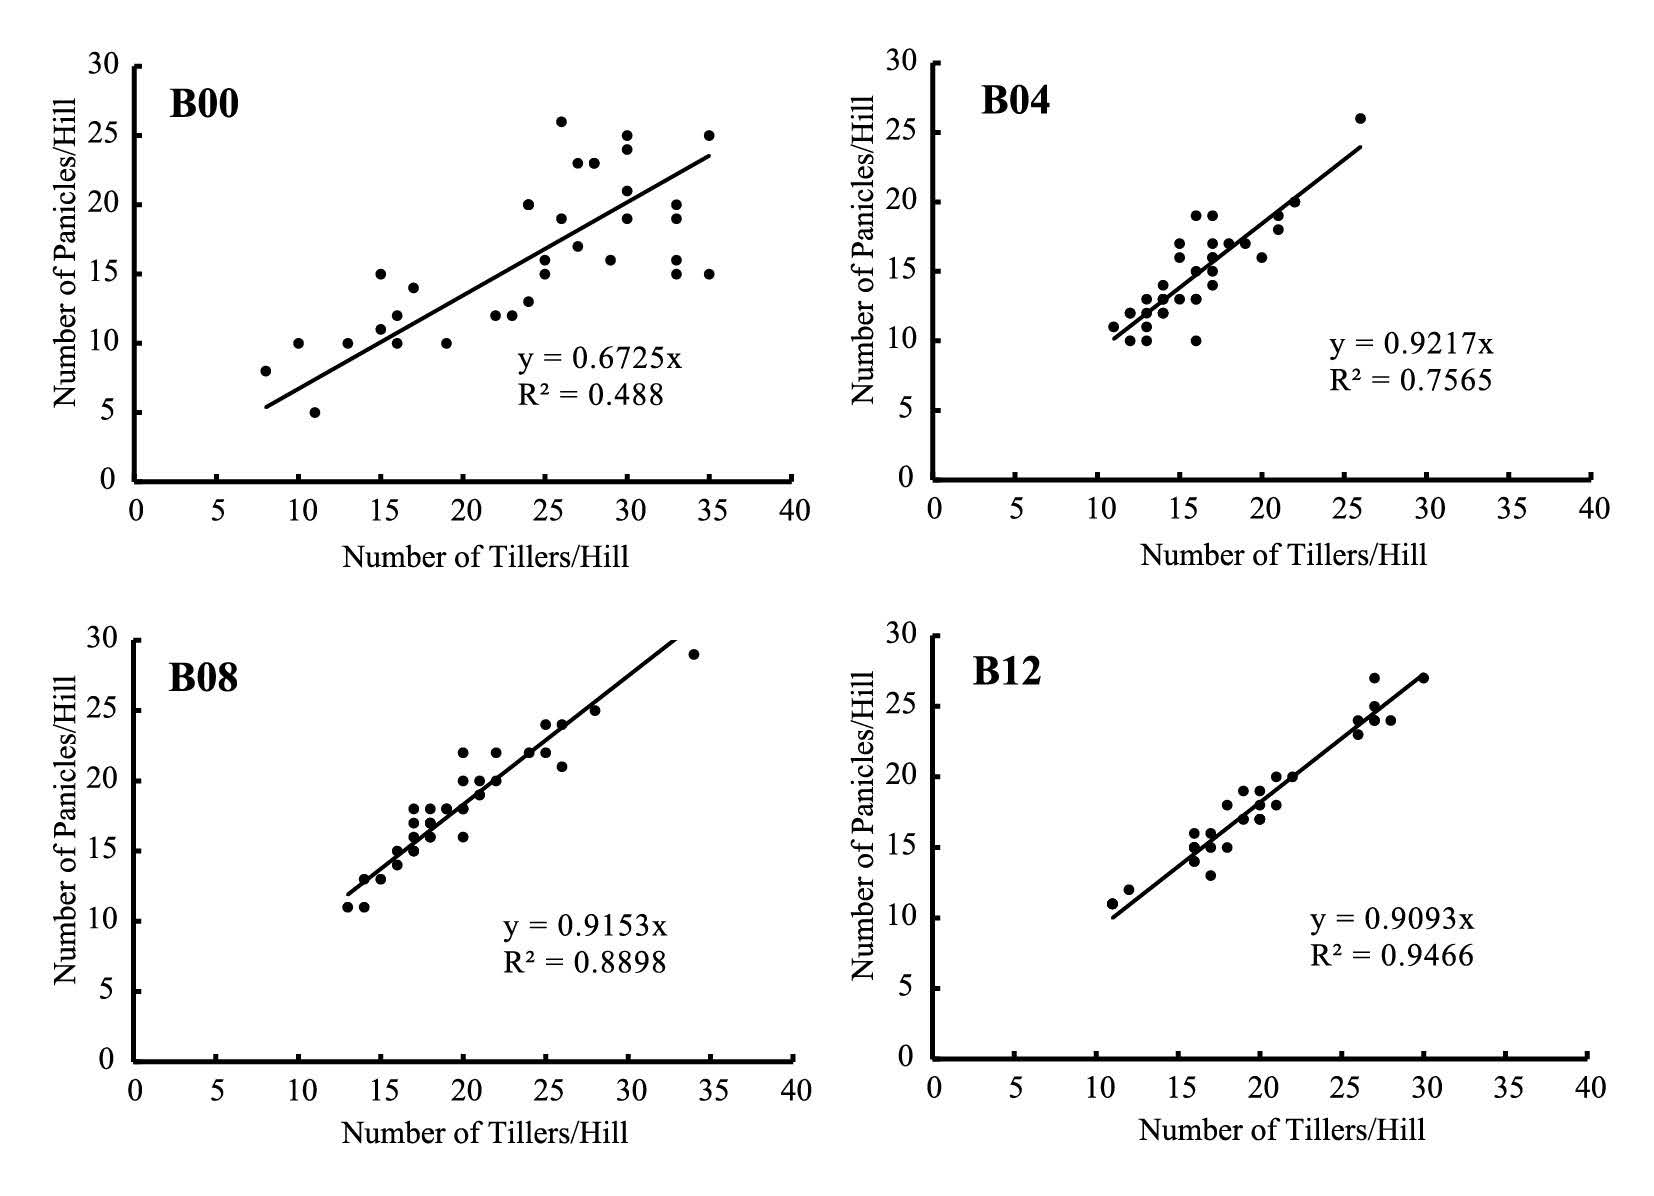
Figure 3. Correlation between number of tillers and number of panicles for each rate of biochar application in rice cultivated on tropical riparian wetland.
There was no correlation between number of panicles per hill and number of grains per panicle. However, biochar-treated plants exhibited different yield components that drove grain yield increase: number of grains per panicle for B04 (60.0%), number of panicles per hill and grains per panicle for B08 (65.7% and 54.3%, respectively), and number of panicle per hill for B12 (57.1%) (Figure 4).
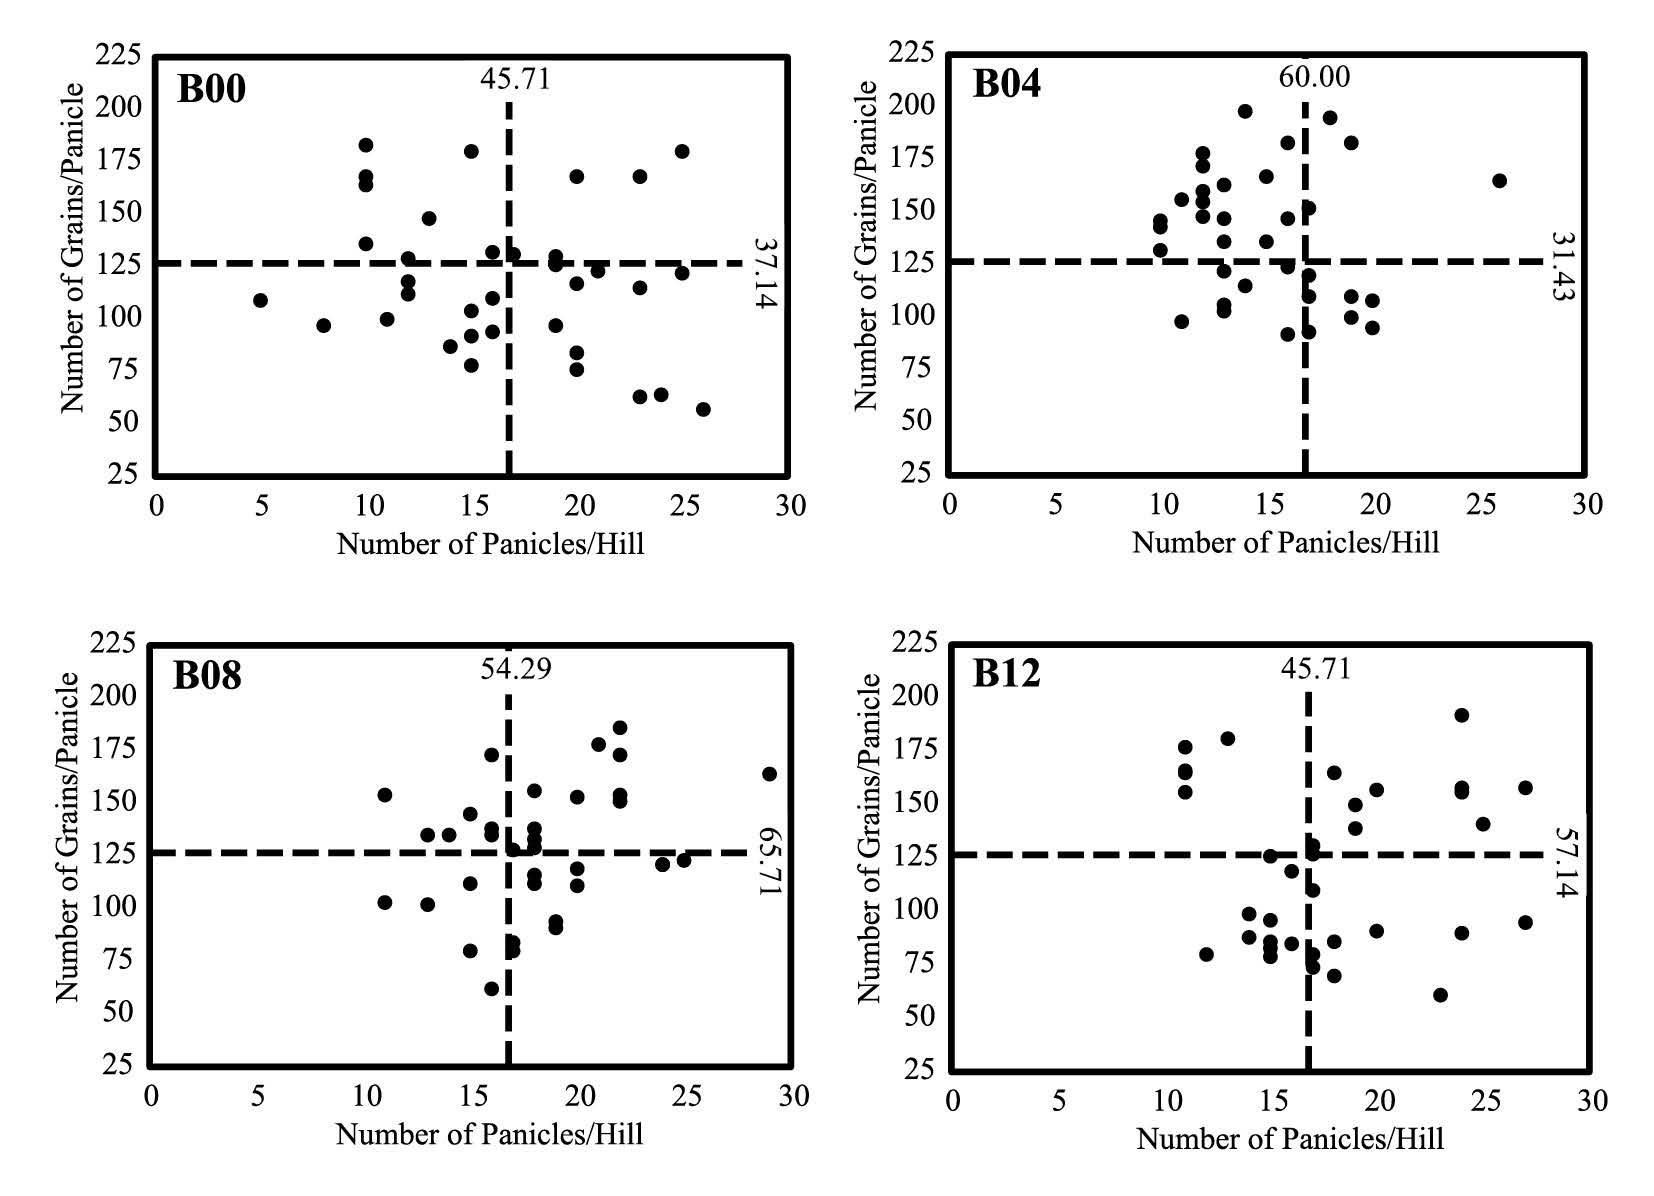
Figure 4. Scattered distribution of correlation points between number of panicles per hill and number of grains per panicle. Horizontal broken line is the average for number of grains per panicle. Vertical broken line is the average for number of panicles per hill.
Percentage of filled grains per panicle can be measured based on the slope of zerointercept linear regression between number of grains per panicle and number of filled grains per panicle (Figure 5). Rice plants treated with biochar at rate of 0.4 Mg.ha-1 (B04) exhibited the lowest percentage (85.6%). Other treatments were relatively similar at 91.3%, 90.5%, and 90.5% for B00, B08, and B12, respectively. Application of biochar at the rate of 0.4 Mg/ha-1 decreased percentage of filled grains.
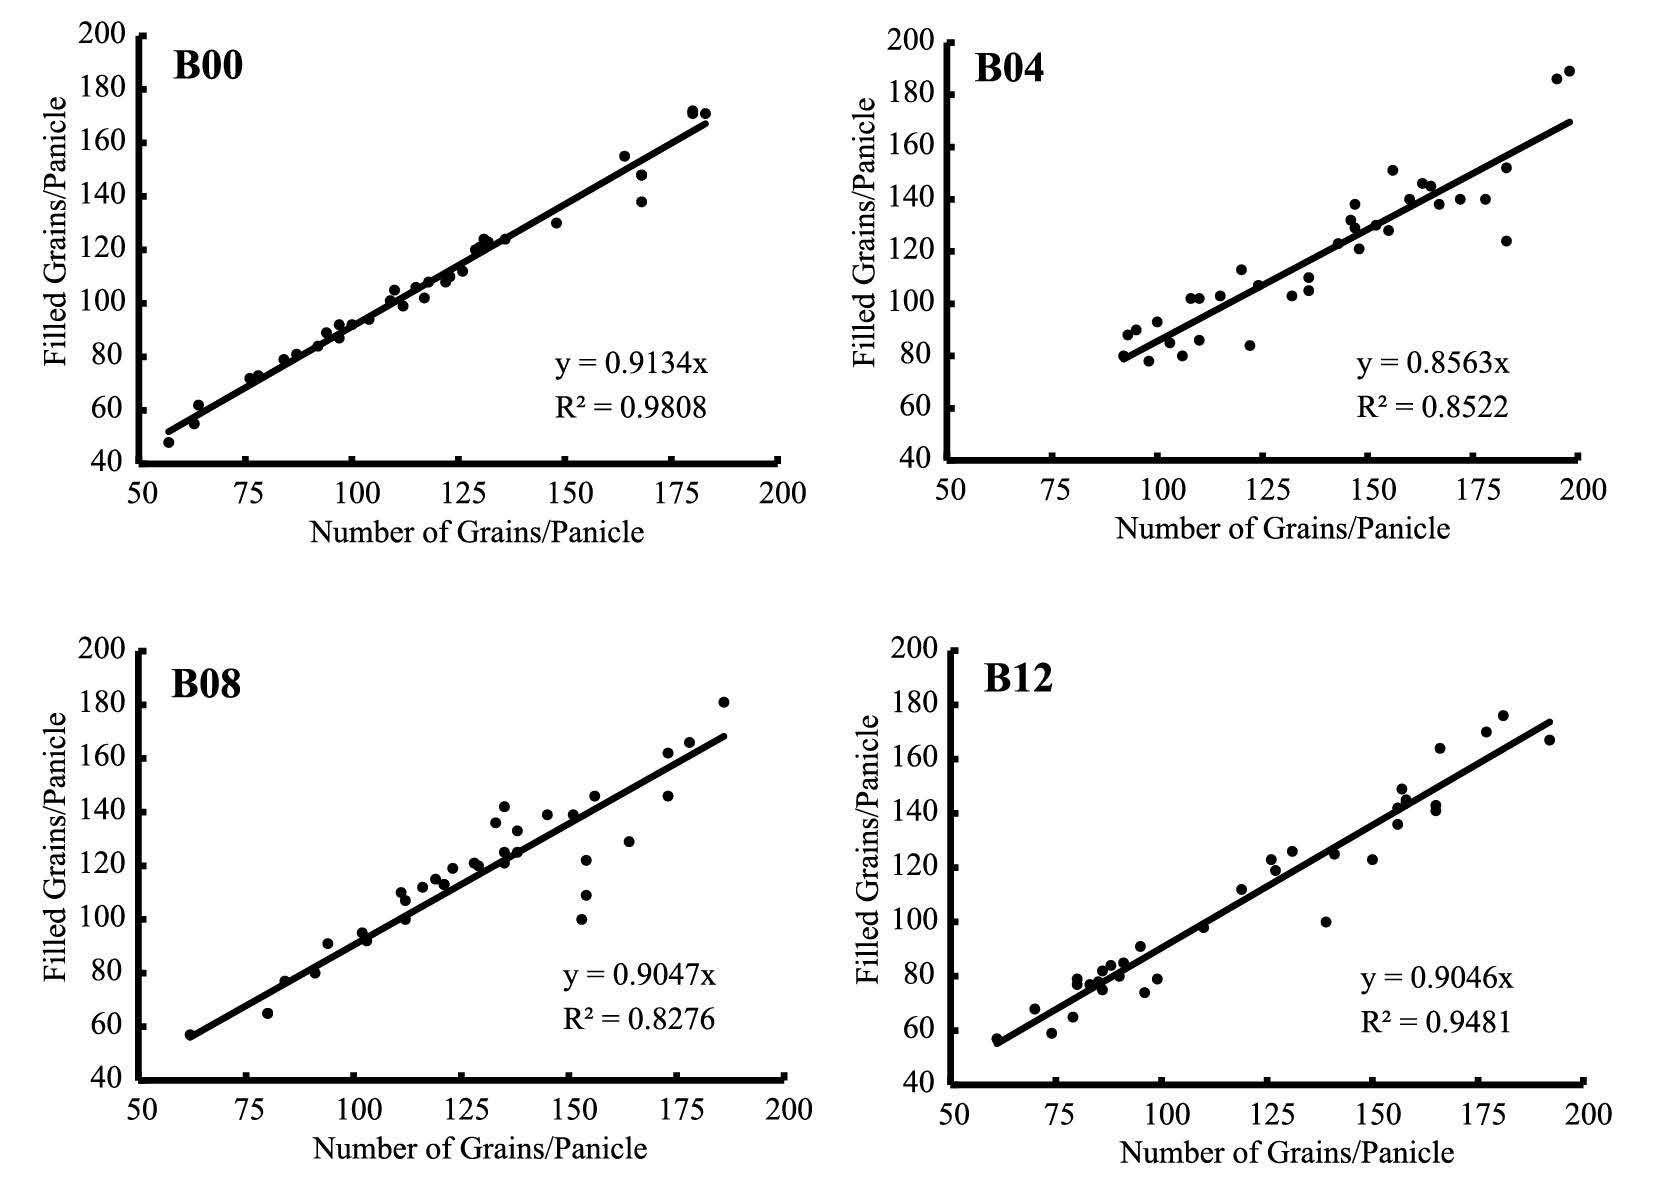
Figure 5. Percentage of filled grains per panicle based on zero-intercept linear regression between number of filled and total grains per panicle.
Individual grain weight was derived from weight of 1,000 grains. Plants treated with biochar at the rate of 1.2 Mg.ha-1 produced larger grains and heavier grain yield than those treated with lower rates of biochar (Figure 6). Panicle density was calculated based on number of grains per cm length of the panicle. Grain yield was calculated based on related yield components.
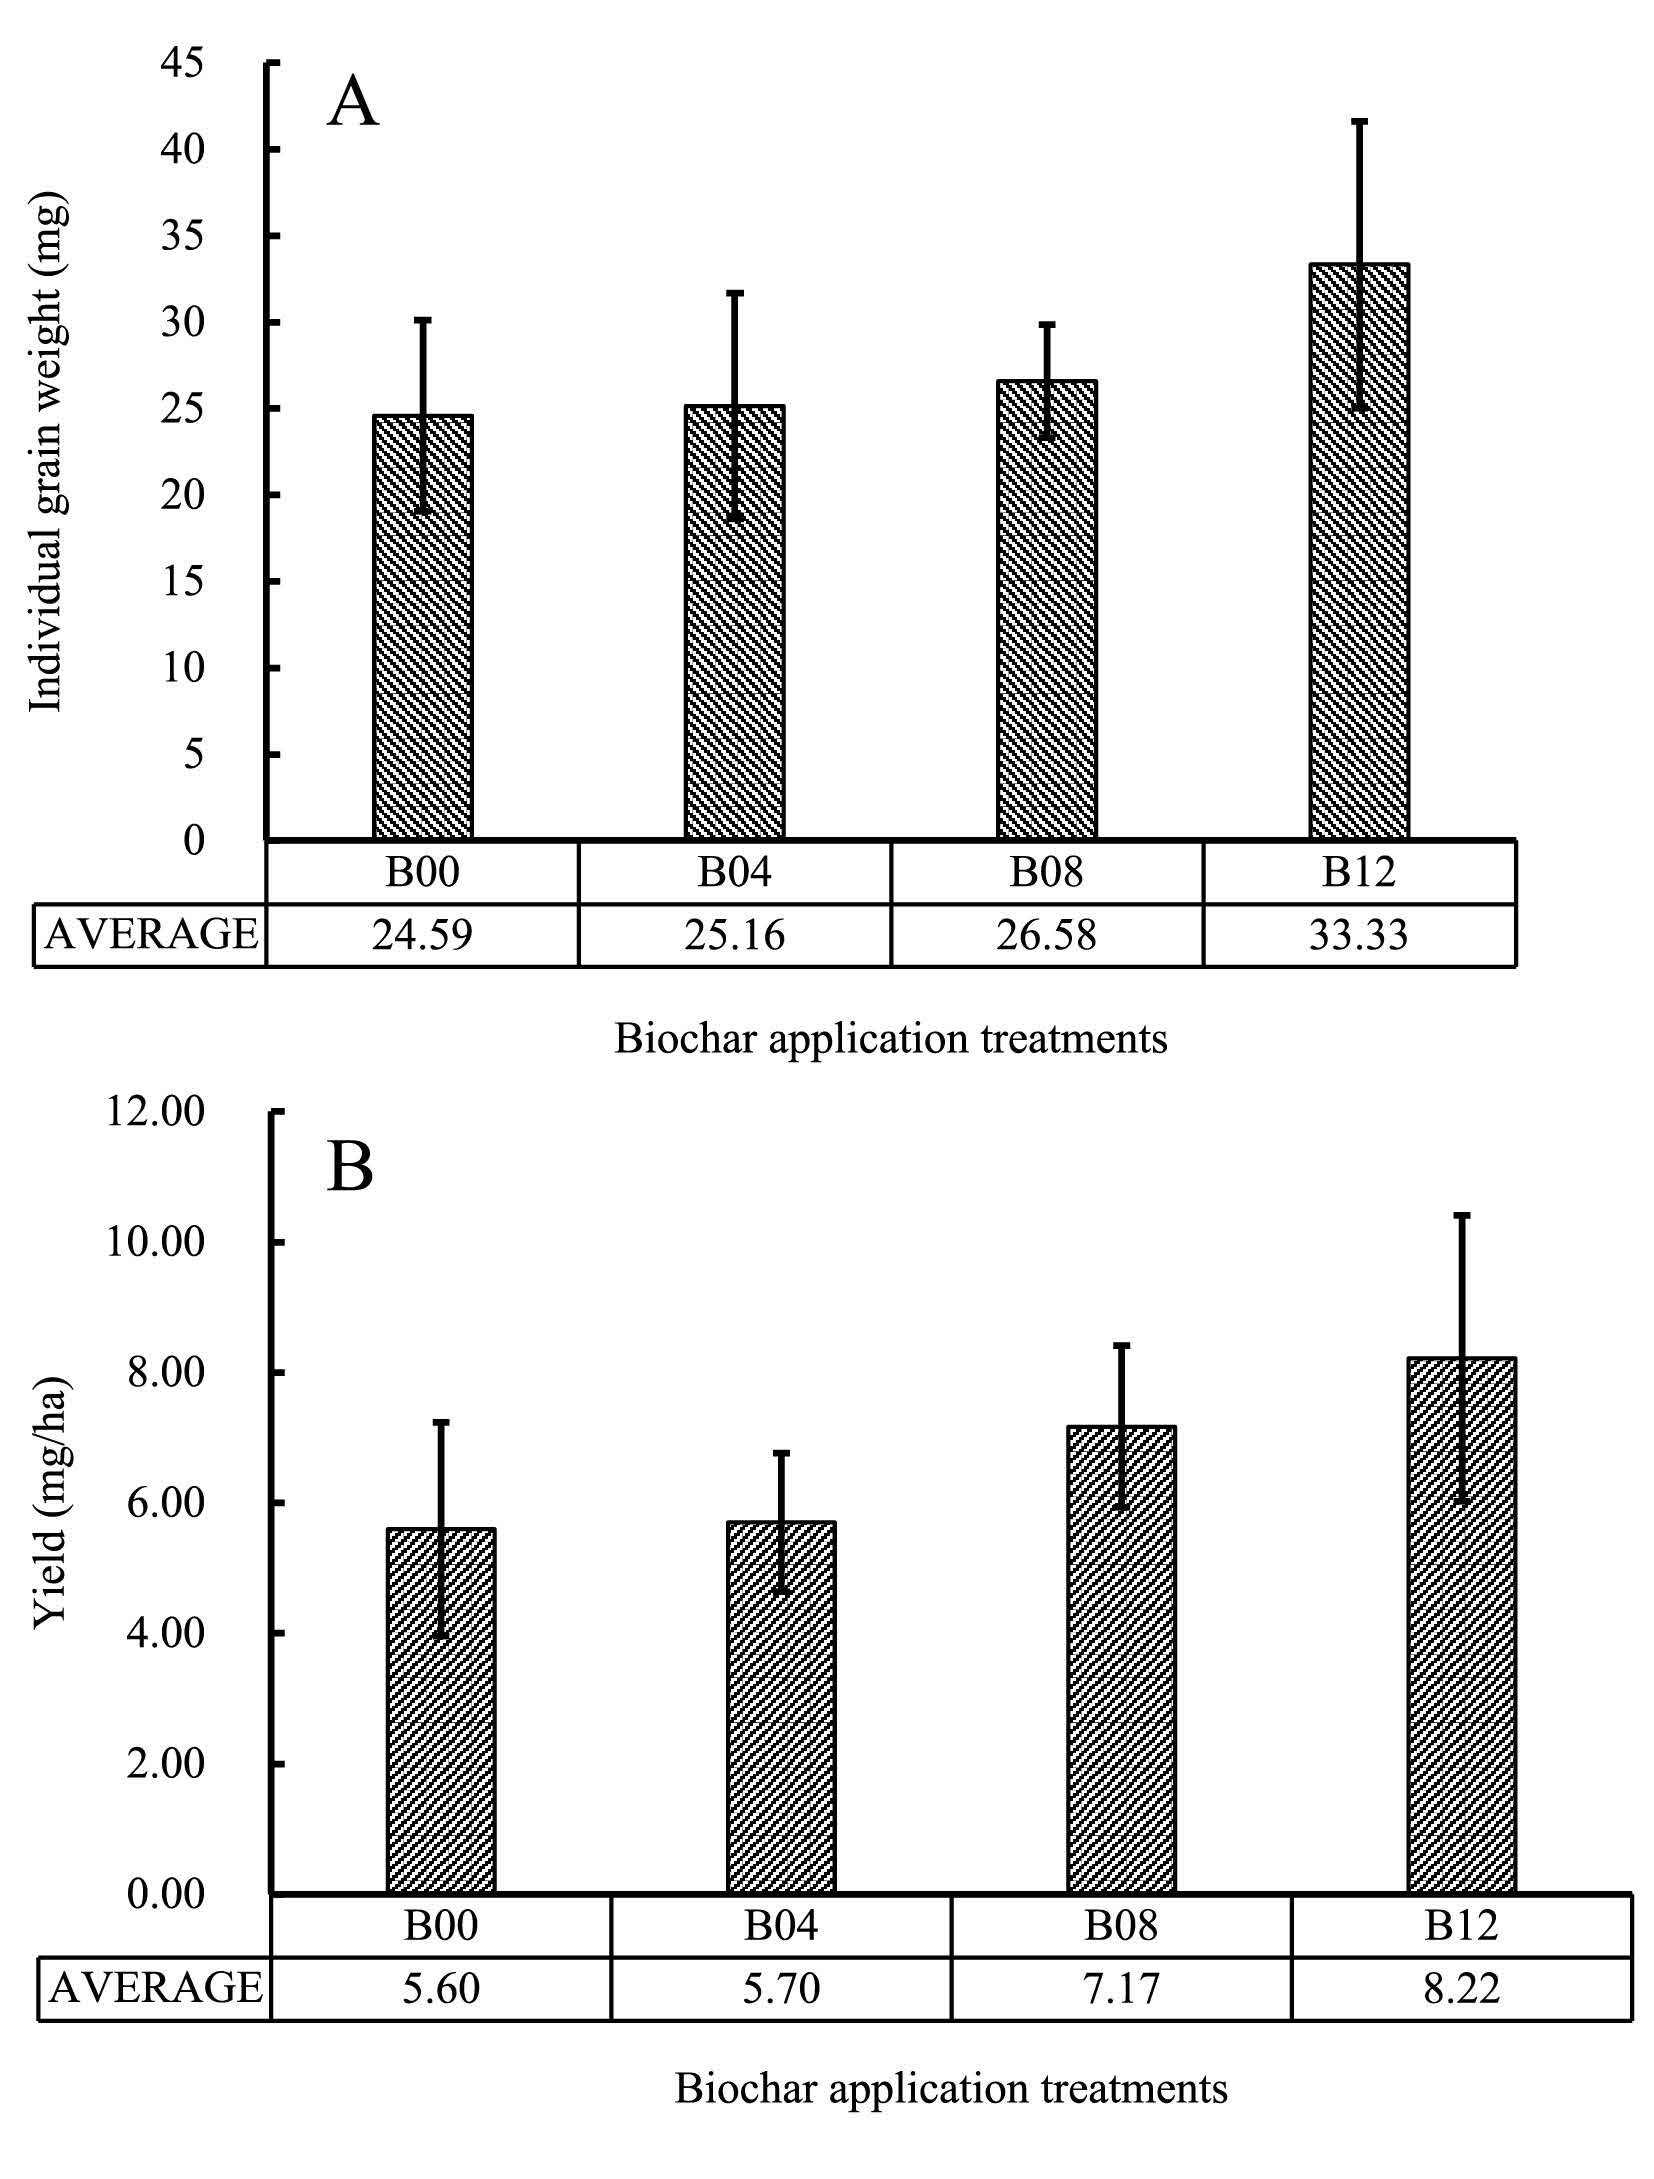
Figure 6. Individual grain weight (A) and yield (B) in rice treated with different rates of biochar.
DISCUSSION
Biochar effects at vegetative growth phase
Application of biochar significantly increased yield of rice crop grown on tropical riparian wetland in our study; however, it restrained height of the crop (Figure 1). Restricted growth of vegetative organs should not be a disadvantage, as long as it does not reduce yield, as it did not in our study. In addition, shorter rice plants withstand lodging damage at higher wind speed in an open paddy field. For instance, Zhang et al. (2014) suggested that an improvement in the lodging resistance of high-yield rice populations could be achieved by the suitable plant height with the optimum configuration of internodes. Corbin et al. (2016) reported that application of growth regulator of trinexapac-ethyl decreased rice plant height and lodging risk.
Measurement of crop height is more relevant at the vegetative growth stage, indicating growth progress. Increase in crop height usually diminished after the crop entered the reproductive growth phase. In our study, increase of crop height was insignificant after the seventh week (Figure 1).
The SPAD value gradually declined starting in the third week after transplanting. The falling-off was associated with decreased leaf chlorophyll and nitrogen contents (Table 2). External source of nitrogen in this study depended solely on chicken manure applied during land preparation before transplanting. We suspect that the powdered wood biochar used in this study increased nitrogen availability at the early stage of rice growth, but exhausted the limited nitrogen source provided by the chicken manure too early, before the rice entered the reproductive stage.
Biochar itself is carbon without any essential elements. Therefore, effects of biochar are associated with its physical structure. The physical characteristics of coarse biochar vary, depending on the biomaterial used to produce it. However, fine powdered forms of biochar are relatively similar, regardless of the source material. Gao et al. (2016) found that application of biochar with chicken manure increased soil carbon, availability of ammonium (NH4+), mineralizable nitrogen, and extractable phosphorus.
Reduced leaf SPAD values following biochar application has also been reported by Asai et al. (2009) in upland rice grown during the wet season in northern Lao PDR, but they suggested that biochar had the potential to improve upland rice production even though it was highly dependent on soil fertility and fertilizer management.
Use of SPAD value for predicting nitrogen content in plants has been widely proven and accepted (Yang et al., 2014; Xiong et al., 2015; Zheng et al., 2015; Yuan et al., 2016). Furthermore, Yuan et al. (2016) compared SPAD value with several reliable nitrogen indicators during vegetative growth (from tillering to heading) stage of rice and found that the fourth fully expanded leaf from the top was the most reliable SPAD measurement for
predicting nitrogen content in rice. Zheng et al. (2015) also took advantage of the correlation between SPAD values with nitrogen content by establishing the threshold SPAD value, below which nitrogen supplement is required. They also found that threshold SPAD values decreased as the growing season progresses for all cultivars and planting sites. As a reminder, Xiong et al. (2015) pointed out that the relationship between SPAD value and leaf N content was profoundly affected by environmental factors and leaf features.
Biochar effects on yield components
Effect of biochar on yield has been inconsistent amongst different crops, biochar feedstock, and climatic conditions. Agegnehu et al. (2016) reported that application of biochar significantly increased barley yield. On the other hand, Carvalho et al. (2016) reported application of wood biochar did not increase yield in rice grown in aerobic soil. Ours is the first report on the effect of biochar application on yield of rice cultivated on tropical wetlands where the land is flooded during the early vegetative growth phase, but gradually dries out during the reproductive phase.
Higher yield at higher rate of biochar application was very significantly related to number of tillers per hill, productive tillers per hill, number of grains per panicle, percentage of filled grain, and weight of 1,000 grains; but was not related to panicle length (Table 1). Liu et al (2016) also used yield component analysis and found that biochar application in rice had the greatest effect on thousand-grain weight, number of productive tillers per hill, and harvest index.
The percentage of productive tillers between untreated and biochar-treated rice crops differed; productive tillers of control plants were 67.3 percent compared to those of biochartreated plants, which varied from 90.9 to 92.2 percent (Figure 3). More than 30 percent of the tillers of untreated crops did not develop inflorescence, compared to less than 10 percent in in biochar-treated crops. The differences were presumed to be associated with soil nutrients. Biochar’s contribution in increasing the availability of soil nutrients has been well recognized, especially in poor soils (Agegnehu et al., 2016)
Lower number of panicles per hill was not associated with more grains per panicle (Figure 4). This result indicates that number of grain per panicle and number of panicles per hill was not correlated.
Percentage of filled grains was proportional to the total number of grains per panicle (Figure 5). Therefore, rice yield was directly influenced by number of grain per panicle. Individual grain weight (based on weight of 1,000 grains) also contributed to higher yield of biochar-treated rice (Table 1). Grain of rice treated with 1.2 Mg.ha-1 biochar was heavier that untreated control (Figure 6).
The yield of biochar-treated rice was higher than that of untreated rice. The fine powdered wood biochar used in this research effectively increased the yield of unfertilized rice crop on tropical riparian wetlands of Indonesia. Liang et al. (2016) reported that finer particle sizes of biochar increased soil enzyme activity. Dong et al. (2015) reported that urea influenced rice yield, with higher yield occurring in unfertilized soils. This research needs to
be further evaluated, since urea application commonly improves the yield of rice.
Inorganic fertilizer is an expensive agricultural input for smallholder farmers in the riparian wetlands of Indonesia. Most of these farmers either do not or only apply half of the recommended rate of inorganic fertilizer. Low-income, smallholder farmers would benefit from any alternative that reduced the need for inorganic fertilizer.
Application of fine-powdered wood biochar at rates up to 1.2 Mg.ha-1 increased the yield of unfertilized rice in the tropical riparian wetlands of Indonesia. On the other hand, crop height and shoot elongation rate decreased. The decrease in crop height was not a disadvantage, since the shorter rice crop better withstands lodging. Further and longer-term research should investigate higher application rates and/or different feedstock sources of biochar.
ACKNOWLEDGEMENTS
We would like to thank the Editor-in-Chief of this journal and anonymous reviewers for their constructive comments, suggestions, and corrections to earlier versions of this manuscript. This work was supported by Program Penelitian Unggulan Profesi 2016 Universitas Sriwijaya (SK No.0242/UN9/KP/2016); Program Insentif Riset Sinas 2016 (No.233/SP2H/LT/DRPM/III/2016).
REFERENCES
Abujabhah, I.S., Bound, S.A., Doyle, R., and Bowman, J.P. 2016. Effects of biochar and compost amendments on soil physico-chemical properties and the total community within a temperate agricultural soil. Applied Soil Ecology. 98: 243-253. https://doi.org/10.1016/j.apsoil.2015.10.021
Agegnehu, G., Nelson, P.N., and Bird, M.I. 2016. Crop yield, plant nutrient uptake and soil physicochemical properties under organic soil amendments and nitrogen fertilization on nitisols. Soil and Tillage Research. 160: 1-13. https://doi.org/10.1016/j.still.2016.02.003
Ahmad, M., Rajapaksha, A.U., Lim, J.E., Zhang, M., Bolan, N., Mohan, D., Vithanage, M., Lee, S.S., and Ok, Y.S. 2014. Biochar as a sorbent for contaminant management in soil and water: a review. Chemosphere. 99: 19-33. https://doi.org/10.1016/j.chemosphere.2013.10.071
Asai, H., Samson, B.K., Stephan, H.M., Songyikhangsuthor, K., Homma, K., Kiyono, Y., Inoue, Y., Shiraiwa, T., and Horie, T. 2009. Biochar amendment techniques for upland rice production in Northern Laos: 1. Soil physical properties, leaf SPAD and grain yield. Field Crops Research. 111(1-2): 81-84. https://doi.org/10.1016/j.fcr.2008.10.008
Bai, S.H., Reverchon, F., Xu, C.Y., Xu, Z., Blumfield, T.J., Zhao, H., Van Zwieten, L., and Wallace, H.M. 2015. Wood biochar increases nitrogen retention in field settings mainly through abiotic processes. Soil Biology and Biochemistry. 90: 232-240. https://doi.org/10.1016/j.soilbio.2015.08.007
Bera, T., Collins, H.P., Alva, A.K., Purakayastha, T.J., and Patra, A.K. 2016. Biochar and manure effluent effects on soil biochemical properties under corn production. Applied Soil Ecology. 107: 360-367. https://doi.org/10.1016/j.apsoil.2016.07.011
Carvalho, M. T. M., Madari, B. E., Bastiaans, L., van Oort, P. A. J., Leal, W. G. O., Heinemann, A.B., da Silva, M.A.S., Maia, A.H.N., Parsons, D., and Meinke, H. 2016. Properties of a clay soil from 1.5 to 3.5 years after biochar application and the impact on rice yield. Geoderma. 276: 7-18. https://doi.org/10.1016/j.geoderma.2016.04.013
Corbin, J. L., Walker, T.W., Orlowski, J. M., Krutz, L. J., Gore, J., Cox, M. S., and Golden, B.R. 2016. Evaluation of trinexapac-ethyl and nitrogen management to minimize lodging in rice. Agronomy Journal. 108(6): 2365-2370. https://doi.org/10.2134/agronj2016.04.0185
Dong, D., Feng, Q., McGrouther, K., Yang, M., Wang, H., and Wu, W. 2015. Effects of biochar amendment on rice growth and nitrogen retention in a waterlogged paddy field. Journal of Soils and Sediments. 15(1): 153-162. https://doi.org/10.1007/s11368-014-0984-3
George, C., Kohler, J., and Rillig, M.C. 2016. Biochars reduce infection rates of the rootlesion nematode pratylenchus penetrans and associated biomass loss in carrot. Soil Biology and Biochemistry. 95: 11-18. https://doi.org/10.1016/j.soilbio.2015.12.003
Githinji, L. 2014. Effect of biochar application rate on soil physical and hydraulic properties of a sandy loam. Archives of Agronomy and Soil Science. 60(4): 457-470. https://doi.org/10.1080/03650340.2013.821698
Griffin, D.E., Wang, D., Parikh, S.J., and Scow, K.M. 2017. Short-lived effects of walnut shell biochar on soils and crop yields in a long-term field experiment. Agriculture, Ecosystems & Environment. 236: 21-29. https://doi.org/10.1016/j.agee.2016.11.002
Hagner, M., Kemppainen, R., Jauhiainen, L., Tiilikkala, K., and Setälä, H. 2016. The effects of birch (Betula spp.). Soil and Tillage Research. 163: 224-234. https://doi.org/10.1016/j.still.2016.06.006
Haider, G., Steffens, D., Moser, G., Müller, C., and Kammann, C.I. 2017. Biochar reduced nitrate leaching and improved soil moisture content without yield improvements in a four-year field study. Agriculture, Ecosystems & Environment. 237: 80-94. https://doi.org/10.1016/j.agee.2016.12.019
Hall, D.J.M., and Bell, R.W. 2015. Biochar and compost increase crop yields but the effect is short term on sandplain soils of Western Australia. Pedosphere. 25(5): 720-728. https://doi.org/10.1016/S1002-0160(15)30053-9
Herath, H.M.S.K., Camps-Arbestain, M., and Hedley, M. 2013. Effect of biochar on soil physical properties in two contrasting soils: An Alfisol and an Andisol. Geoderma. 209: 188-197. https://doi.org/ 10.1016/j.geoderma.2013.06.016
Hunter, B., Cardon, G.E., Olsen, S., Alston, D.G., and McAvoy, D. 2017. Preliminary screening of the effect of biochar properties and soil incorporation rate on lettuce growth to guide research and educate the public through extension. Journal of Agricultural Extension and Rural Development. 9(1): 1-4. https://doi.org/10.5897/JAERD2016.0787
Jiang, X., Haddix, M.L., and Cotrufo, M.F. 2016. Interactions between biochar and soil organic carbon decomposition: Effects of nitrogen and low molecular weight carbon compound addition. Soil Biology and Biochemistry. 100: 92-101. https://doi.org/10.1016/j.soilbio.2016.05.020
Kartika, K., Lakitan, B., Sanjaya, N., Wijaya, A., Kadir, S., Kurnianingsih, A., Widuri, L.I., Siaga, E., and Meihana, M. 2018. Internal-edge row comparison in jajar legowo 4:1 rice planting pattern at different frequency of fertilizer applications. Agrivita. 40(2): xx-xx.
Lakitan, B., Lindiana, L., Widuri, L.I., Kartika, K., Siaga, E., Meihana, M., and Herlinda, S. 2018. Smallholder farmers and sustainable intensification of food production at riparian wetland in South Sumatra, Indonesia. Agrivita. 40(2): xx-xx.
Liang, C., Gascó, G., Fu, S., Méndez, A., and Paz-Ferreiro, J. 2016. Biochar from pruning residues as a soil amendment: effects of pyrolysis temperature and particle size. Soil and Tillage Research. 164: 3-10. https://doi.org/10.1016/j.still.2015.10.002
Liu, Y., Lu, H., Yang, S., and Wang, Y. 2016. Impacts of biochar addition on rice yield and soil properties in a cold waterlogged paddy for two crop seasons. Field Crops Research. 191: 161-167. https://doi.org/10.1016/j.fcr.2016.03.003
Lone, A.H., Najar, G.R., Ganie, M.A., Sofi, J.A., and Ali, T. 2015. Biochar for sustainable soil health: a review of prospects and concerns. Pedosphere. 25(5): 639-653. https://doi.org/10.1016/S1002-0160(15)30045-X
Mašek, O., Brownsort, P., Cross, A., and Sohi, S. 2013. Influence of production conditions on the yield and environmental stability of biochar. Fuel. 103: 151-155. https://doi.org/10.1016/j.fuel.2011.08.044
Mohan, D., Sarswat, A., Ok, Y.S., and Pittman, C.U. 2014. Organic and inorganic contaminants removal from water with biochar, a renewable, low cost and sustainable adsorbent–a critical review. Bioresource Technology. 160: 191-202. https://doi.org/10.1016/j.biortech.2014.01.120
Mukherjee, A., and Lal, R. 2013. Biochar impacts on soil physical properties and greenhouse gas emissions. Agronomy. 3: 313-339. https://doi.org/ 10.3390/agronomy3020313
Rodriguez, I.R., and Miller, G.L. 2000. Using a chlorophyll meter to determine the chlorophyll concentration, nitrogen concentration, and visual quality of St. Augustine grass. HortScience. 35(4): 751–754.
Vaccari, F.P., Maienza, A., Miglietta, F., Baronti, S., Di Lonardo, S., Giagnoni, L., Lagomarsino, A., Pozzi, A., Pusceddu, E., Ranieri, R., et al. 2015. Biochar stimulates plant growth but not fruit yield of processing tomato in a fertile soil. Agriculture, Ecosystems & Environment. 207: 163-170. https://doi.org/10.1016/j.agee.2015.04.015
Wang, J., Xiong, Z., and Kuzyakov, Y. 2016. Biochar stability in soil: meta-analysis of decomposition and priming effects. GCB Bioenergy. 8(3): 512-523. https://doi.org/10.1111/gcbb.12266
Wiszniewska, A., Hanus-Fajerska, E., Muszyńska, E., and Ciarkowska, K. 2016. Natural organic amendments for improved phytoremediation of polluted soils: a review of recent progress. Pedosphere. 26(1): 1-12. https://doi.org/10.1016/S1002-0160(15)60017-0
Xiong, D., Chen, J., Yu, T., Gao, W., Ling, X., Li, Y., Peng, S., and Huang, J. 2015. SPADbased leaf nitrogen estimation is impacted by environmental factors and crop leaf characteristics. Scientific reports. 5: 13389. https://doi.org/10.1038/srep13389
Xu, N., Tan, G., Wang, H., and Gai, X. 2016. Effect of biochar additions to soil on nitrogen leaching, microbial biomass and bacterial community structure. European Journal of Soil Biology. 74: 1-8. https://doi.org/10.1016/j.ejsobi.2016.02.004
Yang, H., Yang, J., Lv, Y., and He, J. 2014. SPAD values and nitrogen nutrition index for the evaluation of rice nitrogen status. Plant Production Science. 17(1): 81-92. https://doi.org/10.1626/pps.17.81
Yuan, Z., Ata-Ul-Karim, S.T., Cao, Q., Lu, Z., Cao, W., Zhu, Y., and Liu, X. 2016. Indicators for diagnosing nitrogen status of rice based on chlorophyll meter readings. Field Crops Research. 185: 12-20. https://doi.org/10.1016/j.fcr.2015.10.003
Zhang, M., and Ok, Y.S. 2014. Biochar soil amendment for sustainable agriculture with carbon and contaminant sequestration. Carbon Management. 5(3): 255-257. https://doi.org/10.1080/17583004.2014.973684
Zhang, J., Li, G., Song, Y., Liu, Z., Yang, C., Tang, S., Zheng, C., Wang, S. and Ding, Y. 2014. Lodging resistance characteristics of high-yielding rice populations. Field Crops Research. 161: 64-74. https://doi.org/10.1016/j.fcr.2014.01.012
Zheng, H.L., Liu, Y.C., Qin, Y.L., Chen, Y., and Fan, M.S. 2015. Establishing dynamic thresholds for potato nitrogen status diagnosis with the SPAD chlorophyll meter. Journal of Integrative Agriculture. 14(1): 190-195. https://doi.org/10.106/S2095-3119(14)60925-4
Zhou, Y., Berruti, F., Greenhalf, C., Tian, X., and Henry, H.A.L. 2017. Increased retention of soil nitrogen over winter by biochar application: implications of biochar pyrolysis temperature for plant nitrogen availability. Agriculture, Ecosystems & Environment. 236: 61-68. https://doi.org/10.1016/j.agee.2016.11.011
Benyamin Lakitan1,3*, Andri Alberto1, Lindi Lindiana2, Kartika Kartika2, Siti Herlinda1,3, and Astuti Kurnianingsih1
1 College of Agriculture, Universitas Sriwijaya, Inderalaya 30662, Indonesia
2 Graduate School, Universitas Sriwijaya, Palembang 30139, Indonesia
3 Research Center for Sub-optimal Lands (PUR-PLSO), Universitas Sriwijaya, Palembang 30139, Indonesia
*Corresponding author. E-mail: blakitan60@unsri.ac.id
Total Article Views