 ISSN: 2822-0838 Online

Utilization of Deep Learning and Unmanned Aerial Vehicle (UAV) for Monitoring Plastic Debris
Aldiano Rahmadya*, Zanjabila, Hidayat, Indra Setiadi Hermana, and Fajar SetiawanPublished Date : March 19, 2025
DOI : https://doi.org/10.12982/NLSC.2025.037
Journal Issues : Number 2, April-June 2025
Abstract Plastic debris has become a significant environmental problem due to its persistence in nature and harmful ecological impacts. Recently, Unmanned Aerial Vehicles (UAVs) and deep learning models have been utilized for detection and analysis, as effective plastic debris monitoring is essential for mitigation efforts. While extensive research has focused on coastal areas, riverine environments remain understudied. This study evaluates the capability of UAVs and the You Only Look Once version 5 (YOLOv5) deep learning model in detecting and quantifying macro plastic debris in river systems. The research was conducted in 2021 in the lower reaches of the Citarum River, Muara Gembong District, Bekasi Regency, West Java Province, Indonesia. UAVs were deployed to capture aerial images, which were then processed using the YOLOv5_small and YOLOv5_large models. A total of 416 images were analyzed, and plastic debris was classified based on size and distribution. The results indicate that UAV effectively capture high-resolution images of plastic debris in river environments. The YOLOv5 model successfully identified plastic debris; however, its accuracy requires further improvement, with mean Average Precision (mAP) scores of 16.90% and 19.21% for YOLOv5_small and YOLOv5_large, respectively. Detection performance varied depending on factors such as solar radiation intensity, surface water reflection, and debris characteristics. Future research should explore advanced deep learning architectures, integrate multi-spectral imaging, and assess seasonal variations in plastic debris accumulation. This study provides a foundation for the development of automated, scalable plastic debris monitoring systems to support environmental management and pollution mitigation efforts.
Keywords: Plastic debris detection, Unmanned Aerial Vehicles (UAVs), YOLOv5 deep learning, Riverine plastic pollution monitoring
Funding: The authors are grateful for the research funding provided by the ASEAN – Norway cooperation project on local capacity building for reducing plastic pollution in the ASEAN region (ASEANO project) via the Center for Southeast Asian Studies (CSEAS) Indonesia.
Citation: Rahmadya, A., Zanjabila, Hidayat, Hermana, I.S., and Setiawan, F. 2025. Utilization of deep learning and unmanned aerial vehicle (UAV) for monitoring plastic debris. Natural and Life Sciences Communications. 24(2): e2025037.
INTRODUCTION
Plastic debris has become a global concern due to its significant impact on water bodies (Derraik, 2002). With plastic waste production expected to reach 53 million metric tons per year by 2030 (Borrelle et al., 2020), the problem continues to escalate. Most of this debris originates from residential areas, where transported by rivers into the oceans. Once in the marine environment, plastic debris poses a serious threat to wildlife (Derraik, 2002). This issue is particularly severe in Indonesia, a developing country with a large population, where plastic pollution remains a major environmental challenge. Therefore, mitigation efforts should be carried out to reduce the impact of plastic debris on aquatic environments.
Numerous studies have been conducted in to mitigate the aforementioned environmental problem, which can be categorized into three main areas. The first focuses on estimating the quantity and spatial distribution of plastic debris, the second examines its adverse effects on ecosystems and potential threats to human health, and the third explores plastic debris management techniques along with their economic, social, and environmental impacts (Barnes et al., 2009; Geyer, Jambeck, and Law, 2017; Ragaert et al., 2020; L. Li et al., 2021; Pikoli et al., 2022).
Several methods for estimating the quantity and spatial distribution of plastic debris have been widely developed over the past few decades. Unmanned Aerial Vehicle (UAV) has been recognized as a supportive and powerful tool for collecting high-resolution imagery. UAV drone have been proven suitable for capturing macro litter in various environments, including coastal areas, beach dune systems, remote islands, lake shores, and sea surfaces (Martin et al., 2018; Deidun et al., 2018; Fallati et al., 2019; Okuku et al., 2020; Andriolo et al., 2021). However, their application in dynamic river environments remains limited and challenging, particularly due to variations in water conditions, lighting, and debris movement.
To extract meaningful data from UAV drone imagery, automated object detection models are required, an object detection model should be developed. Various automated object detection methods have been proposed for calculating plastic debris from UAV drone images using deep learning models. With advancements in GPU capabilities, deep learning has been increasingly utilized in computer vision (Kaur and Singh, 2023). Its working principle is to detect objects in images or videos while simultaneously classifying them by generating bounding boxes around the detected objects. Additionally, deep learning is widely applied in image retrieval, object detection, and semantic segmentation. (Kaur and Singh, 2023)
Several deep learning models have been successfully developed for object detection, including Faster Region-based Convolutional Neural Network (Faster R-CNN), Single Shot MultiBox Detector (SSD), and You Only Look Once (YOLO) (Redmon et al., 2016; Song et al., 2021; Hussain, 2024). In this study, the YOLO version-5 (YOLOv5) model is used as it is considered faster than other models (Khanam and Hussain, 2024). YOLOv5 is an improved version of YOLOv4, offering better performance. The transition from the Darknet framework in YOLOv4 to PyTorch in YOLOv5 enhances its speed and ease of use while also increasing accuracy by 5% to 16% (M. Wang et al., 2023; Khanam and Hussain, 2024).
The YOLOv5 architecture includes five model variants, ranging from the computationally efficient YOLOv5n to the high-precision YOLOv5x (Khanam and Hussain, 2024). Its applications extend across various fields, from industrial activities to healthcare (Chen et al., 2022; Zhai et al., 2024; Xiao et al., 2024; Kurniawan et al., 2024; Lim et al., 2024; Tu et al., 2024; Bachir and Memon, 2024; Shahin et al., 2024; Xiang, Wu, and Wang, 2025; W. Li, Zhao, and Du, 2025; J. Li et al., 2025; Mohanty et al., 2025). Two YOLOv5 variants, YOLOv5s (small) and YOLOv5l (large), are used to analyze drone images, differing in the complexity of their neural network architecture. The YOLOv5 model is available at https://github.com/ultralytics/yolov5. Additionally, the YOLOv5 is well-suited for detecting small objects (Z. Wang et al., 2024), therefore YOLOv5 is selected as the base model for detecting plastic debris in our study.
This study is conducted in Citarum River, Indonesia. It is one of the most polluted rivers in the world, with high levels of toxic heavy metals and severe pollution (Terangna Bukit, 1995; Asian Development Bank, 2013; Blacksmith Institute, 2013; Marselina and Burhanudin, 2017; Marselina, Rahmi, and Nurhayati, 2025). An estimated 6,043 ± 567 plastic items, or 1.01 ± 0.19 tons per day, along with a microplastic concentration of 3.35 ± 0.54 particles per cubic meter, are discharged into the ocean from the Citarum River (Cordova et al., 2022; Iskandar, Cordova, and Park, 2022). Despite rivers being the primary transport pathways for plastic debris, studies on drone-based plastic monitoring in river systems remain scarce (Geraeds et al., 2019; Rahmadya et al., 2022). The effectiveness of UAV-deep learning-based plastic debris detection in river environments with moving objects has yet to be fully explored.
The above-mentioned studies suggested the potential of UAV drone imageries as data source when combine with YOLOv5 object detection model to quantify the plastic debris in river flows. Consequently, our research objectives were to test the robustness of UAV drone imageries and the performance of Deep Learning YOLOv5 model in identifying and monitoring macro plastic debris in river system and further, while further addressing the existing knowledge gap in river plastic pollution research. This study is intended for environmental researchers, governmental agencies, and policymakers aiming to improve plastic pollution monitoring in riverine environments. The findings can inform decision-making for waste management policies and contribute to the development of AI-driven environmental monitoring frameworks.
MATERIAL AND METHODS
Before conducting observations, a system model was firstly designed. In general, the process of training to model testing consists of five stages: (1) data collection, which involves gathering image data using drone; (2) pre-processing; (3) data input; (4) modelling and execution, during which several experiments were conducted to evaluate the ratio of training data to validation data; and statistical analysis and comparison. The schematic of the modelling process to testing is shown in Figure 3. The process of training and testing the model was conducted in Jupyter Notebook using the Python version 3.10. Additionally, the training process required high GPU and RAM capabilities. Therefore, the experiment was performed in Google Collab environment to facilitate the training process.
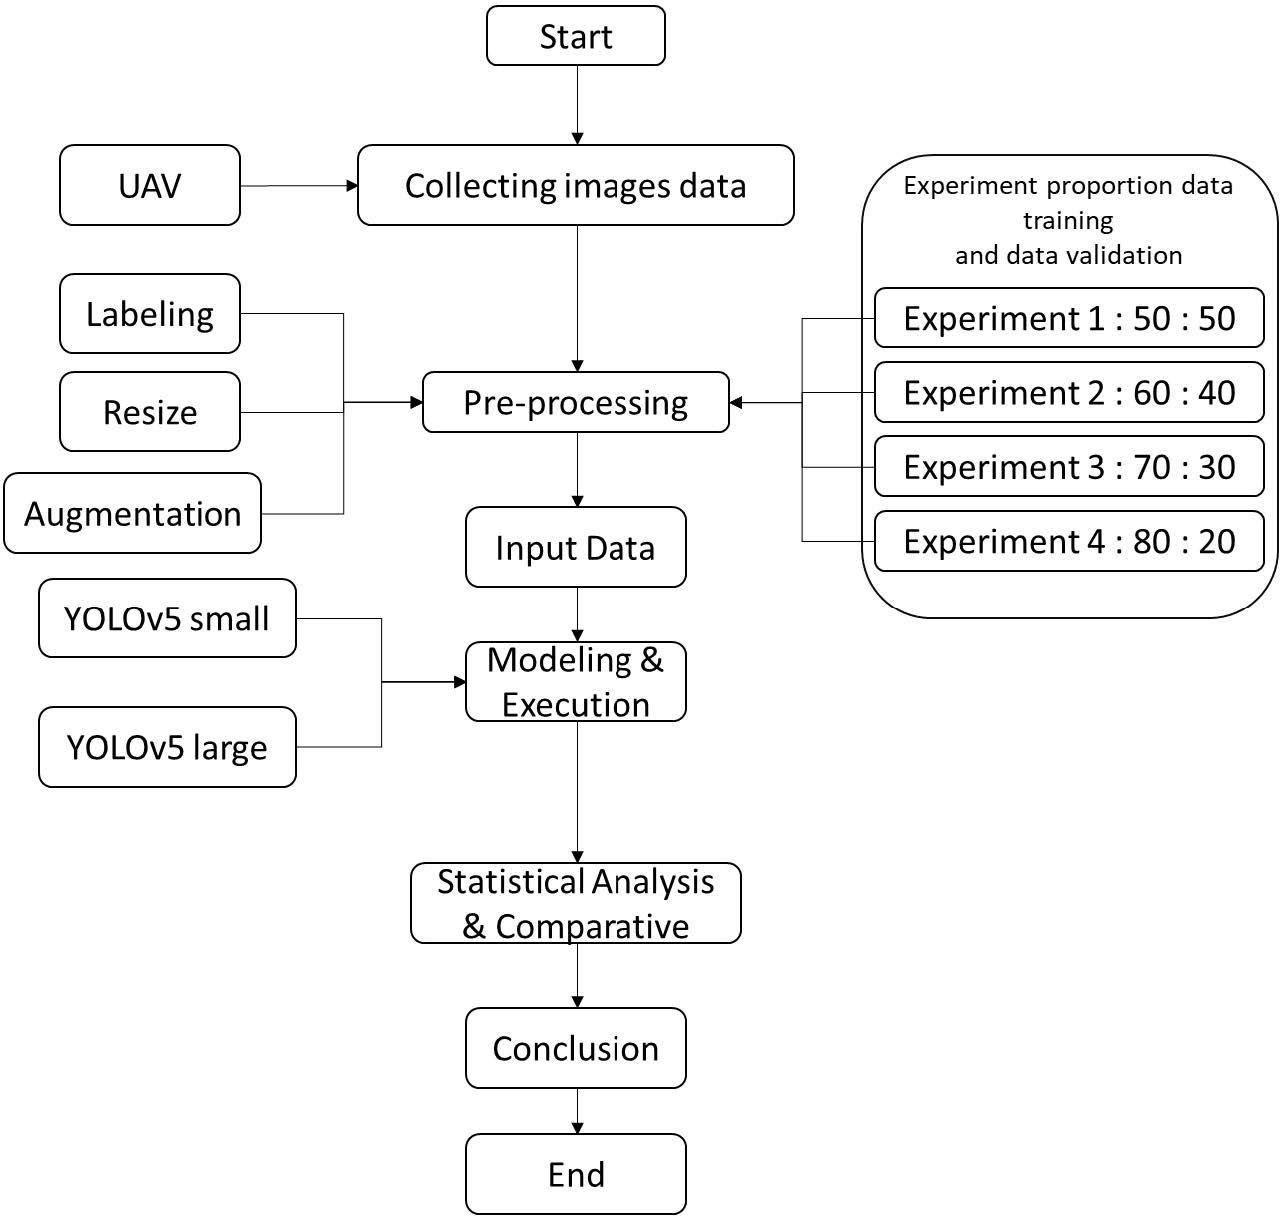
Figure 1. Flowchart of the model training and testing process.
Study area
This research was conducted from February to July 2021 in the downstream section of the Citarum River (5°59'4.56"S, 107°2'38.28"E), located in Muara Gembong Sub-district, Bekasi District, West Java Province (Figure 1). The study site is approximately eight kilometers upstream from the river's estuary.
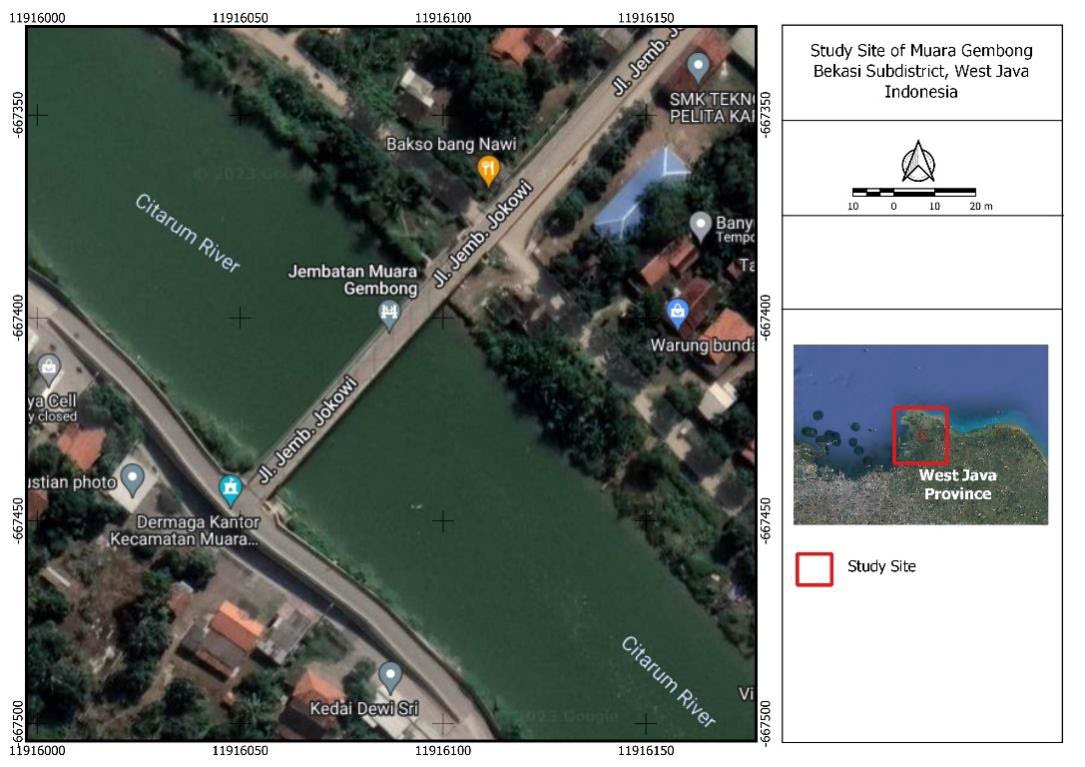
Figure 2. Situation map of the study site in the Citarum River, Muara Gembong, Bekasi Sub-district, West Java, Indonesia.
Data acquisition and image dataset
In this study, observations were made using drones to take aerial photos of plastic debris flowing in rivers (Figure 2). The image was captured using a DJI Phantom 3 Pro drone equipped with a 4K resolution three-axis camera stabilization gimbal (http://www.dji.com). The camera specification a ½.3-inch CMOS sensor paired with a 20 mm focal length lens (equivalent to the 35mm format) and provides a field of view of approximately 94°. During flight, the gimbal was set at -90° or facing downward, to ensure that the captured images could directly detect particle shapes and sizes accurately without requiring corrections during post-processing. Figure 3 illustrates UAV drone flight path during aerial imaging.
The data collection method follows the approach of Geraeds et al. (2019) and was adopted by Rahmadya et al. (2022), three flight heights: 5 meters (H1), 10 meters (H2), and 64 meters (H3) from ground level (Figure 4). These altitudes were selected to comply with flight regulations while balancing image coverage and resolution. After analysis, images captured at five meters were used, as plastic debris (>2.5 cm) remained clearly visible on the water surface at this altitude (GESAMP, 2019). The UAV drone flew automatically using the Litchi for DJI Drones application, which can be downloaded from the Google Play Store. The drone operated autonomously using the Litchi for DJI Drones application, available on the Google Play Store. It was programmed to capture images every two seconds, with flights conducted between 09:00 AM and 11:00 AM to minimize sunlight reflections on the water surface.
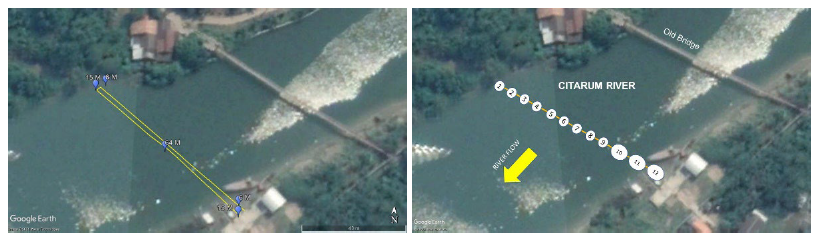
Figure 3. UAV drone flight path during aerial imaging.
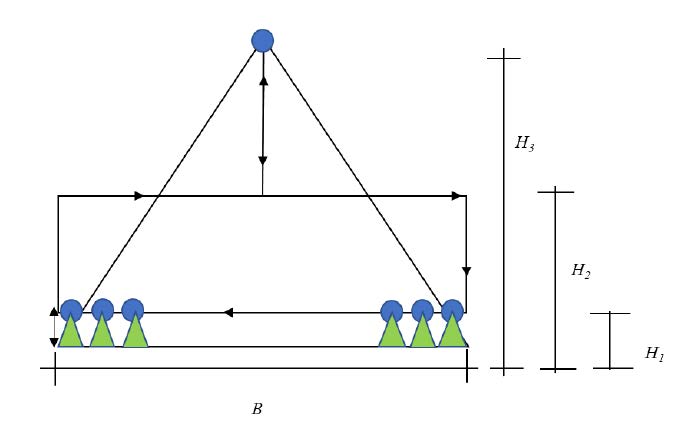
Figure 4. The UAV drone flying scheme involves three altitudes: H1 at 5 meters, used to capture details such as macroplastics on the water surface, while H2 at 10 meters and H3 at 64 meters are used to observe the overall condition of the river segment.
The acquired images (4,000 x 3,000) were stored in EXIF metadata files. The image data were categorized based on their altitude and labeled using the “labelImg tool”, which operates under Python (Figure 5). The labeling process required two people. In this study, plastics on the water surface were labeled as "inorganic_macro_debris". Additionally, plastics on the surface and partially submerged plastics were also labelled, while plastics on the riverbank and those fully submerged plastics were not labelled (Figure 6).
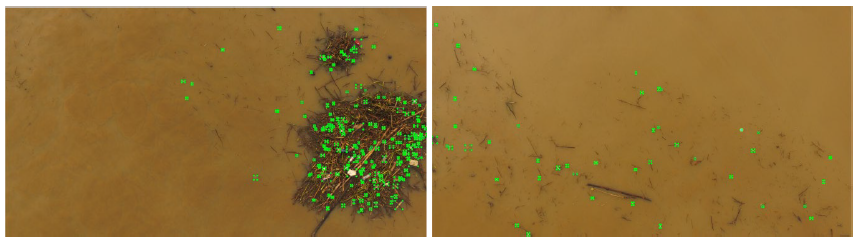
Figure 5. Pre-processing and labelling using “labelImg” in Python.
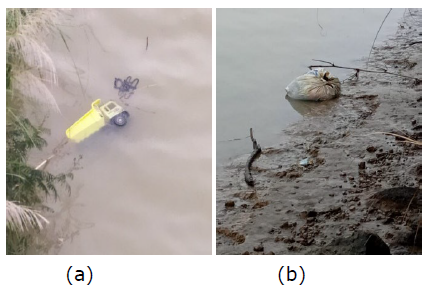
Figure 6. Example images of plastic debris captured by the UAV drone: (a) partially submerged plastic considered as a sample, and (b) stranded plastic not considered as a sample.
After the labelling process, all images were resized to reduce the number of pixels. The original images had a high resolution of 4,000 x 2,250 pixels; by resizing them to 736 x 736 pixels, it was expected to facilitate the training process without significantly compromising image quality. The next pre-processing step was data augmentation, a strategy that significantly increases the diversity of data available for training models without the need collect new data. In this study, the augmentation techniques applied included horizontal flip, vertical flip, and 20% zoom-in on the training data, resulting in three times the amount of original data (Figure 6).
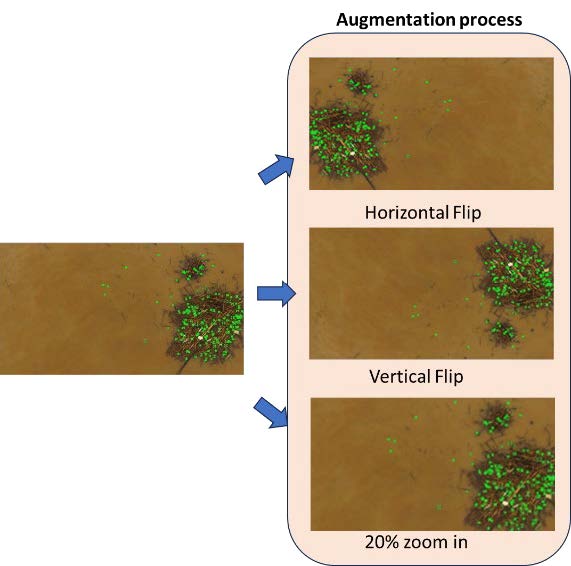
Figure 7. Augmentation Process (pre-processing data)
The next step was data processing, in this study, experiments were conducted to determine the optimal ratio of training and validation data. These experiments aimed to obtain an effective model with high accuracy. Four experiments were carried out to test different proportion of training and validation data. The details of these experiments and the data augmentation process are presented in Table 1.
Table 1. Experiment and pre-processing data.
|
Ratio |
Before augmentation |
After augmentation |
||||||||
|
Training data |
Validation data |
Total data |
Training data |
Validation data |
Total data |
|||||
|
50: 50 |
210 |
209 |
419 |
630 |
209 |
839 |
||||
|
60: 40 |
251 |
168 |
419 |
753 |
168 |
921 |
||||
|
70: 30 |
293 |
126 |
419 |
879 |
126 |
1005 |
||||
|
80: 20 |
363 |
84 |
419 |
1,089 |
84 |
1,173 |
||||
Performance evaluation
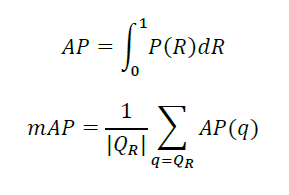
The parameters to be evaluated from the model used are Precision (P), Recall (R), F1 score, and mean Average Precision (mAP). The formula (Jung and Choi, 2022; Kai et al., 2022) used are:
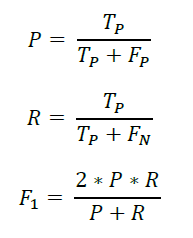
Precision (P) is the ratio of true positive (TP) to the sum of true positive and false positive (FP). In object detection, precision measures the percentage of correct detections out of all detections made by the model. A high precision value indicates that the model produces few false positives. Recall (R) is the ratio of true positives to the sum of true positives and false negatives. Recall measures the percentage of objects successfully detected by the model from the ground truth. A high recall value indicates that the model can detect most of the objects in the image.
Another parameter is mAP0.5:0.95 is the average Average Precision, furthermore this metric is commonly used in object detection, which calculates the average precision at various IoU (Intersection over Union) thresholds. The IoU is the ratio of the intersection area between the predicted bounding box and the ground truth bounding box to the combined area between them. mAP0.5:0.95 calculates the average precision at IoU thresholds ranging from 0.5 to 0.95 at 0.05 intervals. In addition, this metric is used to evaluate the overall performance of the object detection model.
The F1 score is the harmonic mean of precision and recall, where a perfect F1 score is 1.0, and a score of 0 indicates that both precision and recall are zero. This metric is suitable for use when both precision and recall are important. Precision (P), recall (R), mAP0.5:0.95, and F1 are the metrics used to evaluate the performance of the object detection model. Precision measures detection accuracy, recall measures detection completeness, mAP0.5:0.95 measures overall model performance at various IoU thresholds, and the F1 score provides a balanced measure between precision and recall. Eventually, these metrics help measure the effectiveness of object detection models and compare the performance between different models.
FP is false positives, and FN represents the number of objects detected incorrectly. TP indicates the number of correctly detected objects. TP + FP is the number of detected objects, TP + FN is the number of true objects. F1 is the harmonic mean of P and R. Furthermore, the mAP value describes how correctly our model predicts each possibility in the benchmark data or test data.
RESULTS
Unmanned aerial system survey
The river segment at the study site is 65 meters wide, with a water flow velocity ranging from 0.8 to 1 m/s. UAVs were deployed to capture images of plastic debris in the river. Considering a minimum remaining power limit of 20%, each drone was estimated to fly for up to 15 minutes per battery. With three batteries available and a charging time of approximately two hours per battery, up to four flights could be conducted between 9:00 AM and 11:00 AM. A flying altitude of five meters was determined to be ideal for capturing high-quality images with a Ground Sampling Distance (GSD) of 15.75 cm/pixel (Andriolo et al., 2021). However, sampling in this river segment required extra caution compared to drone-based studies conducted in open beach areas, as the presence of tall trees along the riverbanks increased the risk of drone collisions. In total, 419 images were collected during the observation period.
Plastic debris identification model performance
The training process utilized the YOLOv5_small and YOLOv5_large models with a batch size of 16 and 150 epochs on 416 images. Experiments were conducted by varying the ratio of training to validation data (see Figure 3 and Table 1). To enhance model performance, an augmentation process was applied, tripling the initial amount of training data. Using Google Colab, a free cloud-based platform, the average training time per model was approximately two hours. The longest training duration was recorded at two hours and 30 minutes for the YOLOv5_large model in the 80:20 training-validation split.
The object detection performance of the two models (YOLOv5_small and YOLOv5_large) across different experiments (Exp) is presented in Table 2. The table includes values for Precision, Recall, mAP0.5:0.95, and F1-score. To assess the performance of the YOLO models, the mAP0.5:0.95 values from each trial and model were compared, based on the best values at epoch 150. The results indicate that the choice of model produces different outcomes, and the ratio of training to validation data significantly impacts performance. For instance, in the YOLOv5_small model, increasing the amount of training data generally improved precision, recall, mAP0.5:0.95, and F1-score. However, in Exp-4, the highest training data ratio did not enhance the mAP0.5:0.95 value, whereas Experiment 3, with a smaller proportion of training data, yielded the best results for the YOLOv5_small model (Table 2 and Figure 8).
Table 2. Comparison of final values for each parameter of the YOLOv5_small and YOLOv5_large models.
|
|
Performance parameters |
|||||||
|
|
P |
R |
mAP0.5:0.95 |
F1 |
||||
|
Experiment |
YOLOv5_small |
YOLOv5_large |
YOLOv5_small |
YOLOv5_large |
YOLOv5_small |
YOLOv5_large |
YOLOv5_small |
YOLOv5_large |
|
Exp-1 50 : 50 |
0.61139 |
0.68164 |
0.39984 |
0.3934 |
0.1708 |
0.1920 |
0.4835 |
0.4989 |
|
Exp-2 60 : 40 |
0.61379 |
0.69116 |
0.37191 |
0.38163 |
0.1632 |
0.1921 |
0.4631 |
0.4917 |
|
Exp-3 70 : 30 |
0.65706 |
0.64828 |
0.37025 |
0.38702 |
0.1691 |
0.1864 |
0.4736 |
0.4847 |
|
Exp-4 80 : 20 |
0.64255 |
0.59696 |
0.32743 |
0.33982 |
0.1565 |
0.1728 |
0.4338 |
0.4331 |
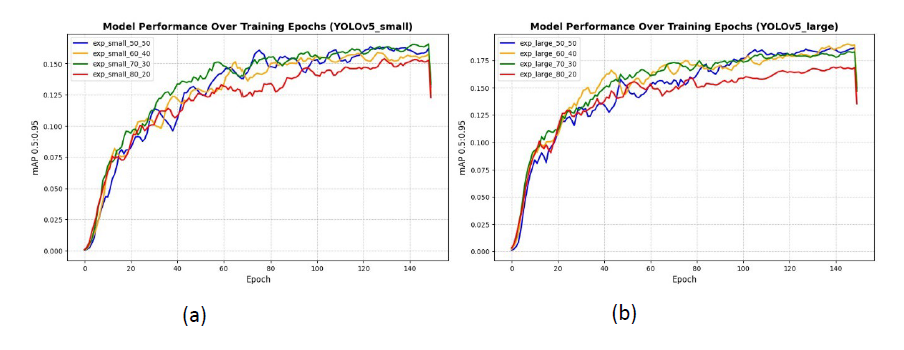
Figure 8. The graph of model performance during the training process across different training and validating ratio experiments for (a) YOLOv5_small and (a)YOLOv5 large.
Testing model using different data set
After determining the best model training and validating ratio in this study, the model was tested on additional images captured by a drone at the same location but at different capturing times (July 2021) and with other studies data set. The test results indicate that the YOLOv5_small model with a 70:30 ratio detected 134 plastic debris items, while the YOLOv5_large model with a 60:40 ratio detected 113 plastic debris items (Figure9). The results obtained are relatively low compared to other studies using the COCO and VisDrone2019 datasets (Table 3)
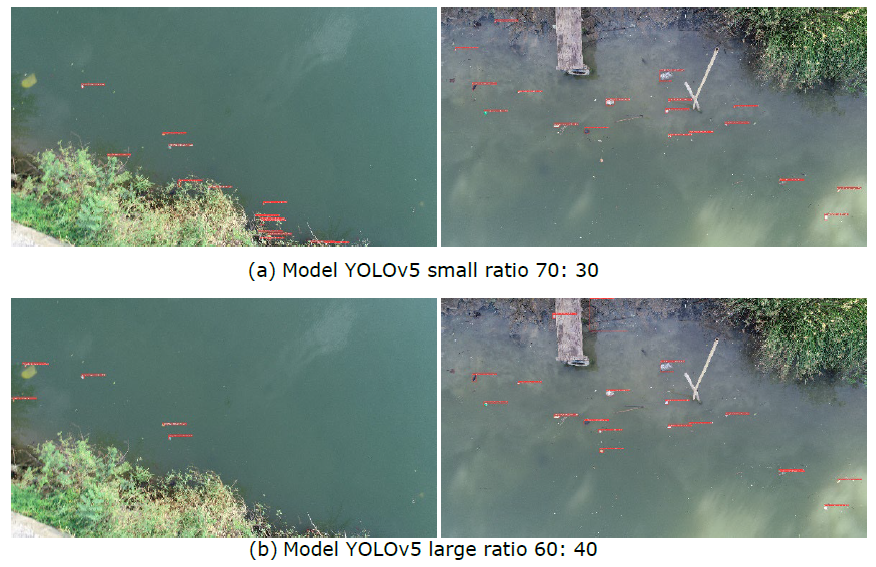
Figure 9. A snapshot image comparison of the (a) YOLOv5_small 70:30 and (b) YOLOv5_large 60:40 models for plastic debris detection in the Citarum river.
Table 3. Comparison experiment results.
|
Method |
Dataset |
mAP0.5:0.95 (%) |
Source |
|
YOLOv5_small 70:30 |
PlasticsCitarum2021 |
16.90 |
Author data set |
|
YOLOv5_large 60:40 |
PlasticsCitarum2021 |
19.21 |
Author data set |
|
YOLOv5_small |
COCO dataset |
33.48 |
Hussain 2024; Khanam and Hussain 2024 |
|
YOLOv5_large |
COCO dataset |
39.24 |
Hussain 2024; Khanam and Hussain 2024 |
|
YOLOv5n |
VisDrone2019 |
16.54 |
Tang, Zhang, and Fang 2024 |
|
YOLOv5s |
VisDrone2019 |
18.70 |
Z. Wang et al. 2024 |
DISCUSSION
In the YOLOv5_large model, Exp-2 yielded the most optimal ratio, achieving an mAP0.5:0.95 value of 0.19214. In contrast, Exp-3 and Exp-4, which used a larger proportion of training data, resulted in lower mAP0.5:0.95 values compared to Exp-2. As shown in Table 2, the optimal training-to-validation ratio for the YOLOv5_small model was 70:30, while for the YOLOv5_large model, the best performance was achieved with a 60:40 split. The training performance of each model across different data ratios is illustrated in Figure 8.
Based on Figure 8, the training process for the YOLOv5_small model indicates that the 70:30 dataset experiment achieved the highest mAP0.5:0.95 value compared to other experiments. This conclusion is supported by the trend observed in the 60:40 experiment, which showed a more dominant performance up to the 150th epoch. The highest mAP0.5:0.95 value is represented by the red line, corresponding to the 70:30 experiment.
Furthermore, during the YOLOv5_large model training process, Exp-2 60: 40, achieved a higher mAP0.5:0.95 value compared to the other experiments (The Blue line in Figure 8). Based on its position at the 150th epoch, Exp-2 60: 40 demonstrated the best performance, maintaining the highest trend among all tested ratios.
When comparing the results of the two training processes, it can be concluded that the Yolov5_large model, with the highest mAP0.5:0.95 value from the Exp-2 60:40, outperformed the Yolov5_small model, where the highest mAP0.5:0.95 value was obtained from the Exp-3 70: 30. The graph indicates that the peak mAP0.5:0.95 value for the large model exceeds 0.175, whereas for the Yolov5_small model, it remains below 0.175. Based on the mAP0.5:0.95 and precision values presented in Table 2, Yolov5_large model with Exp-2 60: 40 demonstrated greater accuracy in identifying plastic debris compared to the Yolov5_small model with Exp-3 70: 30.
The results obtained are relatively low compared to other studies using the COCO and VisDrone2019 datasets (Table 3). This difference may be attributed to several factors, including the smaller number of datasets used, the IoU threshold settings, and the effectiveness of data augmentation. For example, the mAP0.5 value tends to be higher than mAP0.5:0.95 because mAP0.5 considers only a single level of error in bounding box positioning, whereas mAP0.5:0.95 requires higher accuracy in both detection and placement. Additionally, suboptimal data augmentation may have also contributed to the lower performance.
The difference in the number of plastic debris detected is due to the performance of each model. As explained in the previous section, the YOLOv5_large model with a 60:40 ratio (large model) has better accuracy than the YOLOv5_small model with a 70:30 ratio (small model). Although the test results show that the best small model can detect more plastics debris than the large model, this does not mean that the small model is superior to the large model (Figure 9). The number of detections by the small model is higher because its accuracy in detecting plastic debris is lower, as represented by the mAP and precision values (Table 2). With low accuracy, the model may misidentify objects that are not plastic debris as plastic debris, resulting in a higher number of detected plastic debris items compared to the large model.
CONCLUSION
This study assessed the UAV imagery along with YOLOv5 model in identifying and monitoring plastic debris in river systems. The findings demonstrate that UAVs provide a flexible and efficient tool for plastic debris detection, enabling rapid monitoring across riverine environments. However, challenges such as the noise of the presence of tall trees along riverbanks increase the risk of drone crashes, requiring careful flight planning compared to coastal or open-water monitoring. YOLOv5_small and YOLOv5_large deep learning model showed big potential for detecting plastic debris but were limited by training dataset characteristics, highlighting the need for refinement. Future research should enhance the backbone, neck, and head structures, optimization of loss functions, enhanced data augmentation techniques, and refined training strategies to improve accuracy and advance AI-driven river plastic monitoring. This study benefits environmental researchers, agencies, and policymakers by advancing UAV-based deep learning for river plastic monitoring, aiding waste management and ecosystem conservation.
ACKNOWLEDGEMENTS
The data used in this contribution was obtained during a field campaign funded by the ASEAN – Norway cooperation project on local capacity building for reducing plastic pollution in the ASEAN region (ASEANO project) via the Center for Southeast Asian Studies (CSEAS) Indonesia.
AUTHOR CONTRIBUTIONS
Conceptualization: Aldiano Rahmadya, Hidayat
Project administration: Hidayat
Data collection: Aldiano Rahmadya, Hidayat, I.S. Hermana
Data processing and Experiments: Aldiano Rahmadya, Z. Zanjabila
Data visualization: Aldiano Rahmadya, Z. Zanjabila
Funding acquisition: Hidayat
Writing: Aldiano Rahmadya, Z. Zanjabila, Fajar Setiawan
CONFLICT OF INTEREST
The author(s) declare(s) that there is no conflict of interest regarding the publication of this article. Authors confirmed that the data and the paper are free of plagiarism.
REFERENCES
Andriolo, U., Gonçalves, G., Rangel-Buitrago, N., Paterni, M., Bessa, F., Gonçalves, L.M.S., Sobral, P., Bini, M., Duarte, D., Fontán-Bouzas, A. et al. 2021. Drones for litter mapping: An inter-operator concordance test in marking beached items on aerial images. Marine Pollution Bulletin. 169: 112542.
Asian Development Bank. 2013. Downstream impacts of water pollution in the upper Citarum river, west Java, Indonesia: Economic assessment of interventions to improve water quality. Water and Sanitation Program. Asian Development Bank, no. October: 1–44. https://www.adb.org/sites/default/files/publication/154493/citarum-river-downstream-impacts-water-pollution.pdf.
Bachir, N., and Memon, Q.A. 2024. Benchmarking YOLOv5 models for improved human detection in search and rescue missions. Journal of Electronic Science and Technology. 22 (1): 100243.
Barnes, D.K.A., Galgani, F., Thompson, R.C., and Barlaz, M. 2009. Accumulation and fragmentation of plastic debris in global environments. Philosophical Transactions of the Royal Society B: Biological Sciences. 364(1526): 1985–1998.
Blacksmith Institute, Green Cross Switzerland. 2013. The worlds worst 2013 : The top ten toxic threats cleanup, progress, and ongoing challenges. Table. http://www.worstpolluted.org/docs/TopTenThreats2013.pdf.
Borrelle, S.B., Ringma, J., Law, K.L., Monnahan, C.C., Lebreton, L., McGivern, A., et al. 2020. Predicted growth in plastic waste exceeds efforts to mitigate plastic pollution. Science. 369(6509): 1515–1518.
Bukit, N.T. 1995. Water quality conservation for the Citarum river in west Java. Water Science and Technology. 31(9): 1–10.
Chen, K., Li, H., Li, C., Zhao, X., Wu, S., Duan, Y., and Wang, J. 2022. An automatic defect detection system for petrochemical pipeline based on Cycle-GAN and YOLO V5. Sensors. 22 (20): 7907.
Cordova, M.R., Nurhati, I.S., Shiomoto, A., Hatanaka, K., Saville, R., and Riani, E. 2022. Spatiotemporal macro debris and microplastic variations linked to domestic waste and textile industry in the supercritical Citarum river, Indonesia. Marine Pollution Bulletin. 175: 113338.
Deidun, A., A. Gauci, S. Lagorio, and F. Galgani. 2018. Optimising beached litter monitoring protocols through aerial imagery. Marine Pollution Bulletin 131: 212–217.
Derraik, J.G.B. 2002. The pollution of the marine environment by plastic debris: A review. Marine Pollution Bulletin. 44 (9): 842–852.
Fallati, L., A. Polidori, C. Salvatore, L. Saponari, A. Savini, and P. Galli. 2019. Anthropogenic marine debris assessment with unmanned aerial vehicle imagery and deep learning: A case study along the beaches of the republic of maldives. Science of the Total Environment 693: 133581.
Geraeds, M., van Emmerik, T., de Vries, R., and Razak, M.S. bin Ab. 2019. Riverine plastic litter monitoring using unmanned aerial vehicles (UAVs). Remote Sensing. 11 (17): 2045.
GESAMP, 2019. Guidelines for the monitoring and assessment of plastic litter in the ocean by joint group of experts on the scientific aspects of marine environmental protection, Gesamp.
Geyer, R., Jambeck, J.R., and Law, K.L. 2017. Production, use, and fate of all plastics ever made. Science Advances. 3(7): e1700782.
Hussain, M. 2024. YOLOv1 to v8: Unveiling each variant-a comprehensive review of YOLO. IEEE Access. 12: 10473783.
Iskandar, M.R., Cordova, M.R., and Park, Y.G. 2022. Pathways and destinations of floating marine plastic debris from 10 major rivers in Java and Bali, Indonesia: A lagrangian particle tracking perspective. Marine Pollution Bulletin. 185(795): 114331.
Jung, H.K. and Choi, G.-S. 2022. Improved YOLOv5: Efficient object detection using drone images under various conditions. Applied Sciences. 12(14): 7255.
Kai, Yan, Li Quanjing, Li Hao, Wang Haifeng, Fang Yuping, Xing Lin, Yang Yang, Bai Haicheng, and Zhou Chengjiang. 2022. Deep learning‐based substation remote construction management and AI automatic violation detection system. IET Generation, Transmission & Distribution. 16(9): 1714-1726.
Kaur, R. and Singh, S. 2023. A comprehensive review of object detection with deep learning. Digital Signal Processing. 132: 103812.
khanam, R. and Hussain, M. 2024. What is YOLOv5: A deep look into the internal features of the popular object detector. ArXiv abs/2407.20892. 3–10.
Kurniawan, H., Arief, M.A.A., Manggala, B., Lee, S., Kim, H., and Cho, B.K. 2024. Advanced Detection of Foreign Objects in Fresh-Cut Vegetables Using YOLOv5. LWT. 212: 116989.
Li, J., Zeng, P., Yue, S., Zheng, Z., Qin, L., and Song, H. 2025. Automatic body condition scoring system for dairy cows in group state based on improved YOLOv5 and video analysis. Artificial Intelligence in Agriculture. 1-13.
Li, L., Zuo, J., Duan, X., Wang, S., Hu, K., and Chang, R. 2021. Impacts and mitigation measures of plastic waste: A critical review. Environmental Impact Assessment Review. 90: 106642.
Li, W., Zhao, W., and Du, Y. 2025. Large-scale wind turbine blade operational condition monitoring based on UAV and improved YOLOv5 deep learning model. Mechanical Systems and Signal Processing. 226: 112386.
Lim, H. S., Lee, Y., Lin, M.H., and Chia, W.C. 2024. Mangrove species detection using YOLOv5 with RGB imagery from consumer unmanned aerial vehicles (UAVs). Egyptian Journal of Remote Sensing and Space Science 27 (4): 645–655.
Marselina, M. and Burhanudin, M. 2017. Trophic status assessment of saguling reservoir, upper Citarum basin, Indonesia. Air, Soil and Water Research. 10(38):117862211774666.
Marselina, M., Rahmi, N.A., and Nurhayati, S.A. 2025. The water quality of the upper Citarum: Applying the overall index of pollution, said-WQI, and pollution index methods. Heliyon. 11(2): e41690.
Martin, C., Parkes, S., Zhang, O., Zhang, X., McCabe, M.F., and Duarte, C.M. 2018. Use of unmanned aerial vehicles for efficient beach litter monitoring. Marine Pollution Bulletin. 131: 662–673.
Mohanty, T., Pattanaik, P., Dash, S., Tripathy, H.P., and Holderbaum, W. 2025. Smart robotic system guided with YOLOv5 based machine learning framework for efficient herbicide usage in rice (Oryza sativa L.) under precision agriculture. Computers and Electronics in Agriculture. 231: 110032.
Okuku, Ochieng, E., Kiteresi, L.I., Owato, G., Mwalugha, C., Omire, J., Otieno, K., Mbuche, M., Nelson, A., Gwada, B., and Mulupi, L. 2020. Marine macro-litter composition and distribution along the kenyan coast: The first-ever documented study. Marine Pollution Bulletin. 159: 111497.
Pikoli, M.R., Astuti, P., Rahmah, F.A., Sari, A.F., and Solihat, N.A. 2022. Biodegradation of microplastics by microorganisms isolated from two mature landfill leachates. Chiang Mai University Journal of Natural Sciences. 21(1): e2022005.
Ragaert, K., Huysveld, S., Vyncke, G., Hubo, S., Veelaert, L., Dewulf, J., and Bois, E.D. 2020. Design from recycling: A complex mixed plastic waste case study. Resources, Conservation and Recycling. 155: 104646.
Rahmadya, A., Hidayat, Aisyah, S., Husrin, S., and Olsen, M. 2022. Monitoring of plastic debris in the lower Citarum river using unmanned aerial vehicles (UAVs). IOP Conference Series: Earth and Environmental Science. 950(1): 012080.
Redmon, J., Divvala, S., Girshick, R., and Farhadi, A. 2016. You only look once: Unified, real-time object detection. Proceedings of the IEEE Computer Society Conference on Computer Vision and Pattern Recognition. 779–788. Las Vegas-USA, 27-30 June 2016.
Shahin, O.R., Gasmi, K., Krichen, M., Alamro, M.A., Mihoub, A., Ammar, L.B., and Tawashi, M.A. 2024. Optimized automated blood cells analysis using enhanced greywolf optimization with integrated attention mechanism and YOLOv5. Alexandria Engineering Journal. 109: 58–70.
Song, K., Jung, J.Y., Lee, S.H., and Park, S. 2021. A comparative study of deep learning-based network model and conventional method to assess beach debris standing-stock. Marine Pollution Bulletin. 168: 112466.
Tang, S., Zhang, S., and Fang, Y. 2024. HIC-YOLOv5: Improved YOLOv5 for small object detection. Proceedings - IEEE International Conference on Robotics and Automation. 6614–6619. Yokohama-Japan, 13-17 May 2024.
Tu, S., Cai, Y., Liang, Y., Lei, H., Huang, Y., Liu, H., and Xiao, D. 2024. Tracking and monitoring of individual pig behavior based on YOLOv5-byte. Computers and Electronics in Agriculture. 221: 108997.
Wang, M., Yang, W., Wang, L., Chen, D., Wei, F., KeZiErBieKe, H.L.T., and Liao, Y. 2023. FE-YOLOv5: Feature enhancement network based on YOLOv5 for small object detection. Journal of Visual Communication and Image Representation. 90.
Wang, Z., Men, S., Bai, Y., Yuan, Y., Wang, J., Wang, K., and Zhang, L. 2024. Improved small object detection algorithm CRL-YOLOv5. Sensor. 24(19): 6437.
Xiang, W., Wu, D., and Wang, J. 2025. Enhancing stem localization in precision agriculture: A two-stage approach combining YOLOv5 with EffiStemNet. Computers and Electronics in Agriculture. 231: 109914.
Xiao, K., Li, R., Lin, S., and Huang, X. 2024. Enhancing eco-sensing in aquatic environments: Fish Jumping behavior automatic recognition using YOLOv5. Aquatic Toxicology. 277: 107137.
Zhai, M., Zhang, H., Wang, L., Xiao, D., Gu, Z., and Li, Z. 2024. Special vehicle target detection and tracking based on virtual simulation environment and YOLOv5-block+deepsort algorithm. Computers, Materials and Continua. 81(2): 3241–3260.
OPEN access freely available online
Natural and Life Sciences Communications
Chiang Mai University, Thailand. https://cmuj.cmu.ac.th
Aldiano Rahmadya1, *, Zanjabila2, Hidayat1, Indra Setiadi Hermana1, and Fajar Setiawan1
1 Research Centre for Limnology and Water Resources, National Research and Innovation Agency - BRIN, Bogor, 16911, Indonesia.
2 Ajari Technologies, Jakarta, 13460, Indonesia.
Corresponding author: Aldiano Rahmadya, E-mail: aldi004@brin.go.id
ORCID: Aldiano Rahmadya: https://orcid.org/0000-0002-8428-1780
Total Article Views
Editor: Sirasit Srinuanpan,
Chiang Mai University, Thailand
Article history:
Received: November 16, 2024;
Revised: March 1, 2025;
Accepted: March 6, 2025;
Online First: March 19, 2025