
Determine the Balance of Nitrogen, Potassium, and Silicon Fertilization for the Control of Rice Tungro Disease Using Response Surface Methodology
NurulNahar Esa*, Mohd Fitri Masarudin, Maisarah Mohamad Saad and Siti Norsuha MismanPublished Date : November 11, 2024
DOI : https://doi.org/10.12982/NLSC.2025.002
Journal Issues : Number 1, January-March 2025
Abstract This study evaluates the efficacy of combined N, K, and Si treatments to find the balance of these three elements for tungro disease control and rice grain production. The study was conducted in a pot under a glasshouse. These elements were chosen as several findings have indicated the positive benefits of nitrogen (N), potassium (K), and silicon (Si) fertilization on plant development, yield, and biotic stress relief. The methods used were central composite design and response surface methodology. Complete and balanced nutrition has always been the first line of defense for plants due to the direct involvement of mineral elements in plant protection. The results showed that rice tungro disease could be controlled with 138:42:62:200 (N:P2O5:K2O:Si). A high rate of nitrogen is needed to reduce disease development. The results on N may explain that not all conditions of rice plants are at risk with high N rates. Adding Si fertilizer contributes to plant defense mechanisms and plays a role in yield formation. In contrast, the balance of fertilizer for maximizing grain yield per plant was found to be not dependent on nitrogen but needed either low K (62 kg K2O/ha) or high K (80 kg K2O/ha) but with moderate Si (150 kg Si/ha). Prioritizing tungro disease control and adopting the rate of N:K2O:Si (138:62:200), it was found that there was a yield reduction of an average of 7.7%.
Keywords: Rice, Agriculture, Grain yield, Fertilization
Funding: The Rancangan Malaysia ke-12 development fund, P21400010170501, fully supports this research. The authors are grateful for the research funding provided by the Ministry of Agriculture and Food Security (KPKM) and the Malaysian Agricultural Research and Development Institute, which makes this important research viable and effective.
Citation: Esa, N., Masarudin, M. F., Saad, M. M. and Misman, S. N. 2025. Determine the balance of nitrogen, potassium, and silicon fertilization for the control of rice tungro disease using response surface methodology. Natural and Life Sciences Communications. 24(1): e2025002.
INTRODUCTION
Rice is the world's second most extensively farmed cereal crop, and more than half of its population eats rice as a staple diet, which is farmed mainly in Asia, accounting for about 90 percent of global rice output (Firdaus et al., 2020; Siwar et al., 2014). In Malaysia, rice plantations have received more subsidies than other crops because rice is the nation's staple food, with roughly two billion ringgits in subsidies, incentives, and assistance (Rahmat et al., 2019). Food security is under the pressure of world population growth, increasing demand for food, scarcity of water and land resources, and new plant and animal diseases that will disadvantage global food security (Kwasek, 2012). Threats to plant health pose difficulties for population health, productivity, and prosperity around the globe. Consequently, plant diseases affect food availability and security through reduced yield and plant mortality. Global yield losses of essential staple crops can range up to 30 percent and hundreds of billions of dollars in lost food production (Rizzo et al., 2021). Plant disease outbreaks are increasing and threaten food security for the vulnerable in many areas of the world, leading to lower crop yields and reduced food stockpiles within countries. They can pose shocks to agricultural productivity that contribute to food price spikes, pushing millions into hunger (Ristaino et al., 2021).
The current importance of rice diseases and rice yield-reducing factors in Southeast and South Asia indicates that yield-reducing factors cause 37% of losses. Among these, three diseases are responsible for losses of 5% or more each: sheath blight, brown spot, and blast. This is, on average, much more than insect-related losses caused by leaf-feeding insects (2.7%) but much less than weed infestation (20%) (Zeigler and Savary, 2010). However, Tatineni and Hein (2023) mentioned that among virus diseases of rice, rice tungro disease in Southeast Asia, East Asia, and the Indian subcontinent is economically crucial because it could cause 70 to 90% yield losses. The disease is caused by the Rice tungro spherical virus (RTSV) and the Rice tungro bacilliform virus (RTBV) (Lestiyani, 2022) and is transmitted by green leafhoppers (GLH), Nephotettix virescens (Dist.) (Jamaloddin et al., 2021) and can be spread by adults and nymphs (Azzam et al., 2000). These two viruses cooperate to allow disease progression and complete symptom expression. When plants are infected at an early growth stage, few tillers are generated, root development is poor, and stunting is quite severe. Small panicles grow on severely infected rice plants, frequently producing malformed and unviable grain (Azzam and Chancellor, 2002). Significant protection against tungro disease is the use of insecticides in order to control N. virescens, but the primary strategy is to grow tungro resistant varieties. However, because of high disease pressure and often, varieties with vector resistance were easily broken down by tungro as the vector population adapted to the environments (Bunawan et al., 2014). In addition, the development of varieties using gamma radiation can be used for plant mutation breeding, which leads to the creation of new plant varieties that are more resistant to biotic and abiotic stress (Puripunyavanich et al., 2021). It is vital to note that, while this irradiation technology is dependent on chance, good results can be reached if it is targeted and linked to biotechnology approaches (Riviello-Flores et al., 2022). Chemical control has been widely used in agriculture, which has a positive or negative impact, but food safety issues have raised global health concerns with frequent chemical uses that cause contamination of food products and adversely affect human health (Manggala et al., 2023). On the other hand, according to many studies, nitrogen, phosphorus, potassium, and silicon can affect the disease incidence in rice in various ways depending on the type, quantity, and interactions between the host and pathogen. These nutrients aid in the plant's ability to resist disease by promoting optimal growth that will allow it to withstand infection or enhance its resistance (Jehangir et al., 2022).
Nutrients are essential for plant growth and development, whereas nitrogen (N) and potassium (K) are the most critical nutrients for plants and are the primary macronutrients (Shrestha et al., 2020). Nitrogen is an essential plant nutrient since it is required for photosynthesis, growth and development, rice yield, quality, and biomass (Zhang et al., 2020). Potassium is active in dozens of essential enzymes, such as protein synthesis, sugar transport, N metabolism, and photosynthesis, ensuring optimal plant growth (Xu et al., 2020). Cultural practices such as optimum fertilization of N and K could induce disease tolerance in plants (Manzoor et al., 2017). Many studies have demonstrated the advantages of nutrition with Si on crop growth, development, and health, even though it is not often regarded as an essential nutrient for plants. Silicon has been linked in numerous studies to the activation of plant defense systems. However, the precise nature of the relationship between this element and the biochemical pathways that regulate resistance is yet unknown (Romero, 2011). By adding Si to the soil, foliar silicon concentration rises, resulting in the deposition of amorphous silica as a mechanical barrier between the cuticle layer and the epidermis layer in foliar cells (de Souza et al., 2021). The mechanical barrier is believed to increase the plant's disease resistance, limit damage from insects and grazing animals, and reduce transpirational water loss (Singh et al., 2022). In addition, Si can induce resistance by translocating silicic acid and trigger periodic signals such as salicylic acid (SA), jasmonic acid (JA), and ethylene (ET) inside the plant cells that can finally induce defense responses (Ghosh and Ganguly, 2022). Based on research findings indicating positive impacts, silicon is used more frequently in crop cultivation procedures because it can alleviate environmental stresses in sustainable crop production (Kovács et al., 2022). Regardless of how vital these nutrients are to rice growth and yield development, under the specific scenario, fertilizer treatments favored disease attacks (Shrestha et al., 2020). Based on previous N, K, and Si studies, these nutrients are essential in crop yield production and plant disease protection mechanisms. Interaction among plant nutrients can create antagonistic or synergistic consequences that influence crop performances; therefore, understanding nutrient interactions can assist fertilizer design and optimization for fertilization approaches (Rietra et al., 2017). However, we need to learn more about the combined effects of these three nutrients (N, K, and Si) on rice tungro disease in Malaysian rice cultivation. This study evaluates the efficacy of combined N, K, and Si treatments on agronomic parameters and rice tungro disease in controlled environments.
MATERIAL AND METHODS
Experimental materials and design
The rice seed was sown in a pot (25 cm height x 25 cm diameter at the top and 20 cm diameter at the bottom) filled with 8 kg of soil, preceded by seed treatment through soaking (24 hours) and pre-germination (one day before sowing). Each pot was sown with ten seeds of the MARDI Siraj 297 high-yielding variety that was moderately susceptible to tungro disease. All the pots were arranged under the greenhouse at a distance of 30 cm from each other. Glasshouse trials were performed in 2021 and 2022 at the Rice Research Centre, MARDI, Seberang Perai, Pulau Pinang Malaysia.
The experiment was arranged in a randomized complete block design replicated three times. Glasshouse trials were conducted using N (Urea 46%), K (MOP 60%), and Si (25%) at five levels (Table 1). Based on the input factors and their levels listed in Table 1, the experiments were conducted by a three-factor orthogonal quadratic rotation combination design was used to apply the N, K, and Si treatments (Table 2). The orthogonal design method was constructed to represent the sampled set of combinations which evenly distribute over the experiment space and this was done by Design Expert Software (StatEase V.13). A standard of 42 kg P2O5 was applied for all treatments. The experiment was repeated for two planting cycles. Application of nitrogen was done in three splits; 20%, 30%, and 50% at 15, 35, and 55 days after sowing, respectively. Applications of phosphorous and potassium were both applied 15 days after sowing (100%). Silicon fertilizer was applied 55 days after sowing (100%).
Table 1. Coding design table each N, K and Si factor level.
|
Level |
N (kg/ha) |
K (kg/ha) |
Si (kg/ha) |
|
Code mark |
X1 |
X2 |
X3 |
|
Star on the arms (+1.68) |
149.56 |
86.12 |
234.00 |
|
Upper level (+1) |
138.00 |
80.00 |
200.00 |
|
Zero level (0) |
121.00 |
71.00 |
150.00 |
|
Lower level (-1) |
104.00 |
62.00 |
100.00 |
|
Under the arms (-1.68) |
92.44 |
55.88 |
66.00 |
|
Change interval |
28.56 |
15.12 |
84.00 |
Table 2. Quadratic orthogonal rotation combination design.
|
Treatment |
N (kg/ha) |
K (kg/ha) |
Si (kg/ha) |
|
1 |
104.00 |
62.00 |
200.00 |
|
2 |
121.00 |
71.00 |
150.00 |
|
3 |
138.00 |
62.00 |
200.00 |
|
4 |
104.00 |
80.00 |
100.00 |
|
5 |
138.00 |
62.00 |
100.00 |
|
6 |
121.00 |
71.00 |
150.00 |
|
7 |
121.00 |
71.00 |
150.00 |
|
8 |
121.00 |
71.00 |
150.00 |
|
9 |
138.00 |
80.00 |
200.00 |
|
10 |
121.00 |
71.00 |
150.00 |
|
11 |
92.40 |
71.00 |
150.00 |
|
12 |
121.00 |
71.00 |
150.00 |
|
13 |
104.00 |
80.00 |
200.00 |
|
14 |
121.00 |
71.00 |
150.00 |
|
15 |
121.00 |
71.00 |
234.00 |
|
16 |
149.60 |
71.00 |
150.00 |
|
17 |
121.00 |
71.00 |
150.00 |
|
18 |
121.00 |
86.10 |
150.00 |
|
19 |
121.00 |
71.00 |
150.00 |
|
20 |
121.00 |
55.90 |
150.00 |
|
21 |
138.00 |
80.00 |
100.00 |
|
22 |
121.00 |
71.00 |
150.00 |
|
23 |
121.00 |
71.00 |
150.00 |
|
24 |
121.00 |
71.00 |
66.00 |
|
25 |
104.00 |
62.00 |
100.00 |
Tungro disease inoculation and disease assessment
Infected rice plants by tungro virus disease in the field were used as a source to propagate tungro-diseased plants by uprooting and transplanting them in pots. The tungro-diseased plants containing RTBV and RTSV were maintained at the Entomology Glasshouse, Rice Research Centre, MARDI Seberang Perai, Pulau Pinang, Malaysia. A set of rice tungro-disease plants was prepared under the confine cages, allowing a newly emerged adult population of green leaf hopper (GLH) insects to feed on plants infected with the tungro for four days. The process to ensure the culture of the tungro virus was transmitted to green leaf hoppers (GLH) as a vector. In a pot that was well prepared early with MARDI Siraj 297 (18 days old), the 30-day-old GLH was then released in the cage at an average of ten insects per pot for 2 days of inoculation (allowed to feed on free-infected plants). The inculcation cages were covered with transparent plastic cages, so GLH would not move away from the seedling. According to the Standard Evaluation System of Rice (IRRI, 2013). The disease scoring was done after seven days of disease inoculation on the symptoms of plants yellow to yellow-orange leaves, stunting, and wilting.
Measurement of rice grain yield and yield components
The number of panicles from each pot was used to calculate the average panicle number per treatment. Measurements were recorded 60 days after sowing. A total number of filled and unfilled grains per panicle was selected from each pot from the main tiller to calculate the percentage of filled grains (%). The filled grain was calculated by the number of filled grains divided by the total number of grains and multiplied by hundred (%).
A total of 1000 grains from each plot were selected randomly and weighted with a portable automatic electronic balance at 14% moisture content to calculate the 1000-grain weight, and expressed in grams (g).
The total grain weight per pot was calculated based on the net weight of the filled grains based on 14% moisture content.
Statistical analysis
Statistical analysis was performed by Design Expert Software (StatEase V.13). The tungro disease data were analyzed by combining the data of the pot study conducted in 2021 and 2022 and taking the average. This study is more interested in knowing the response based on the disease score according to days after sowing. Meanwhile, the rice yield component data was analyzed with the year (planting cycle) as a term included in the model.
RESULTS
Effect of N, K and Si on rice tungro disease
The analysis of variance of the experimental data suggested a significant quadratic model for the tungro disease score, which indicates the value of Prob. > F for the model is less than 0.05. The significant model analysis is desirable because the terms in the model significantly affect the response (disease score). The significant effects were days after sowing, nitrogen, and silicon. In addition, the interaction between potassium and silicon was also a significant model term. Similarly, the polynomial quadratic of silicon was also a significant model term. Other model terms (potassium, other interactions) were not significant. The lack of fit is insignificant relative to the pure error. A non-significant lack of fit is good because the model could be fit. These insignificant model terms can be removed and may result in an improved model, and this can be done by selecting the backward elimination procedure to reduce the terms that are not significant automatically. The final result of the ANOVA table for the reduced quadratic model for tungro score disease is presented in Table 3.
Table 3. ANOVA table for reduced quadratic model response on tungro disease score.
|
Source |
df |
Mean Square |
F-value |
P-value |
|
Model |
15 |
37.60 |
272.86 |
< 0.0001 |
|
A-Days after sowing |
10 |
55.81 |
404.99 |
< 0.0001 |
|
B-Nitrogen |
1 |
1.67 |
12.10 |
0.0006 |
|
C-Potassium |
1 |
0.10 |
0.77 |
0.3810 |
|
D-Silicon |
1 |
0.91 |
6.61 |
0.0107 |
|
CD |
1 |
1.31 |
9.53 |
0.0022 |
|
D2 |
1 |
1.31 |
9.47 |
0.0023 |
|
Residual |
259 |
0.13 |
- |
- |
|
Lack of Fit |
148 |
0.13 |
0.91 |
0.7040 |
|
Pure Error |
111 |
0.14 |
- |
- |
|
Cor Total |
274 |
- |
- |
- |
Based on the graph, the increasing disease score from the tillering (30 DAS) to maturity (100 DAS) stage indicates the severity of tungro disease affecting the growth of rice plants (Figure 1). An increase in disease score was related to yellowing and stunted plant growth. It can also be observed that there are two peaks where the disease score increases sharply on day 51 and then decreases until day 58 before rising sharply on day 79. In the following days, the increase in disease score is slower. An increase in N application significantly reduced the disease score (Figure 2). The results show that low N levels have the potential to be more easily attacked by tungro disease. These results also directly indicate that high levels of N are needed to control disease attacks caused by tungro viruses.
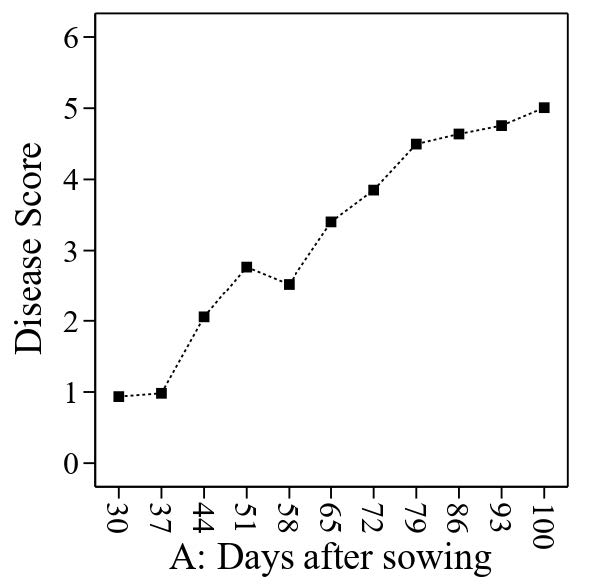
Figure 1. Effect of tungro disease (disease score) on the growth of rice plants.
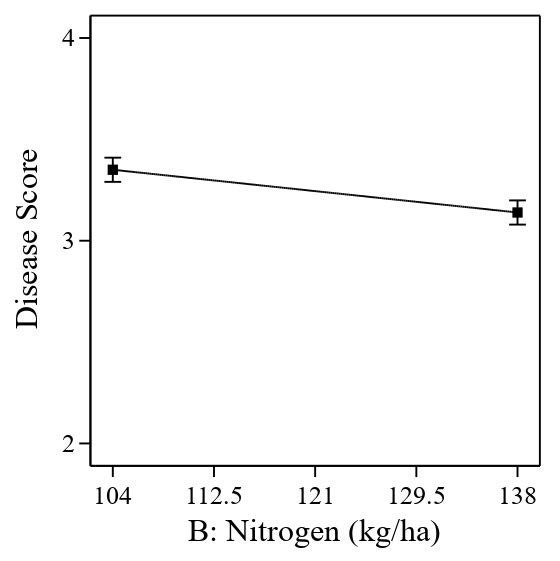
Figure 2. Effect of nitrogen application on tungro disease score.
The significant interaction between K and Si (Figure 3) showed that the spread of the points on the right side of the graph was smaller than the spread between the points on the left side. In other words, the effect of a high K rate was less significant compared to a low rate of K, but it depends on the amount of Si applied. It now becomes apparent that a low rate of K requires a high rate of Si (the red line), and vice versa; at a high rate of K, the amount needed to control tungro disease needs a low rate of Si (the black line).
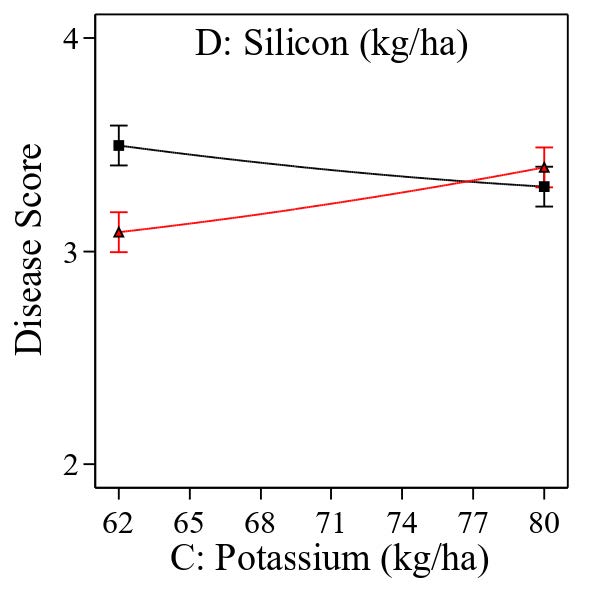
Figure 3. Interaction between potassium and silicon on rice plants tungro disease score.
The significant quadratic polynomial of Si is presented in Figure 4. The graph showed that the quadratic has one depression, which is the minimum rate of Si at a range of 165 kg/ha to 175 kg/ha (blue vertical line), which could benefit in controlling tungro disease. A higher or lower than the range provided could increase the severity of the tungro disease.
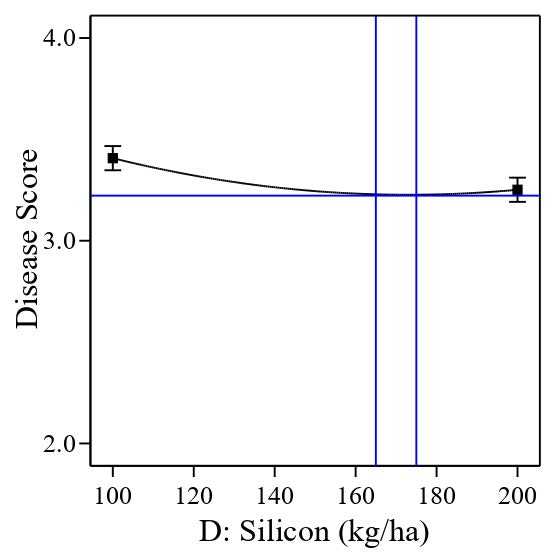
Figure 4. Significant quadratic polynomial of Silicon application on rice plants tungro disease score.
Nitrogen and potassium are vital for optimum plant growth, development, and productivity. In comparison, silicon is considered a beneficial element. The current study indicates that the increase in nitrogen rate could control the disease. In contrast, depending on one of the rates used, the interaction between silicon and potassium may affect the disease score. The 3D surface graph could determine the relationship between these three elements. After optimization of the 3D graph by determining the N level from the lowest rate to the highest rate, it was found that the severity of the disease score can be reduced with the highest N rate (Figure 5). The results based on the 3D response surface for disease score show that the balance fertilization for controlling tungro disease was at 138 kg N/ha, 62 kg K2O/ha, and 200 kg Si/ha.
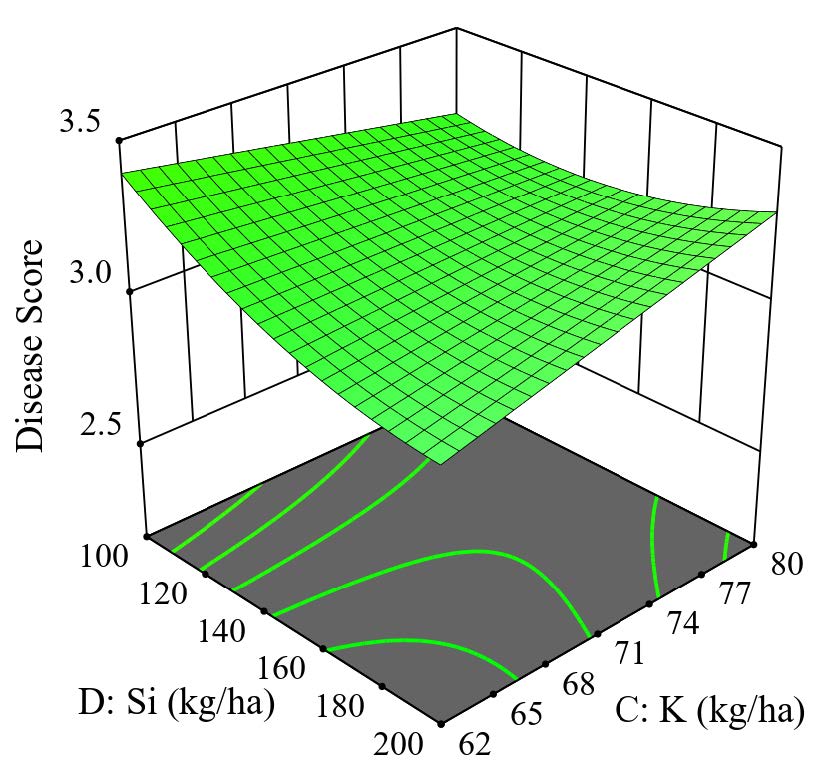
Figure 5. 3D surface graph for tungro disease score.
Effect of N, K and Si on spikelet number per panicle
The value of Prob. > F in Table 4 for the model was higher than 0.05, which indicates that the model was insignificant. Insignificant model terms are not desirable as they indicate that the terms in the model do not significantly affect the response (spikelet number per panicle). Thus, there was no real relationship between the factors (N, K, and Si), and the response could be investigated.
Table 4. ANOVA table for response surface model for spikelet per panicle.
|
Source |
df |
Mean Square |
F-value |
P-value |
|
Model |
4 |
186.42 |
1.57 |
0.1827 |
|
A-Year |
1 |
442.04 |
3.73 |
0.0548 |
|
B-Nitrogen |
1 |
61.06 |
0.51 |
0.4736 |
|
C-Potassium |
1 |
205.15 |
1.73 |
0.1896 |
|
D-Silicon |
1 |
37.42 |
0.31 |
0.5746 |
|
Residual |
195 |
118.41 |
- |
- |
|
Lack of Fit |
25 |
104.58 |
0.86 |
0.6484 |
|
Pure Error |
170 |
120.45 |
- |
- |
|
Cor Total |
199 |
- |
- |
- |
Effect of N, K and Si on filled grain (%)
The analysis of variance of the experimental data suggested a linear model for filled grain (%), and the ANOVA analysis is presented in Table 5. In this case, A (year) is a significant model term. P-values greater than 0.1 indicate that the model terms are insignificant (nitrogen, potassium, and silicon). The filled grain percentage was significantly higher in 2022 (62%), compared to 2021 (51%), by an average of 21.6% (Figure 6).
Table 5. ANOVA table for response surface model for filled grain (%).
|
Source |
df |
Mean Square |
F-value |
P-value |
|
Model |
4 |
1182.60 |
15.48 |
< 0.0001 |
|
A-Year |
1 |
4678.75 |
61.24 |
< 0.0001 |
|
B-Nitrogen |
1 |
21.24 |
0.27 |
0.5987 |
|
C-Potassium |
1 |
49.81 |
0.65 |
0.4206 |
|
D-Silicon |
1 |
10.53 |
0.13 |
0.7109 |
|
Residual |
179 |
76.40 |
- |
- |
|
Lack of Fit |
25 |
88.49 |
1.19 |
0.2567 |
|
Pure Error |
154 |
74.18 |
- |
- |
|
Cor Total |
183 |
- |
- |
- |
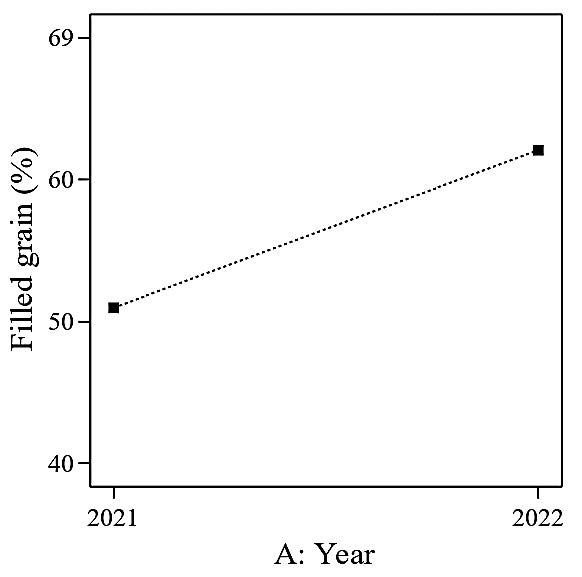
Figure 6. The effect of different planting cycle (Year) on filled grain (%).
Effect of N, K and Si on 1,000-grain weight (g)
The analysis of variance of the experimental data suggested a linear model for the 1,000-grain weight (g), and the ANOVA analysis is presented in Table 6. In this case, A (year) is a significant model term. P-values greater than 0.1 indicate that the model terms are insignificant (nitrogen, potassium, and silicon). The 1,000-grain weight (g) was significantly higher in 2021 (23.4 g) compared to 2022 (22.7 g) by an average of 3.1% (Figure 7).
Table 6. ANOVA table for response surface model for 1,000-grain weight (g).
|
Source |
df |
Mean Square |
F-value |
P-value |
|
Model |
4 |
6.90 |
3.66 |
0.0067 |
|
A-Year |
1 |
27.19 |
14.43 |
0.0002 |
|
B-Nitrogen |
1 |
0.19 |
0.10 |
0.7457 |
|
C-Potassium |
1 |
0.15 |
0.08 |
0.7773 |
|
D-Silicon |
1 |
0.06 |
0.03 |
0.8521 |
|
Residual |
179 |
1.88 |
- |
- |
|
Lack of Fit |
25 |
2.30 |
1.26 |
0.1942 |
|
Pure Error |
154 |
1.82 |
- |
- |
|
Cor Total |
183 |
- |
- |
- |
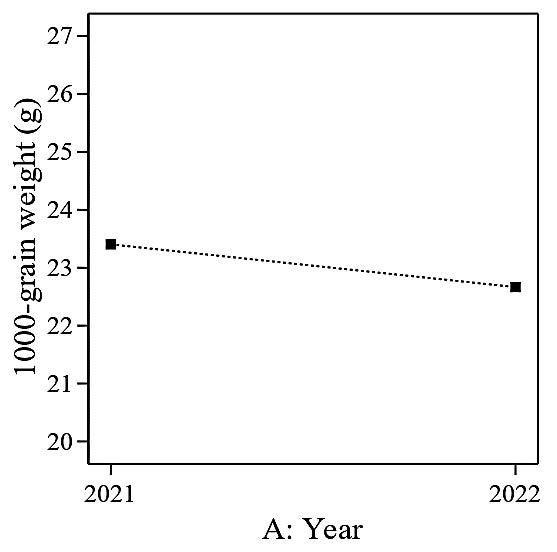
Figure 7. Effect of different planting cycle (Year) on 1,000-grain weight (g).
Effect of N, K and Si on net grain weight per plant
The analysis of variance of the experimental data suggested a significant quadratic model for net grain weight per plant, which indicates the value of Prob. > F for the model is less than 0.05. The significant terms were a year (two planting cycles), the interaction between year and potassium, the polynomial quadratic of potassium, and the polynomial quadratic of silicon. Other model terms, such as nitrogen, potassium, silicon, or other interactions, were insignificant. The lack of fit is insignificant relative to the pure error. A non-significant lack of fit is good because the model could be fit. A similar procedure by selecting the backward elimination to automatically reduce the terms that are not significant to the model is presented in the final ANOVA table presented in Table 7.
Table 7. ANOVA table for reduced quadratic model response on grain weight per plant.
|
Source |
df |
Mean Square |
F-value |
P-value |
|
Model |
7 |
0.5440 |
5.89 |
< 0.0001 |
|
A-Year |
1 |
2.0900 |
22.60 |
< 0.0001 |
|
C-Potassium |
1 |
0.0085 |
0.09 |
0.7617 |
|
D-Silicon |
1 |
0.0108 |
0.11 |
0.7327 |
|
AC |
1 |
0.5112 |
5.53 |
0.0198 |
|
AD |
1 |
0.3210 |
3.48 |
0.0641 |
|
C2 |
1 |
0.4713 |
5.10 |
0.0252 |
|
D2 |
1 |
0.4626 |
5.01 |
0.0266 |
|
Residual |
167 |
0.0924 |
- |
- |
|
Lack of Fit |
22 |
0.0554 |
0.56 |
0.9404 |
|
Pure Error |
145 |
0.0980 |
- |
- |
|
Cor Total |
174 |
- |
- |
- |
Results from Table 7 indicate that the model is still significant, but the main effect of nitrogen has been removed, showing that nitrogen does not contribute to the net grain weight per plant. The significant interaction between year and potassium and between year and silicon may indicate the possibility of heat and humidity changes in the glasshouse. Based on Table 7, a low potassium rate (62 kg/ha, black line) almost does not indicate any effect between the two planting cycles studied (2021 and 2022), but a high potassium rate (80 kg/ha, red line) had changes in net grain weight per plant (Figure 8). A similar result was found for silicon. A low rate of silicon (100 kg/ha, black line) had slight changes, but a high silicon rate (200 kg/ha, red line) had more effect on net grain weight per plant (Figure 9).
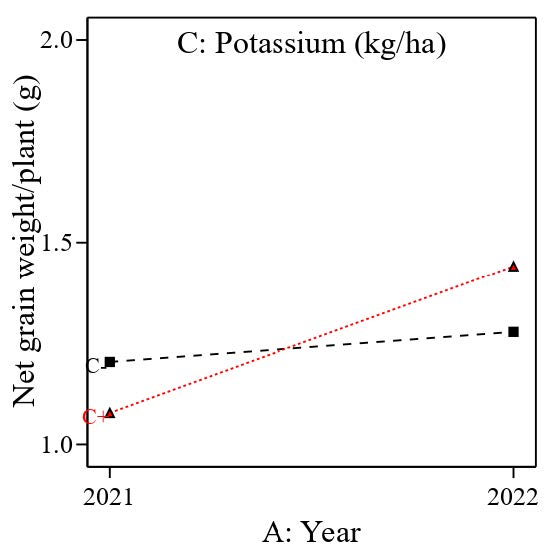
Figure 8. Interaction effect between different planting cycle (year) and potassium on net grain weight per plant (g).
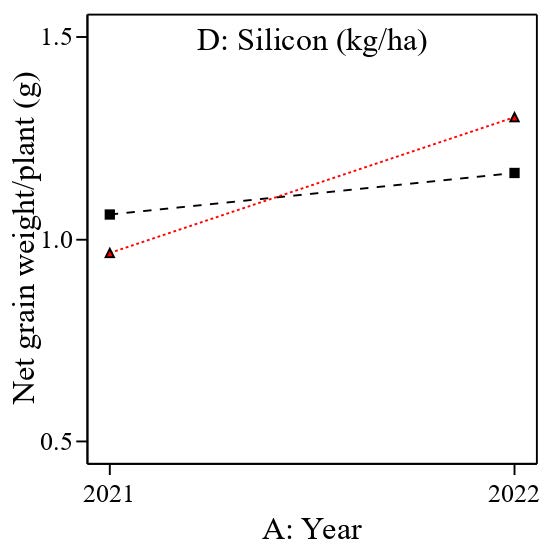
Figure 9. Interaction effect between different planting cycle (year) and silicon on net grain weight per plant (g).
The significant quadratic polynomial of potassium (Figure 10) indicates that the depressions range between 69 kg/ha and 72 kg/ha (vertical blue lines) and could result in lower net grain weight per plant. On the other hand, a significant quadratic polynomial of silicon shows that the peak range between 148 kg/ha and 158 kg/ha could maximize the net grain weight per plant (Figure 11).
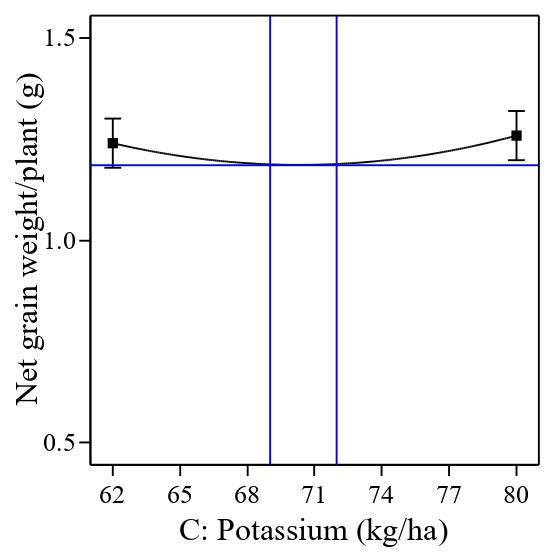
Figure 10. Effect of quadratic polynomial of potassium on net grain weight per plant (g).
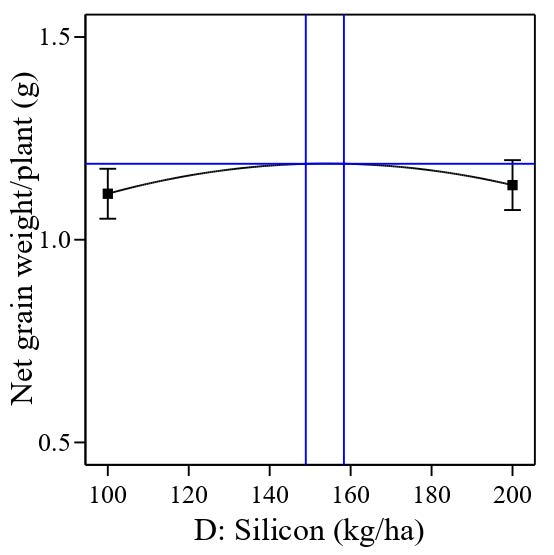
Figure 11. Effect of quadratic polynomial of silicon on net grain weight per plant (g).
Overall, the response surface method (RSM) shows that the net grain weight per plant is independent of N. In contrast, using K shows a quadratic polynomial with depressions, while using Si shows a quadratic polynomial with peaks. 3D optimization combining these three fertilizers shows that the maximum yield of net grain weight can be achieved either at a low K rate (62 kg/ha) or a high rate (80 kg/ha) with an additional 150 kg Si/ha. As N did not significantly contribute to grain production, a low rate of N at 104 kg/ha could be suggested (Figure 12).
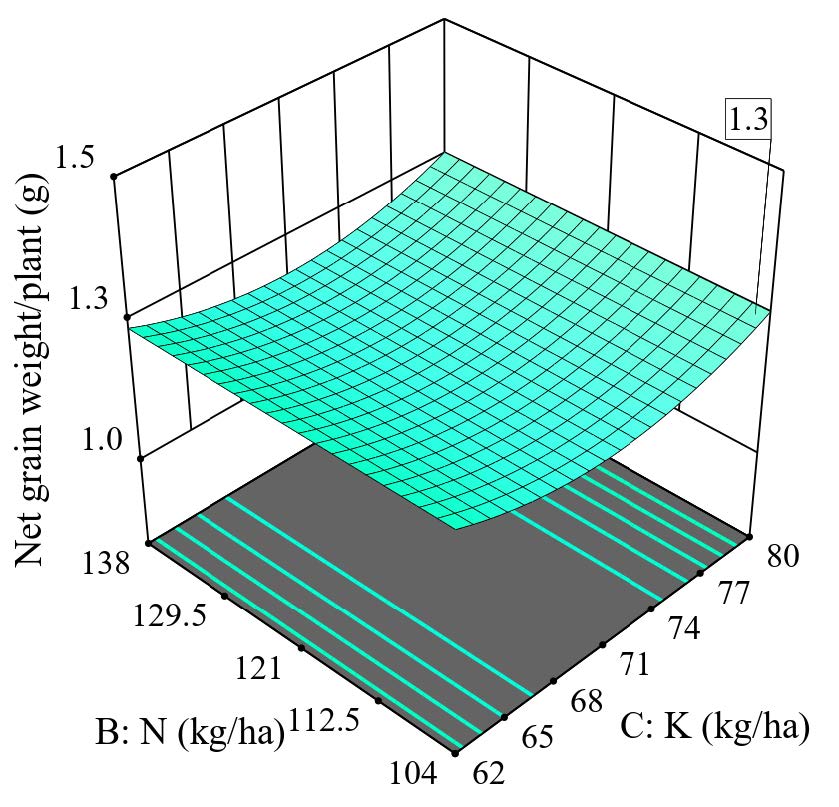
Figure 12. 3D surface graph for net grain weight per plant.
DISCUSSION
Rice tungro disease causes severe damage because farmers mistake the tungro symptoms for a lack of nutrients or other rice diseases. According to Salwani et al., (2013), applying a high amount of nitrogen fertilizer increases the probability of tungro disease occurrence, so it is often too late to control it, which contradicts our finding that high levels of N significantly lower the disease score. In the context of nitrogen and plant fungal disease management, the excessive use of N fertilization in plants promotes a high level of foliar nitrogen that provides a pathogen resource of nutrients for growth and reproduction and decreases the production of defensive compounds in the plant, allowing the pathogenic fungi to more easily infect the plants (Luo et al., 2021). A high N fertilizer promotes fungal virulence enough to override such elevation of plant defenses, and consistently high N is associated with an increase in susceptibility to biotrophic and hemibiotrophic pathogens (Jeon, 2019). Nazarov et al., (2020) reported that viral infections often require damaged tissues or specialized structures (e.g., stomata) to enter the cell or through a vector. Once the virus enters the vascular system, it moves passively through the phloem sieve tubes with the flow of substances and infects all the plant cells. The green planthopper (Nephotettix virescens) is known to cause damage to rice plants by sucking rice fresh fluid and the vector virus of tungro disease (Abdullah et al., 2021). In the case of other species of Nephotettix cincticeps, a prevalent rice pest, during the sucking process, it injects gelling and watery saliva into the plant tissues, which are believed to interact with plant cell constituents and play essential roles in overcoming host plant defense responses (Matsumoto and Hattori, 2018). In general, rice plants attacked by GLH need to defend against damage due to the effects of GLH itself and the secondary impact of the tungro virus (if GLH is the carrier or vector) entering the rice plant. In this study, we believe the increase in tungro disease scores with the increase in rice growth stages (30 - 100 DAS) with the highest disease score of 5.0 but still lower than the standard IRRI score of 7 and 9 (more severe symptoms) could be because the plant needs to control damage from GLH attacks and at the same time reduce the virus infection spreading within the plant's cell. Two mechanisms could be proposed for how the rice plant lowers the severity and controls the damage. First, we suggest that the significant increase of N in reducing the disease score was through the development of plant compounds with antimicrobial properties containing low-molecular-weight non-protein substances classified into phytoanticipins (saponins, phenylpropanoids, alkaloids, cyanogenic glycosides, and glucosinolates) and phytoalexins. Phytoalexins are phenylpropanoids, alkaloids, and terpenes formed in response to a pathogenic attack (Nazarov et al., 2020). This could be similar to a reduction in low-molecular-weight compounds (soluble sugar) because adequate K supply to the plant has been found to correlate with being less susceptible to disease incidence (Tripathi et al., 2022). In addition, K sufficiency in plants has been associated with higher cell-membrane resistance, lowering the risk of pathogenic attacks (Sardans and Peñuelas, 2021). K strengthens plant cell walls and is involved in the lignification of sclerenchyma tissues (Dobermann and Fairhurst, 2000). The second mechanism is believed to be the act of Si that is mainly deposited in the epidermal cells forming silicified cells, and a cuticle-Si double-layer structure, which can enhance the mechanical strength and stability of the host plant cell wall, thereby delaying and resisting the invasion and expansion of pathogens (Li et al., 2022). In addition, the thickness of the leaf's epidermis, the curding of feathers, and the roughness of the leaves could prevent tungro vector (GLH) infestation (Muazam et al., 2021) and, according to Khaerana and Gunawan (2019) Si could be used to increase the leaf epidermis thickness to prevent the infestation. This study also shows that a high N rate is a must as a control measure, and it is different from most reports that state that a high N increases the risk of disease attacks (mainly due to fungal and bacteria infections) and pests. The optimization of high N (138 kg/ha) with balanced fertilization of 62 kg K/ha and 200 kg Si/ha significantly improves the plant against tungro disease. However, it can be controlled more effectively by carrying out additional studies by increasing the N rate above 138 kg/ha, minimizing the K rate below 62 kg/ha, and increasing the Si rate above 200 kg/ha. The elements Si and K were antagonistic in the plants' root and stem wheat, and an increase in Si content in the root and stem hampered the K content of both plant parts, except in reproductive regions, which showed a synergism effect (Mukhomorov and Anikina, 2011). In this study, the same principle may occur in rice plants with the antagonistic effect between silicon and potassium in reactions to tungro disease infection.
A series of studies conducted using MARDI Siraj 297 with different fertilizer treatments showed that there was no difference in spikelets per panicle or the number of spikelets per square meter (NurulNahar et al., 2023a, NurulNahar et al., 2023b; NurulNahar et al., 2023c). Spikelet number was influenced by temperatures rather than nutrient application (Yoshida, 1973; Jagadish et al., 2007; de Souza et al., 2017). In addition, Lakitan et al. (2020) found that the use of NPK fertilizers does not provide any benefits to black glutinous rice reproductive traits, which they suggested could be predominately regulated by genetic factors. According to Engku Hasmah et al., (2021) rice production in Malaysia is exceptionally vulnerable to environmental changes, and any increases in average temperature or above the optimal temperatures at the reproductive and grain filling stages are crucial as they significantly produce low grain yield production. In addition, the temperature at the flowering to grain formation stages greatly impacted rice grain yield (Kulyakwave et al., 2020). In this study, no effect of using nitrogen, potassium, or silicon can be confirmed, indicating that nutrient factors do not contribute to spikelet production.
The non-structural carbohydrate (NSC) stored in rice stems is the carbon source for grain filling (Wakabayashi et al., 2022). Rice grains primarily consist of starch, synthesized from non-structural carbohydrates, which plays a remarkable role in maintaining the supply of photoassimilates during grain filling (Costa et al., 2021). NSCs comprise soluble sugars (such as glucose, fructose, and sucrose) and starch (Huang et al., 2023). A cucumber mosaic virus (CMV) case study in melon (Cucumis melo L.) Shalitin and Wolf, (2000) found that CMV infection altered carbohydrate metabolism and inhibited starch accumulation and/or starch degradation due to increased demand for soluble sugars to maintain a high respiration rate because of severe symptoms of leaf necrosis. Hence, it is believed that the tungro disease infection causes severe yellowing symptoms in rice leaves, may interrupt photosynthesis, and as a result, disrupts the non-structural carbohydrate formation that limits the supply for grain filling demand. As discussed earlier, once plants are infected, one of the mechanisms is to regulate antimicrobial properties that are tied up with an adequate nutrient supply. Thus, insignificant nitrogen, potassium, and silicon in filled grain (%) could be insufficient energy to accommodate the demand for antimicrobial products and NSC formation, as the plants must maintain their vigor first.
The 1,000-grain weight was not affected by nutrients, and N fertilization did not affect grain size, but considerable genotypic differences indicate that genetic variables more easily modify grain size than agronomic factors (Borrell et al., 1999), are relatively stable (Zhou et al., 2017), and are a constant characteristic because grain size is controlled by hull size (Yoshida 1981). Therefore, it is not surprising if the use of nitrogen, potassium, and silicon in this study does not contribute to the 1,000-grain weight. However, the estimated 1000-grain weight of 23.4 g (in year 2021) and 22.7 g (in year 2022) was meager, based on the results obtained by NurulNahar et al., (2023a, 2023b) under normal conditions, and the same variety had produced a 1,000-grain weight between 26.8 g and 29.4 g. This shows the effect of the tungro disease attack, which caused the weight of 1,000 grains to be affected.
In contrast to the balanced fertilization to control rice tungro disease with a rate of 138 kg N/ha, 62 kg K2O/ha, and an additional 200 kg Si/ha, the balance of fertilization for maximizing grain yield per plant was found to be not dependent on nitrogen but needed either low K (62 kg K2O/ha) or high K (80 kg K2O/ha) but with moderate Si (150 kg Si/ha). As discussed earlier, nitrogen was not contributing to the grain yield. It could prioritize the nitrogen to regulate and develop antimicrobial properties, which may sacrifice the formation and accumulation of NSC in rice plants for grain development. Prioritizing tungro disease control and adopting the rate of N:K2O:Si (138:62:200), it was found that there was a yield reduction of an average of 7.7% as the net grain weight reduced from 1.3 g/plant to 1.2 g/plant (Figure 12 vs. Figure 13). In addition, year variations (temperature, humidity, etc.) in grain weight depending on climatic factors may contribute to glasshouse variations, so the grain weight differed in any two years.
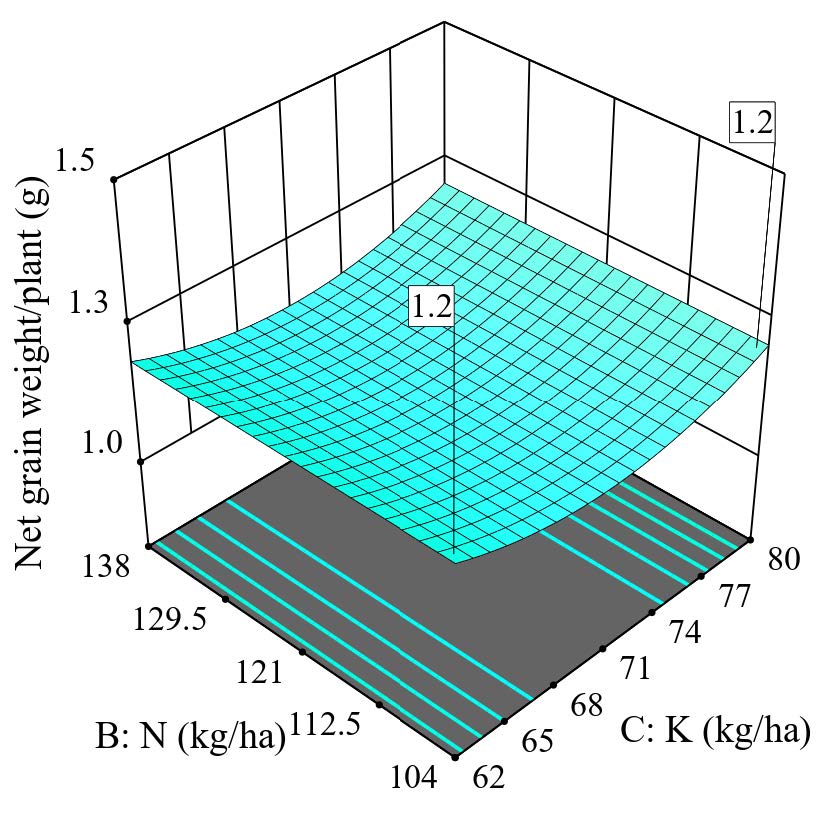
Figure 13. 3D surface graph for net grain weight per plant as follow the recommendation rate for tungro disease control 138:62:200 (N:K:Si).
CONCLUSION
One of the key advantages of RSM is that it generates an incredible amount of information from a small number of experiments. Compared to a factorial experiment, which is a set of treatments consisting of all possible combinations of the levels (rates) of several factors (N, K, and Si), it may require many total treatments. In this study, N and K were based on subsidies and high-yielding fertilizer recommendations in Malaysia. Silicon was based on other studies for controlling pests and diseases and high-yield options. The phosphorous rate (42 kg/ha) was constant for all treatments. Complete and balanced nutrition has always been the first line of defense for plants due to the direct involvement of mineral elements in plant protection. In the case of rice tungro disease, the rate that could minimize disease development is found to be balanced at 138:42:62:200 (N:P2O5:K2O:Si). A high rate of nitrogen is needed to reduce disease development. The results on N may explain that not all conditions of rice plants are at risk with high N rates, as in many previous findings. However, this is also possible because adding Si fertilizer contributes to plant defense mechanisms and plays a role in yield formation. Further studies, especially on splitting the silicon at different rice growth stages, could be done to see the optimal response for disease and yield optimization, as well as a combination of a higher rate of nitrogen and a lower rate of potassium.
ACKNOWLEDGEMENTS
The authors would like to thank Mohamad Naim Nia'amad and Zairul Azrin Ibrahim for providing expertise in helping to carry out the study, especially the preparation of disease inoculation on rice plants and for their assistance in collecting experimental data.
AUTHOR CONTRIBUTIONS
NurulNahar Esa and Mohd Fitri Masarudin designed the experiments, assisted and conducted the experiments, performed the statistical analysis and data visualization, and wrote the manuscript. Maisarah Mohamad Saad and Siti Norsuha Misman conducted the experiments and wrote the manuscript. All authors have read and approved the final manuscript.
CONFLICT OF INTEREST
The authors declare that they hold no competing interests.
REFERENCES
Abdullah, T., Aminah, S. N., Fatahuddin, and Annisaa, N. W. 2021. The mortality of green planthoppers Nephotettix virescens (Homoptera: Cicadellidae) by Metarhizium anisopliae Metchn and Beauveria bassiana (Bals.) Vuill. IOP Conference Series: Earth and Environmental Science. 807(2): 022107.
Azzam, O., Cabunagan, R. C., and Chancellor, T. 2000. Methods for evaluating resistance to rice tungro disease. In IRRI Discussion Paper Series No. 38. International Rice Research Institute.
Azzam, O., and Chancellor, T. C. B. 2002. The biology, epidemiology, and management of rice tungro disease in Asia. Plant Disease. 86(2): 88–100.
Borrell, A. K., Garside, A. L., Fukai, S., and Reid, D. J. 1999. Grain quality of flooded rice is affected by season, nitrogen rate, and plant type. Australian Journal of Agricultural Research. 50: 1399–1408.
Bunawan, H., Dusik, L., Bunawan, S. N., and Amin, N. M. 2014. Rice tungro disease: From identification to disease control. World Applied Sciences Journal. 31(6): 1221–1226.
Costa, N. B., Bezerra, G. de A., Filho, G. de O. P., and de Moraes, M. G. 2021. Distribution of non-structural carbohydrates in the vegetative organs of upland rice. Ciencia e Agrotecnologia. 45: e008721.
de Souza, A. C. A., de Filippi, M. C. C., Nascente, A. S., Prabhu, A. S., and Alves, E. 2021. Silicon rates and beneficial microorganism on blast suppression and productivity of upland rice. Journal of Plant Science and Phytopathology. 5(1): 20–27.
de Souza, N. M., Marschalek, R., Sangoi, L., and Weber, F. S. 2017. Spikelet sterility in rice genotypes affected by temperature at microsporogenesis. Revista Brasileira de Engenharia Agricola e Ambiental. 21(12): 817–821.
Dobermann, A. and Fairhurst, T. 2000. Rice: Nutrient Disorders & Nutrient Management. Handbook Series, Potash & Phosphate Institute (PPI), Potash & Phosphate Institute of Canada (PPIC) and International Rice Research Institute, Philippine, 191
Engku Hasmah, E. A., Azizah, M., Muhammad Nazmin, Y., Yusop, Mohd Rafii, Y., and Asfaliza, R. 2021. The potential of silicon in improving rice yield, grain quality, and minimising chalkiness: A review. Pertanika Journal of Tropical Agricultural Science. 44(3): 655–672.
Firdaus, R. B. R., Leong Tan, M., Rahmat, S. R., and Senevi Gunaratne, M. 2020. Paddy, rice and food security in Malaysia: A review of climate change impacts. Cogent Social Sciences. 6(1): 1818373.
Ghosh, R., and Ganguly, S. 2022. Silicon fertilizers inciting plant defence against pathogenic fungi. Journal of Mycopathological Research. 60(4): 515–521.
Huang, X., Guo, W., Yang, L., Zou, Z., and Zhang, X. 2023. Effects of drought stress on non-structural carbohydrates in different organs of Cunninghamia lanceolata. Plants. 12(13): 2477.
IRRI. 2013. Standard Evaluation System for Rice. International Rice Research Institute, Manila.
Jagadish, S. V. K., Craufurd, P. Q., and Wheeler, T. R. 2007. High temperature stress and spikelet fertility in rice (Oryza sativa L.). Journal of Experimental Botany. 58(7): 1627–1635.
Jamaloddin, M., Mahender, A., Gokulan, G. C., Balachiranjeevi, C., Maliha, A., Patel, H. K., and Ali, J. 2021. Molecular approaches for disease resistance in rice. pp. 315–378. In A. Jauhar and H. W. Shabir (eds.) Rice Improvement. Springer.
Jehangir, I. A., Ahangar, M. A., Hassan, T., Hussain, A., Mohiddin, F. A., Majid, A., Waza, S. A., and Raja, W. 2022. Agronomic practices for sustainable diseases management in rice: A review. Environment Conservation Journal. 23(3): 122–134.
Jeon, J. 2019. Phytobiome as a potential factor in nitrogen-induced susceptibility to the rice blast disease. Research in Plant Disease. 25(3): 103–107.
Khaerana, and Gunawan, A. 2019. Pengaruh aplikasi pupuk silika dalam pengendalian tungro. Jurnal Pertanian. 10(1): 1–7.
Kovács, S., Kutasy, E., and Csajbók, J. 2022. The multiple role of silicon nutrition in alleviating environmental stresses in sustainable crop production. Plants. 11(9): 1223.
Kulyakwave, P. D., Xu, S., and Yu, W. 2020. Impact of meteorological factors on rice growth stages and yield. Pertanika Journal of Science and Technology. 28(3): 1009–1026.
Kwasek, M. 2012. Threats to food security and common agricultural policy. Economics of Agriculture. 59(4): 701–713.
Lakitan, B., Jaya, K. K., Ria, R. P., and Morianto, B. 2020. The effects of different NPK fertilization rates and water regimes on ratooned black glutinous rice. Chiang Mai University Journal of Natural Sciences. 19(3): 350–365.
Lestiyani, A. 2022. Artikel review: Diagnosis penyakit tungro pada padi. Jurnal Ilmu Pertanian Tropika Dan Subtropika, 7(1), 28–38.
Li, R., Sun, Y., Wang, H., and Wang, H. 2022. Advances in understanding silicon transporters and the benefits to silicon-associated disease resistance in plants. Applied Sciences. 12(7): 3282.
Luo, C., Ma, L., Zhu, J., Guo, Z., Dong, K., and Dong, Y. 2021. Effects of nitrogen and intercropping on the occurrence of wheat powdery mildew and stripe rust and the relationship with crop yield. Frontiers in Plant Science. 12: 637393.
Manggala, B., Chaichana, C., Syahputra, W. N. H. and Wongwilai, W. 2023. Pesticide residues detection in agricultural products: A review. Natural and Life Sciences Communications. 22(3): e2023049.
Manzoor, N., Akbar, N., Ahmad Anjum, S., Ali, I., Shahid, M., Shakoor, A., Waseem Abbas, M., Hayat, K., Hamid, W., and Rashid, M. A. 2017. Interactive effect of different nitrogen and potash levels on the incidence of bacterial leaf blight of rice (Oryza sativa L.). Agricultural Sciences. 8: 56–63.
Matsumoto, Y., and Hattori, M. 2018. The green rice leafhopper, Nephotettix cincticeps (Hemiptera: Cicadellidae), salivary protein NcSP75 is a key effector for successful phloem ingestion. PLoS ONE. 13(9): e0202492.
Muazam, A., Mansur, and Panikkai, S. 2021. Observation of promising tungro resistant rice lines in West Sulawesi. IOP Conference Series: Earth and Environmental Science. 911: 012025.
Mukhomorov, V., and Anikina, L. 2011. Interrelation of chemical elements content in plants under conditions of primary soil formation. Open Journal of Soil Science. 1(1), 1–7.
Nazarov, P. A., Baleev, D. N., Ivanova, M. I., Sokolova, L. M., and Karakozova, M. V. 2020. Infectious plant diseases: Etiology, current status, problems and prospects in plant protection. Acta Naturae. 12(3): 46–59.
NurulNahar, E., Shajarutulwardah, M. Y., and Hartinee, A. 2023a. Improving rice grain yield in KADA by site-specific nutrient management. Journal of Tropical Agriculture and Food Science. 51(1): 7–14.
NurulNahar, E., Shajarutulwardah, M. Y., and Hartinee, A. 2023b. Increasing rice grain yield by split application of nitrogen rates. Journal of Agricultural and Food Science. 51(1): 21–28.
NurulNahar, E., Siti Norsuha, M., Maisarah, M. S., and Mohd Fitri, M. 2023. Nitrogen, potassium, and silicon fertilization to achieve lower panicle blast severity and improve yield components of rice using response surface methodology. Jurnal Teknologi. 85(5): 81–91.
Puripunyavanich, V., Khamvarn, V., and Ngamjob, S. 2021. Effects of benzyladenine on in vitro ‘Hom Rangsi’ rice and induction of aluminum acid tolerance lines by gamma irradiation. Chiang Mai University Journal of Natural Sciences. 20(2): e2021040.
Rahmat, S. R., Firdaus, R. B. R., Mohamad Shaharudin, S., and Yee Ling, L. 2019. Leading key players and support system in Malaysian paddy production chain. Cogent Food & Agriculture. 5: 1708682.
Rietra, R. P. J. J., Heinen, M., Dimkpa, C. O., and Bindraban, P. S. 2017. Effects of nutrient antagonism and synergism on yield and fertilizer use efficiency. Communications in Soil Science and Plant Analysis. 48(16): 1895–1920.
Ristaino, J. B., Anderson, P. K., Bebber, D. P., Brauman, K. A., Cunniffe, N. J., Fedoroff, N. V., Finegold, C., Garrett, K. A., Gilligan, C. A., Jones, C. M., Martin, M. D., MacDonald, G. K., Neenan, P., Records, A., Schmale, D. G., Tateosian, L., and Wei, Q. 2021. The persistent threat of emerging plant disease pandemics to global food security. Proceedings of the National Academy of Sciences of the United States of America. 118(23): e2022239118.
Riviello-Flores, M. de la L., Cadena-Iñiguez, J., Ruiz-Posadas, L. D. M., Arévalo-Galarza, M. de L., Castillo-Juárez, I., Hernández, M. S., and Castillo-Martínez, C. R. 2022. Use of gamma radiation for the genetic improvement of underutilized plant varieties. Plants. 11: 1161.
Rizzo, D. M., Lichtveld, M., Mazet, J. A. K., Togami, E., and Miller, S. A. 2021. Plant health and its effects on food safety and security in a One Health framework: Four case studies. One Health Outlook. 3(6).
Romero, A. 2011. Silicon and plant diseases. A review. Agronomia Colombiana. 29(3): 473–480.
Salwani, M. D., Hossein, J. J., and Farnaz, A. 2013. A Review on predicting outbreak of tungro disease in rice fields based on epidemiological and biophysical factors. International Journal of Innovation, Management and Technology. 4(4): 447–450.
Sardans, J., and Peñuelas, J. 2021. Potassium control of plant functions : Ecological and agricultural implications. Plants. 10(2): 419.
Shalitin, D., and Wolf, S. 2000. Cucumber mosaic virus infection affects sugar transport in melon plants. Plant Physiology. 123(2): 597–604.
Shrestha, J., Kandel, M., Subedi, S., and Shah, K. K. 2020. Role of nutrients in rice (Oryza sativa L.): A review. Agrica, 9: 53–62.
Singh, B. V., Singh, S., and Verma, A. 2022. Role of silicon in crop production. Vigyan Varta. 3(8): 134–137.
Siwar, C., Idris, N. D. M., Yasar, M., and Morshed, G. 2014. Issues and challenges facing rice production and food security in the granary areas in the East Coast Economic Region (ECER), Malaysia. Research Journal of Applied Sciences, Engineering and Technology. 7(4): 711–722.
Tatineni, S., and Hein, G. L. 2023. Plant viruses of agricultural importance: Current and future perspectives of virus disease management strategies. Phytopathology. 113(2): 117-141.
Tripathi, R., Tewari, R., Singh, K. P., Keswani, C., Minkina, T., Srivastava, A. K., De Corato, U., and Sansinenea, E. 2022. Plant mineral nutrition and disease resistance: A significant linkage for sustainable crop protection. Frontiers in Plant Science. 13: 883970.
Wakabayashi, Y., Morita, R., Yamagishi, J., and Aoki, N. 2022. Varietal difference in dynamics of non-structural carbohydrates in nodal segments of stem in two varieties of rice (Oryza sativa L.) at pre- and post-heading stages. Plant Production Science. 25(1): 30–42.
Xu, X., Du, X., Wang, F., Sha, J., Chen, Q., Tian, G., Zhu, Z., Ge, S., and Jiang, Y. 2020. Effects of potassium levels on plant growth, accumulation and distribution of carbon, and nitrate metabolism in apple dwarf rootstock seedlings. Frontiers in Plant Science. 11: 904.
Yoshida, S. 1973. Effects of temperature on growth of the rice plant (Oryza sativa L.) in a controlled environment. Soil Science and Plant Nutrition. 19(4): 299–310.
Zeigler, R.S., and S. Savary. 2010. Plant disease and the world’s dependence on rice. pp. 2–9. In R.N. Strange and M.L. Gullino (eds) The Role of Plant Pathology in Food Safety and Food Security. Springer Science+Business Media.
Zhang, J., Tong, T., Potcho, P. M., Huang, S., Ma, L., and Tang, X. 2020. Nitrogen effects on yield, quality and physiological characteristics of giant rice. Agronomy. 10: 1816.
Zhou, W., Lv, T., Yang, Z., Wang, T., Fu, Y., Chen, Y., Hu, B., and Ren, W. 2017. Morphophysiological mechanism of rice yield increase in response to optimized nitrogen management. Scientific Reports. 7(1): 17226.
OPEN access freely available online
Natural and Life Sciences Communications
Chiang Mai University, Thailand. https://cmuj.cmu.ac.th
NurulNahar Esa*, Mohd Fitri Masarudin, Maisarah Mohamad Saad and Siti Norsuha Misman
Paddy and Rice Research Centre, MARDI Seberang Perai, 13200 Kepala Batas, Pulau Pinang, Malaysia
Corresponding author: NurulNahar Esa, E-mail: naharesa@mardi.gov.my
ORCID: NurulNahar Esa: https://orcid.org/0000-0003-1880-1044
Total Article Views
Editor: Tonapha Pusadee
Chiang Mai University, Thailand
Sirasit Srinuanpan
Chiang Mai University, Thailand
Article history:
Received: November 21, 2023;
Revised: October 1, 2024;
Accepted: October 11, 2024;
Online First: November 11, 2024

