 ISSN: 2822-0838 Online

Development, Validation, and Greenness Assessment of HPLC and ATR-FTIR for Mangiferin Quantitative Analysis in Raw Material
Suthira Yanaso*, Aranya Jutiviboonsuk, Phurit Thanarangsarit, and Kanokporn SawasdeePublished Date : September 18, 2024
DOI : https://doi.org/10.12982/NLSC.2024.061
Journal Issues : Number 4, October-December 2024
Abstract Due to the benefits of mangiferin, including antidiabetic, antibacterial, antiviral, antioxidant, and anti-inflammatory activities, it is a natural raw material used in botanical health and cosmetic products. This research aims to develop and validate analytical methods for the quantification of mangiferin in raw material, isolated from Mangifera indica L. leaves, using high performance liquid chromatography (HPLC) and attenuated total reflectance-Fourier transform infrared spectroscopy (ATR-FTIR). The greenness assessment of both analytical methods was performed. The results indicated that both methods were validated in terms of specificity, linearity, range, detection limit, quantitation limit, accuracy, and precision. The ranges of mangiferin used in HPLC and ATR-FTIR were 30 to 360 µg/mL and 5.00 to 27.27% w/w, respectively. The mangiferin content in five batches, analyzed by using the validated HPLC and ATR-FTIR, ranged from 88.35 to 109.4% w/w and 90.7 to 111.8% w/w, respectively. Statistical analysis using a paired t-test revealed no significant difference in the mangiferin quantity between the two techniques at a 95% confidence level. The greenness scores of the HPLC and ATR-FTIR determined according to AGREE metric were 0.49 and 0.81, respectively. Both methods can be applied to quantify mangiferin content and control the quality of mangiferin raw material. Additionally, the validated ATR-FTIR, which proposed excellent environmental friendliness, was suggested as an alternative analytical method for routine assay of mangiferin raw material.
Keywords: Mango, FTIR, HPLC
Funding: The authors are grateful for the research funding provided by Huachiew Chalermprakiet University, Samut Prakan, Thailand.
Citation: Yanaso, S., Jutiviboonsuk, A., Thanarangsarit, P. and Sawasdee, K. 2024. Development, validation, and greenness assessment of HPLC and ATR-FTIR for mangiferin quantitative analysis in raw material. Natural and Life Sciences Communications. 23(4): e2024061.
INTRODUCTION
Pruning is an essential process for achieving high and abundant yields in Mangifera indica L. (mango) cultivation. However, this process usually results in agricultural waste, including mango leaves which are typically disposed of by burning. Many efforts have been made to minimize agricultural waste by increasing the value of mango leaves. Several studies have focused on the extraction and isolation of bioactive compounds, such as mangiferin, from mango leaves (Jutiviboonsuk and Sardsaengjun, 2010; Zou et al., 2014; Loan et al., 2021; Efendi et al., 2023). Mangiferin possesses a wide range of biological properties, including antidiabetic (Muruganandan et al., 2005; Li et al., 2010), antibacterial (Loan et al., 2021), antiviral (Zheng and Lu, 1990; Rechenchoski and Code, 2018), antioxidant (Stoilova et al., 2008; Loan et al., 2021), anti-inflammatory (Saha et al., 2016), anticancer (Morozkina et al., 2021), immunomodulatory (Núñez Selles et al., 2016), cardioprotective (Jiang et al., 2020), and neuroprotective effects (Feng et al., 2019). Accordingly, it could be a promising candidate to use as an active ingredient in cosmetics or dietary supplements.
Quality control is a crucial process that is used to verify the quality of herbal raw materials and botanical products. Nevertheless, there are currently no official guidelines available for analyzing mangiferin. Various pharmacopoeias recognize high performance liquid chromatography (HPLC) as one of the standard techniques for quantitative analysis. Although, attenuated total reflectance-Fourier transform infrared spectroscopy (ATR-FTIR) is regularly applied for qualitative analysis. Recently, this technique has been used in quantitative analysis (Bunaciu et al., 2010; Sukkasem et al., 2015; Fahelelbom et al., 2020; Sabbagh et al., 2022). It provides notable advantages, including rapidity and no requirement for organic solvents during sample preparation, resulting in time and cost savings as well as pollution reduction (Blum and John, 2012; Beć et al., 2022). In recent years, Green Analytical Chemistry (GAC) has emerged as a crucial approach, focusing on minimizing the environmental and health impacts of analytical techniques. GAC requires dedicated tools to assess the greenness of these techniques. Several tools have been developed, including the Analytical GREEnness calculator (AGREE). This tool provides a comprehensive, flexible, and straightforward assessment. The final score, converted into a 0 – 1 scale, is calculated based on the 12 principles of green analytical chemistry (SIGNIFICANCE). The overall score and the performance of each principle are displayed in a pictogram (Pena-Pereira et al., 2020). To establish analytical methods for controlling the quality of mangiferin raw material, both HPLC and ATR-FTIR were developed, validated, and subjected to greenness assessment.
MATERIAL AND METHODS
Materials
Mango (Mangifera indica L.) leaves were collected from Samut Prakan Province, Thailand. All reagents and solvents used were analytical grade. Reagents, used for mangiferin isolation, included absolute ethanol (VWR BDH chemical, France) and dichloromethane (Fisher Scientific, Belgium). Moreover, acetonitrile (Fisher Scientific, Belgium), potassium phosphate monobasic (Ajax Finechem, Australia), o-phosphoric acid (Merck, Germany), and methanol (Supelco, USA) were used in HPLC. Potassium bromide, KBr (Spectra-tech, USA) was used in ATR-FTIR. Mangiferin standard, 100% purity by TLC (Sigma-Aldrich, USA), was employed in both analytical techniques.
Mangiferin raw material preparation
Mangiferin raw materials, isolated from mango leaves, were obtained according to the procedure described by Leeprechanon and Jutiviboonsuk (2015). Briefly, the dried powdered mango leaves were macerated with 85% ethanol at room temperature for 7 days with daily solvent changes. The extract was concentrated under reduced pressure and then resuspended in 50% ethanol before partitioning with dichloromethane. Lastly, the ethanol fraction was concentrated, yielding a pale-yellow powder. This powder was predominantly composed of mangiferin, serving as the mangiferin raw material.
Development of HPLC method
HPLC quantitative analysis of mangiferin was conducted on YL9100 HPLC system (Korea), which included YL9100 quaternary pump, YL9101 in-line vacuum degasser, Rheodyne 7725i injector, and YL9160 PDA (photodiode array) detector. The chromatographic separation was employed using a Mightysil C18 analytical column (5 µm, 4.6 × 250 mm) connected with a Mightysil C18 guard column (4.6 × 5 mm). The analysis was carried out under isocratic elution at ambient temperature, with a flow rate of 1.0 mL/min. An injection volume of sample solution was 20 µL. The detection wavelength was set at 254 nm. The mobile phase comprised phosphate buffer and acetonitrile in a ratio of 85:15 (v/v). Phosphate buffer was prepared by dissolving 0.136 g of potassium phosphate monobasic in deionized water, adding 0.5 g of o-phosphoric acid, and adjusting the volume to one liter with deionized water. The mangiferin standard and raw material solutions dissolving in methanol were analyzed to compare the HPLC chromatograms. The system suitability, assessed by six injection of 250 µg/mL, was determined for the relative standard deviation percentage (%RSD) (≤ 2), tailing factor (≤ 1.5), number of theoretical plates (≥ 2,000), and resolution (≥ 2). The data analysis was performed using YL-Clarity version 4.0.3.867 software.
Validation of HPLC method
The proposed HPLC was validated according to the ICH Q2(R2) guideline (International Council for Harmonisation, 2022) to ensure the reliability of the method. The parameters determined during the validation process were specificity, linearity and range, detection limit (DL) and quantitation limit (QL), accuracy, and precision.
Specificity
The specificity was evaluated by comparing HPLC chromatograms of diluent, mangiferin standard, and mangiferin raw material solutions. Any interferences or overlapping peaks at the retention time of mangiferin were observed. There could not be any other peaks appeared at the retention time of mangiferin peak from the test solutions.
Linearity and range
The linearity of the proposed HPLC method was confirmed by creating a calibration curve using five different concentrations ranging from 30 to 360 µg/mL. The peak area of each concentration (Y-axis) was plotted against the concentration (X-axis). The correlation coefficient (r) was then evaluated, with an acceptable value not less than 0.995. The range was determined based on the results of linearity, accuracy, and precision.
Detection limit (DL) and quantitation limit (QL)
DL and QL were calculated as follows: DL = 3.3 σ/s and QL = 10 σ/s, where “σ” was the standard deviation of the Y-intercepts, while “s” was the slope of the calibration curve.
Accuracy
The accuracy of the proposed HPLC was evaluated using standard addition method. Three concentrations of mangiferin standard solution (100, 180, 250 µg/mL) were analyzed for the peak area. Each concentration level was investigated in triplicate. Subsequently, the peak areas were used to determine the amount found (µg/mL). The recovery percentage was calculated as: % recovery = (average amount of mangiferin found ÷ amount of mangiferin added) × 100.
Precision
The precision of the proposed HPLC method was assessed using the same analytical approach as accuracy determination. Then, the relative standard deviation percentage (%RSD) was calculated as: %RSD = (standard deviation of peak area ÷ average peak area) × 100. Both repeatability and intermediate precision were evaluated.
Development of ATR-FTIR method
ATR-FTIR for mangiferin quantification was conducted using the Spectrum 100 FTIR spectrometer (PerkinElmer®, USA) with attenuated total reflectance (ATR) accessory. The samples were prepared as powder mixtures with KBr. The specified parameters set for the measurement were force gauge (80 ± 1), spectral resolution (4 cm-1), scan number (3 scans), and scan wavenumber (4,000 – 600 cm-1). Data analysis was performed using Spectrum software version 6.1.0.
Validation of ATR-FTIR method
The proposed ATR-FTIR method was validated following ICH Q2(R2) guideline (International Council for Harmonisation, 2022) to confirm its reliability, with validation parameters similar to those used for HPLC validation.
Specificity
The specificity was confirmed by comparing the spectra of KBr, standard mangiferin, and mangiferin raw material. Additionally, the assay results obtained from the ATR-FTIR were compared to a reference analytical method, the validated HPLC. A paired t-test (P < 0.05) was then analyzed by using Microsoft Excel 2016.
Linearity and range
Six different concentrations of the standard mangiferin and KBr mixture, ranging from 5.00 to 27.27% w/w, were utilized to generate a calibration curve. The peak area derived from the signal of the carbonyl group at 1636 – 1602 cm-1 of each concentration was recorded. The linear regression was performed to determine the correlation coefficient (r). The range was established based on the results of linearity, accuracy, and precision.
Detection limit (DL) and quantitation limit (QL)
The equations used for DL and QL determination were DL = 3.3σ/s and QL = 10σ/s, respectively. The meaning of “σ” was the standard deviation of blank determination (n = 3), while “s” represented the slope of the calibration curve.
Accuracy
The accuracy was investigated using spiked blank method, in which mangiferin was spiked into KBr. Three levels of mangiferin (5.00, 14.45, 24.45% w/w in KBr) were analyzed for peak area in triplicate. Then, the amount of mangiferin found (%w/w) was used for calculating the recovery percentage as follows: %recovery = (average amount of mangiferin found ÷ amount of mangiferin added) × 100.
Precision
The precision was assessed using the %RSD obtained from six replicates of peak area analysis of 14.45% w/w mangiferin. The calculation utilized the same formula as previously mentioned in the validation of HPLC. Both repeatability and intermediate precision were evaluated.
Determination of mangiferin in raw material
Five batches of mango leaves were extracted and isolated using the method described above to obtain five batches of mangiferin raw material (MRM1 – MRM5). Sample solution, at a concentration of 200 µg/mL in methanol, was used to determine the amount of mangiferin by the validated HPLC method. Meanwhile, sample mixture (15% w/w in KBr) was used to determine the mangiferin content using the validated ATR-FTIR method. Both experiments were conducted twice. The average peak area was calculated to determine the mangiferin contents. The mangiferin contents (%w/w) of MRM1 – MRM5, obtained from both analytical methods, were compared by paired t-test (P < 0.05) using Microsoft Excel 2016.
Green profiling of the validated methods
The Analytical GREEnness metric (AGREE), freely downloadable from https://mostwiedzy.pl/AGREE, was applied to determine the greenness of the validated HPLC and ATR-FTIR methods (Pena-Pereira et al., 2020). The calculated score, ranging from 0 to 1, was evaluated based on the 12 principles of green analytical chemistry. The overall score with values close to 1 indicates higher greenness of the analytical method.
RESULTS
Development of HPLC method
The proposed HPLC method was slightly modified from the methods described by Kumar et al., (2008). These modifications included adding a guard column and decreasing the concentration of potassium phosphate monobasic in the phosphate buffer solution. The optimum HPLC condition involved using a reversed-phase C18 column (5 µm, 4.6 × 250 mm) coupled with a C18 guard column (4.6 × 5 mm). The suitable diluent used to dissolve mangiferin was methanol. The volume of manual injection was fixed at 20 µL. The mobile phase consisted of an isocratic condition with phosphate buffer and acetonitrile (85:15, v/v). The flow rate was set at 1.0 mL/min, with the detection at a wavelength of 254 nm. The retention time of mangiferin on HPLC chromatogram was about 6.1 minutes.
The overlay of six HPLC chromatograms of 250 µg/mL mangiferin standard solution obtained from system suitability evaluation is presented in Figure 1. The investigated parameters, as detailed in Table 1, included %RSD of the retention time and peak area, tailing factor, number of theoretical plates, and resolution. The results automatically recorded and analyzed by YL-Clarity version 4.0.3.867 software, demonstrated that all parameters met the acceptance criteria.
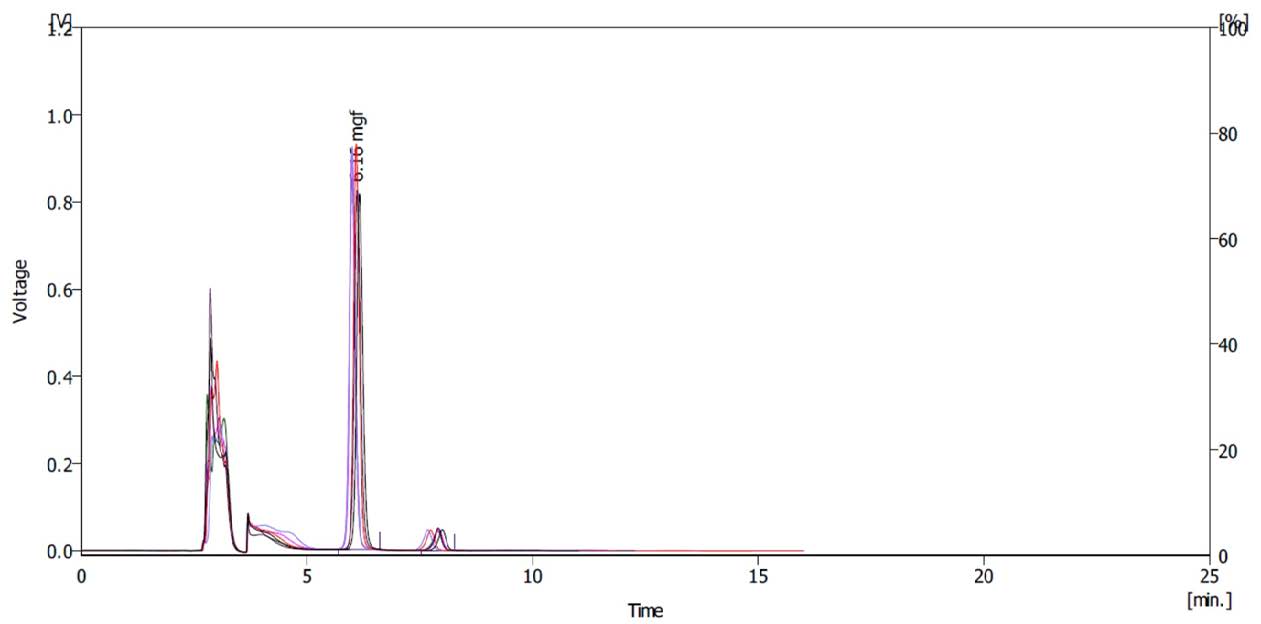
Figure 1. The HPLC chromatograms of mangiferin standard solution obtained from system suitability test.
Table 1. System suitability test of HPLC method for mangiferin quantitation.
|
Parameter |
Mean (%RSD) |
Criteria |
Result |
|
Retention time (min) |
6.060 (1.170) |
%RSD ≤ 2.000 |
Passed |
|
Peak area (mV·s) |
8,145.008 (1.320) |
%RSD ≤ 2.000 |
Passed |
|
Tailing factor |
1.119 (0.710) |
≤ 1.500 |
Passed |
|
Number of theoretical plates |
9,726.583 (8.830) |
≥ 2,000.000 |
Passed |
|
Resolution |
6.362 (6.100) |
≥ 2.000 |
Passed |
Validation of HPLC method
Specificity
The specificity of the HPLC method was confirmed by comparing the HPLC chromatograms of mangiferin standard solution (250 µg/mL) with mangiferin raw material solution (200 µg/mL). The HPLC chromatograms of mangiferin standard and raw material displayed the mangiferin peak at the retention times of 6.16 and 6.19 minutes, respectively. As presented in Figure 2, the absence of any interfering peaks indicated the specificity of the proposed HPLC method.
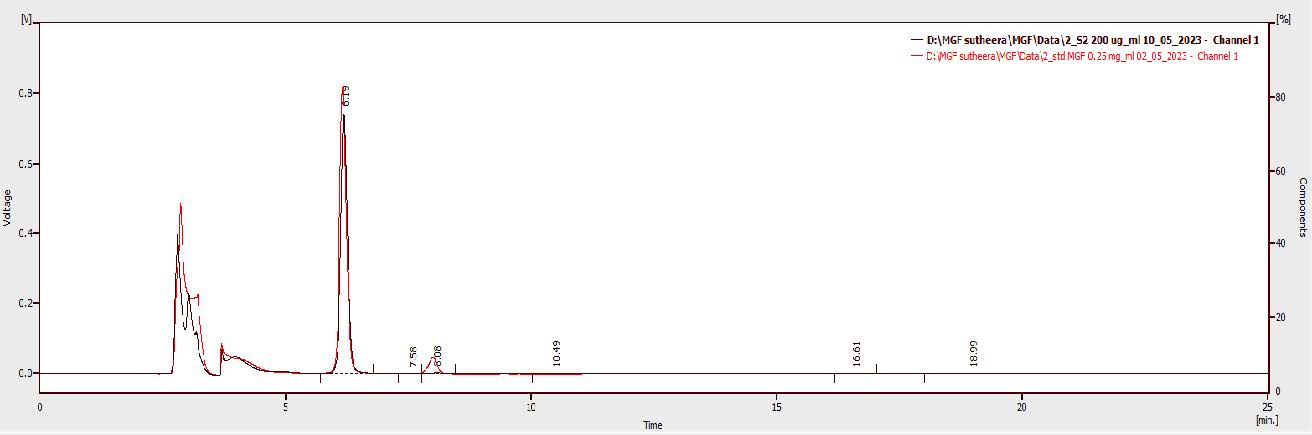
Figure 2. HPLC chromatograms of mangiferin standard and mangiferin raw material.
Linearity and range
Five concentrations of mangiferin standard solution, ranging from 30 to 360 µg/mL, were used to observe linearity. Figure 3 displays the HPLC chromatograms of the standard solution at each concentration. The linearity of the proposed HPLC method was determined by plotting the peak area (Y-axis) against concentrations (X-axis). The calibration curve was represented by the linear equation, Y = 35.71X - 170.89. The linear relationship of the calibration curve was confirmed by calculating the correlation coefficient (r), which was found to be 0.9994, indicating excellent linearity.
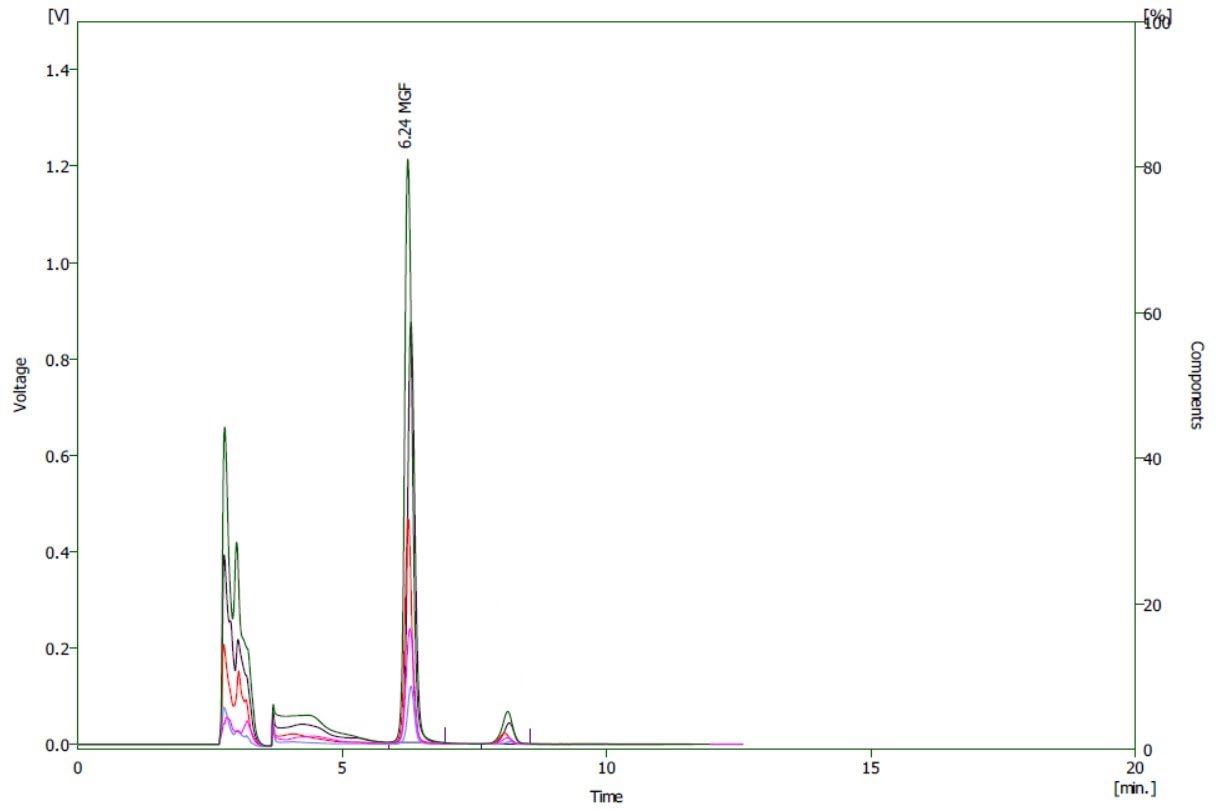
Figure 3. HPLC chromatograms of mangiferin standard, 30 – 360 µg/mL.
Detection limit (DL) and quantitation limit (QL)
DL and QL were estimated based on linear regression data. The slope (s) of the calibration curve was 35.71, while the standard deviation of the Y-intercept (σ) was 69.11. Therefore, DL and QL were 6.4 and 19.4 µg/mL, respectively.
Accuracy
The percentage recoveries of the mangiferin standard analyzed by the proposed HPLC method were evaluated at three levels in triplicate (Table 2). The percentage recoveries, ranging from 100.2 – 101.6%, demonstrated that the proposed HPLC method was accurate for mangiferin quantitative analysis.
Table 2. Accuracy of the proposed HPLC method.
|
Mangiferin added (µg/mL) |
Average mangiferin found ± SD (µg/mL) |
% Recovery ± SD |
|
100 |
101.40 ± 1.06 |
101.40 ± 1.06 |
|
180 |
182.90 ± 2.10 |
101.60 ± 1.17 |
|
250 |
250.60 ± 2.04 |
100.20 ± 0.82 |
Precision
The repeatability (intra-day) and intermediate precision (inter-day) of the proposed HPLC method were evaluated at three different levels (Table 3). The %RSD, ranging from 0.65 – 1.15%, demonstrated the consistency of the results.
Table 3. Precision of the proposed HPLC method.
|
Precision |
Mangiferin added (µg/mL) |
Average peak area |
SD |
%RSD |
|
intra-day (n = 3) |
100 |
3621.60 |
31.389 |
0.87 |
|
180 |
6531.91 |
74.908 |
1.15 |
|
|
250 |
8948.97 |
73.042 |
0.82 |
|
|
inter-day (n = 6) |
100 |
3632.15 |
28.226 |
0.78 |
|
180 |
6581.31 |
73.808 |
1.12 |
|
|
250 |
8962.68 |
58.373 |
0.65 |
Development of ATR-FTIR method
The FTIR spectrometer with ATR accessory, operating in reflectance mode, was utilized to conduct ATR-FTIR analytical method for mangiferin quantitation. Due to the transparency of KBr to IR radiation above 400 cm-1 (Fahelelbom et al., 2020), it was used as a diluent for preparing the sample mixture. Because of the hygroscopic property of KBr (Bunaciu et al., 2010; Fahelelbom et al., 2020), it was dried at 110°C for 2 hours to eliminate the moisture before use. For sample preparation, the sample and KBr were mixed and ground for 2 minutes to ensure consistency. Based on the preliminary study, the appropriate amount of the sample mixture was placed onto the ATR crystal without the need for precise weighing. The optimum condition for analysis was 80 ± 1 force gauge, 4 cm-1 spectral resolution, 3 scan numbers, and 4,000 – 600 cm-1 scanning range. The peak area (T·cm-1) from the selected peak, between 1,602 – 1,636 cm-1 (peak 1,618 cm-1) corresponded to the carbonyl group stretching vibrational band (Figure 4), was determined. The peak area of the selected peak increased proportionally when increasing the mangiferin standard in the sample mixture.
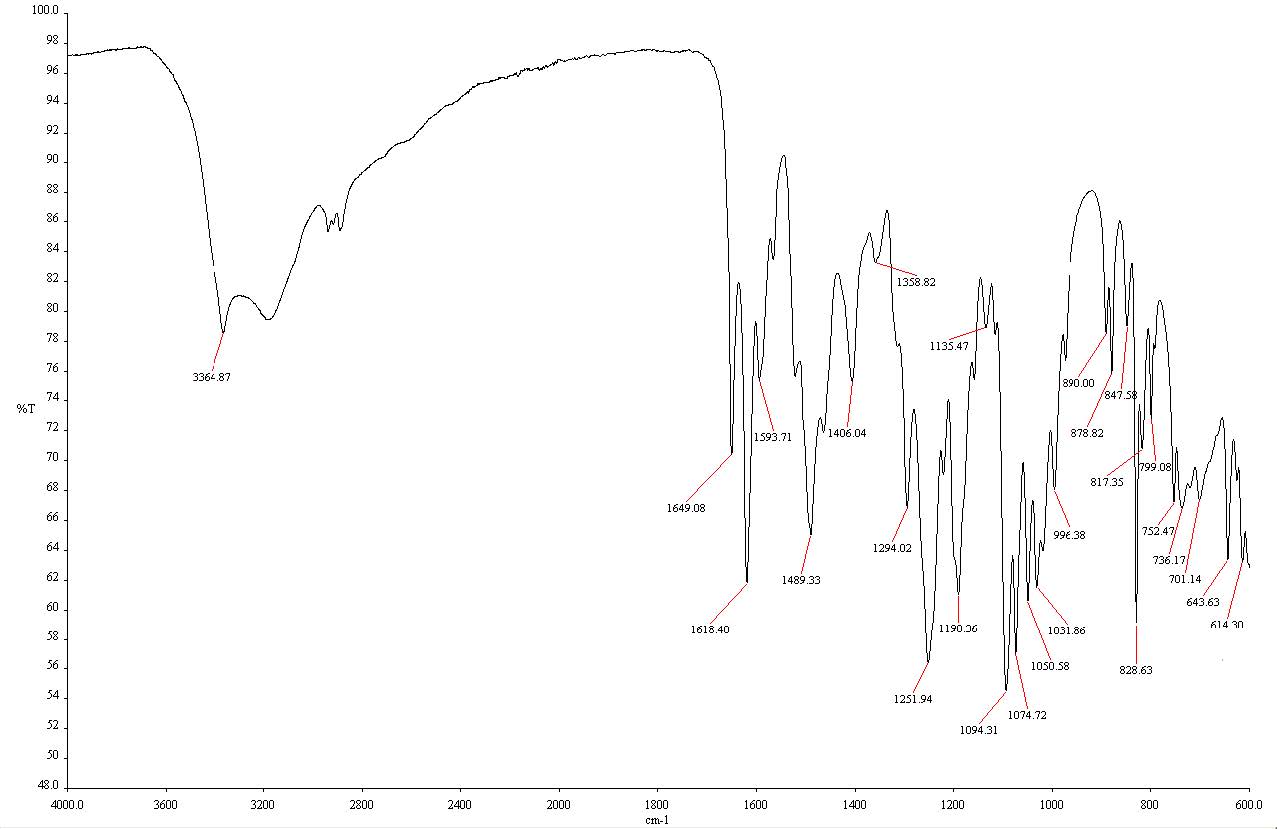
Figure 4. IR spectrum of mangiferin standard, green color represents the selected peak area for mangiferin quantitative determination.
Validation of ATR-FTIR method
Specificity
As presented in Figure 5, IR spectrum of KBr indicated that no peaks interfered with the analysis of mangiferin. Moreover, IR spectra of mangiferin standard and raw material at a concentration of 50% w/w were conducted. The correlation and the discrimination values of the two spectra, analyzed using Spectrum software version 6.1.0, were 0.9686 and 0.031, respectively. As a result, no significant differences between the IR fingerprints of the mangiferin standard and the raw material were observed.
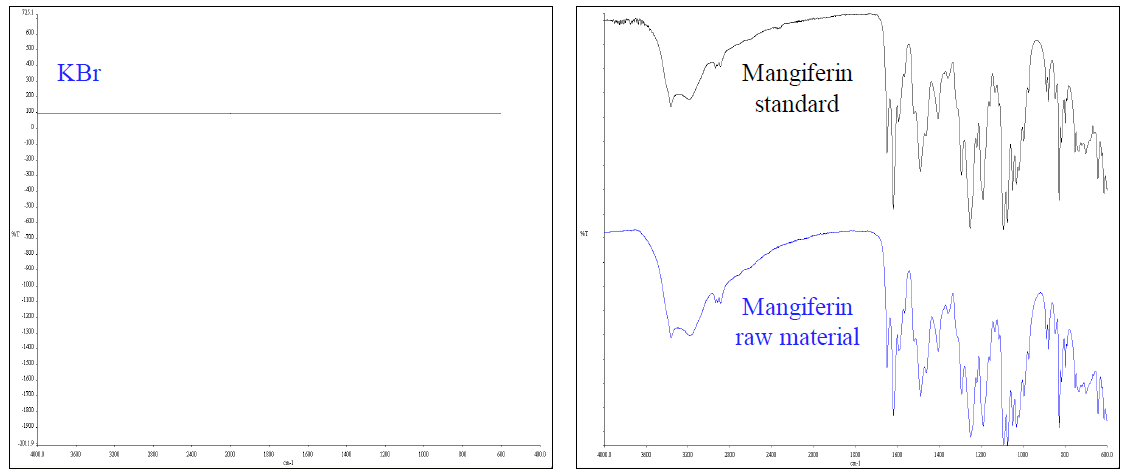
Figure 5. IR spectra of KBr, mangiferin standard, and mangiferin raw material.
Moreover, the specificity of the proposed ATR-FTIR method was determined by comparing the mangiferin contents of raw materials obtained from the proposed ATR-FTIR and the validated HPLC method using paired t-test analysis. There was no statistically significant difference (P < 0.05) between the results obtained from both methods. The data were described under “Determination of mangiferin in raw material”. These data suggested that the proposed ATR-FTIR method was specific for analyzing mangiferin raw material.
Linearity and range
Six concentrations of mangiferin standard mixture, ranging from 5.00 – 27.27% w/w, were investigated (Figure 6). Peak area at 1,602 – 1,636 cm-1 (Y-axis) and concentrations (X-axis) were plotted to observe the linearity. The regression equation of the calibration curve was Y = -15.559X + 3,227.6. The acceptable linearity was observed, as evidenced by the correlation coefficient (r) of 0.9958.
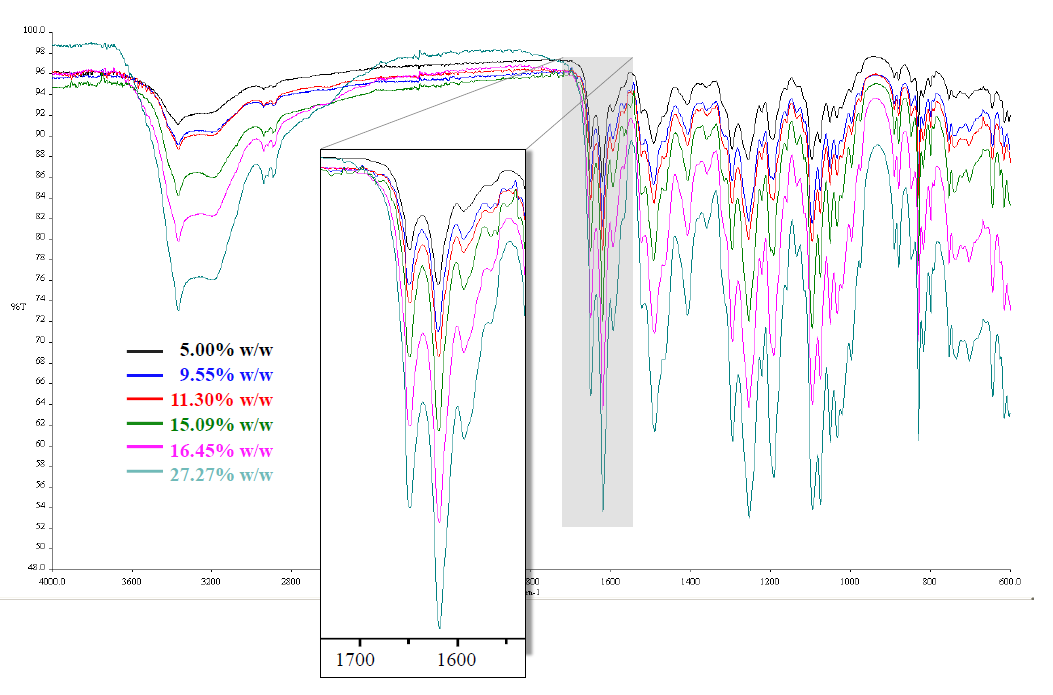
Figure 6. IR spectra of mangiferin standard, 5.00 – 27.27% w/w.
Detection limit (DL) and quantitation limit (QL)
DL and QL were estimated based on linear regression data. The slope (s) of the calibration curve was -15.643, while the standard deviation of blank (σ) was 7.898. Therefore, DL and QL were 1.7 and 5.0 µg/mL, respectively.
Accuracy
The percentage recoveries of the mangiferin standard, at three levels in triplicate, are depicted in Table 4. The percentage recoveries, ranging from 98.60 – 100.6%, indicated that the proposed ATR-FTIR method accurately quantified mangiferin content.
Table 4. Accuracy of the proposed ATR-FTIR method.
|
Mangiferin added (%w/w) |
Average mangiferin found ± SD (%w/w) |
% Recovery ± SD |
|
5.000 |
4.930 ± 0.095 |
98.600 ± 1.900 |
|
14.450 |
14.420 ± 0.213 |
99.790 ± 1.470 |
|
24.450 |
24.590 ± 0.316 |
100.600 ± 1.290 |
Precision
The repeatability (intra-day) and intermediate precision (inter-day), at one level in six replicates, are demonstrated in Table 5. The %RSD of repeatability and intermediate precision were 1.58 and 1.63, respectively. These findings confirmed the consistency of the results obtained from the proposed ATR-FTIR method.
Table 5. Precision of the proposed ATR-FTIR method.
|
Precision |
Mangiferin added (%w/w) |
Average mangiferin found (%w/w) |
SD |
%RSD |
|
intra-day (n = 6) |
14.450 |
14.380 |
0.226 |
1.580 |
|
inter-day (n = 12) |
14.450 |
14.430 |
0.236 |
1.630 |
Determination of mangiferin in raw material
Mangiferin contents (%w/w) in five batches of raw material (MRM1 – MRM5) were determined using the validated HPLC and ATR-FTIR methods. The results (Table 6) demonstrated that MRM1 – MRM5 contained mangiferin in the range of 88.35 – 109.4% and 90.7 – 111.8% when analyzed by the validated HPLC and ATR-FTIR methods, respectively. To compare the results from both methods, statistical significance was determined using a paired t-test. The calculated t (0.1352) was found to be lower than the two-tailed critical t value (2.776) and the P-value was 0.8990. These data indicated that there was no statistically significant difference between the mangiferin contents obtained from both methods at a 95% confidence level.
Table 6. Mangiferin content of MRM1 – MRM5.
|
Methods |
Mangiferin content (%w/w) |
||||
|
MRM1 |
MRM2 |
MRM3 |
MRM4 |
MRM5 |
|
|
HPLC |
88.35 |
108.70 |
101.80 |
101.90 |
109.40 |
|
ATR-FTIR |
90.70 |
111.80 |
99.05 |
98.90 |
108.80 |
Green profiling of the validated methods
To determine the greenness of the validated analytical methods, the principles according to AGREE (P1 – P12) were converted into scores and pictograms. The input data of each method are described in Table 7.
Table 7. The data used for greenness evaluation of HPLC and ATR-FTIR methods.
|
No. |
Topic |
HPLC |
ATR-FTIR |
|
P1 |
Sample treatment |
External sample treatment with reduced number of steps |
External sample treatment with reduced number of steps |
|
P2 |
Sample amount |
~ 0.010 g |
~ 0.010 g |
|
P3 |
Device positioning |
Off-line |
Off-line |
|
P4 |
Sample preparation steps |
2 (sonication and filtration) |
1 (mixing) |
|
P5 |
Degree of automation/ sample preparation |
Semi-automatic/ miniaturized sample preparation |
Semi-automatic/ miniaturized sample preparation |
|
P6 |
Derivatization |
No |
No |
|
P7 |
Waste |
~ 100 mL |
~ 0.010 g |
|
P8 |
Analysis throughput |
1 analyte/run, |
1 analyte/run, ~ 20 samples/hour |
|
P9 |
Energy consumption based on technique used |
LC |
FTIR |
|
P10 |
Source of reagent |
No bio-based reagents |
No reagents |
|
P11 |
Toxic reagent |
Yes (~ 15 mL) |
No |
|
P12 |
Threat |
Highly flammable |
No |
AGREE pictograms of the validated analytical techniques used for mangiferin determination are performed in Figure 7. The greenness scores of the validated HPLC and ATR-FTIR methods were 0.49 and 0.81, respectively. According to the findings, the ATR-FTIR method performed significantly more environmentally friendly than the HPLC method when applied for quantitative analysis of mangiferin in raw material.
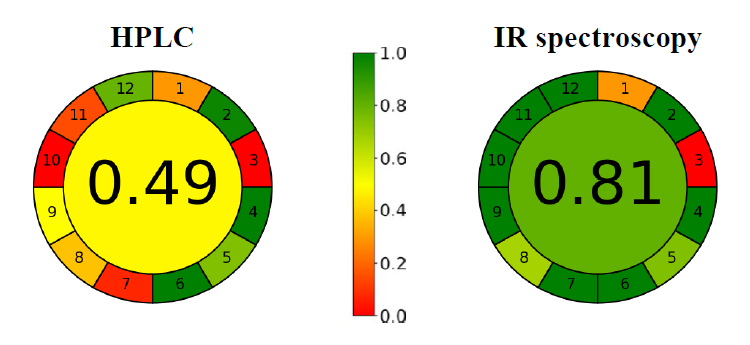
Figure 7. AGREE pictograms of the validated HPLC and ATR-FTIR methods.
DISCUSSION
For the HPLC method development, the retention time of the diluent (methanol) appeared between 2.5 to 5 minutes, however, it did not interfere with the mangiferin analysis. It was proven by the resolution of 6.4, which indicated the complete separation (Watson, 2012). Similar to this research, many previous studies focused on quantitative analysis using ATR-FTIR also selected KBr as a diluent (Bansal et al., 2021; Sabbagh et al., 2022; Fahelelbom et al., 2023). Moreover, the stretching peak related to the carbonyl group of some drugs such as doxorubicin hydrochloride (Bansal et al., 2021), ibuprofen (Matkovic et al., 2005), amoxicillin (Fanelli et al., 2018), ciprofloxacin (Pandey et al., 2012), and valsartan (Harshou et al., 2022) were also selected for quantitative analysis.
The proposed HPLC and ATR-FTIR methods were successfully validated in accordance with the ICH Q2(R2) guideline. Although the interferences could not be separated based on IR spectroscopy, the content of mangiferin raw materials analyzed by both the proposed ATR-FTIR and the validated HPLC methods were not significantly different. These findings indicated that the proposed ATR-FTIR method was specific for mangiferin analysis. The accuracy and precision of the HPLC were superior to those of the ATR-FTIR. However, this was not an issue because the validated results of both methods were within an acceptable range. The validated results assisted that both methods were specific, linear, accurate, and precise for mangiferin quantitative analysis. Moreover, there was no statistically significant difference at a 95% confidence level between the mangiferin contents (MRM1 – MRM5) obtained from both methods. Interestingly, mangiferin content in some samples was reported to exceed 100%. This may be due to the fact that the mangiferin content in each sample was calculated based on linear regression which was created from the mangiferin standard. Although the purity of the mangiferin standard was determined to be 100% by TLC, the HPLC chromatogram of mangiferin standard displayed a small peak that did not correspond to the mangiferin peak. Meanwhile, the small peak that also appeared in the HPLC chromatogram of the sample exhibited a smaller peak area than that of the standard (Figure 2). These results suggested that the purity of some mangiferin raw materials prepared in this study may be higher than that of the mangiferin standard.
Although HPLC is the most widely used chromatographic technique in pharmaceutical analysis, large volumes of waste from solvents are generated (Watson, 2012). In routine analysis, the environmental sustainability of analytical methods, such as the amount and toxicity of reagents, generated waste, energy requirements, the number of procedural steps, as well as, miniaturization, has been concerned (Pena-Pereira et al., 2020). Several tools, including Analytical Eco-scale, Green Analytical Procedure Index (GAPI), and Analytical GREEnness metric (AGREE), have been applied to assess the greenness of analytical procedures (Demir et al., 2023). Among these, AGREE, an open-source software, was selected due to its simplicity, ease of interpretation using pictograms, and informative results, as well as the usefulness for comparing purposes (Demir et al., 2023; Wejnerowska and Narloch, 2023; Mejías et al., 2023). Moreover, it is one of the tools that provide reliable and precise results regarding the greenness of analytical methods (Gamal et.al, 2021; Algethami and Gamal, 2023). In the present studies, the HPLC method was related to higher energy consumption because the HPLC chromatogram was conducted within 10 minutes per sample, whereas the IR spectrum could be obtained within 2 minutes per sample. The HPLC method required the use of organic solvent, including acetonitrile (as mobile phase) which was toxic and highly flammable. Conversely, the method using ATR-FTIR technique did not involve the use of any hazardous chemicals. The analysis of mangiferin by the proposed HPLC method resulted in the use of 10 mL of mobile phase per sample, however, the preparation of HPLC condition required more 90 mL of mobile phase (30 mL for the column saturation and 60 mL for system suitability testing). Meanwhile, the proposed ATR-FTIR method only required approximately 0.010 g of KBr per sample. Consequently, using the proposed HPLC generated more hazardous waste than using the proposed IR spectroscopy. Based on these data, the greenness score of the ATR-FTIR method was 0.32 points higher than that of the HPLC method. Accordingly, the validated ATR-FTIR method could be one of the suitable methods for routine mangiferin analysis in raw material, due to environmental awareness. To ensure the quality of herbal products containing mangiferin as an active ingredient, not only the raw material but also the formulation should be standardized. Therefore, the findings of this study could be used as a guideline to develop and validate green analytical techniques for determining mangiferin in botanical products.
CONCLUSION
The HPLC and ATR-FTIR methods for quantifying mangiferin were developed and validated. The validated results of these methods, according to ICH Q2(R2), were acceptable. Both methods were employed to quantify the mangiferin content in MRM1 – MRM5. The finding suggested that there was no statistically significant difference between the results obtained from both methods. Therefore, both methods which were specific, linear, accurate, and precise can be utilized to control the quality of mangiferin raw material. Moreover, the validated ATR-FTIR method, which demonstrated excellent environmental friendliness and ease to operate, was recommended as an alternative analytical method for routine quality control of mangiferin raw material.
ACKNOWLEDGEMENTS
The authors are grateful to Wilaipan Leeprechanon and Chaiwichit Ruttanamanee for their assistance in the present work and thank the Faculty of Pharmaceutical Sciences, Huachiew Chalermprakiet University for providing facilities and instruments.
AUTHOR CONTRIBUTIONS
Conceptualization: Suthira Yanaso
Project administration: Suthira Yanaso
Data collection: Suthira Yanaso, Phurit Thanarangsarit, Aranya Jutiviboonsuk, Kanokporn Sawasdee
Data visualization: Suthira Yanaso, Aranya Jutiviboonsuk, Phurit Thanarangsarit
Funding acquisition: Suthira Yanaso
Writing – original draft: Suthira Yanaso.
Writing – review & editing: Phurit Thanarangsarit, Aranya Jutiviboonsuk, Kanokporn Sawasdee
CONFLICT OF INTEREST
The authors declare that they hold no competing interests.
REFERENCES
Algethami, F.K. and Gamal, M. 2023. Development of a simple, eco-friendly HPLC-DAD method for tulathromycin analysis: Ensuring stability and assessing greenness. Microchemical Journal. 195: 109511.
Bansal, R., Singh, R., and Kaur, K. 2021. Quantitative analysis of doxorubicin hydrochloride and arterolane maleate by mid IR spectroscopy using transmission and reflectance modes. BMC Chemistry. 15(1): 27.
Beć, K.B., Grabska, J., and Huck, C.W. 2022. Infrared and near-infrared spectroscopic techniques for the quality control of herbal medicines. p. 603-627. In: P.K. Mukherjee (ed). Evidence-based validation of herbal medicine: Translational research on botanicals. 2nd ed. Elsevier, Amsterdam.
Blum, M.M., and John, H. 2012. Historical perspective and modern applications of attenuated total reflectance-Fourier transform infrared spectroscopy (ATR‐FTIR). Drug Testing and Analysis. 4(3-4): 298-302.
Bunaciu, A.A., Aboul-Enein, H.Y., and Fleschin, S. 2010. Application of Fourier transform infrared spectrophotometry in pharmaceutical drugs analysis. Applied Spectroscopy Reviews. 45(3): 206-219.
Demir, İ., Bulduk, İ., and Enginar, H. 2023. Development, validation and greenness assessment of environmentally friendly analytical methods for the quantification of lenalidomide in pharmaceutical formulations. Acta Chromatographica. (in press).
Efendi, M.R., Bakhtiar, A., Rusdi, M.S., and Putra, D.P. 2023. Simplified isolation method of mangiferin from Mangifera indica L. leaves and evaluation of tyrosinase inhibitory activity. Asia-Pacific Journal of Science and Technology. 28(6): ASPT-28.
Fahelelbom, K.M., Saleh, A., Mansour, R., and Sayed, S. 2020. First derivative ATR-FTIR spectroscopic method as a green tool for the quantitative determination of diclofenac sodium tablets. F1000Research. 9: 176.
Fahelelbom, K., Saleh, A., Mansour, R., and Abujarad, R. 2023. Utilization of green ATR-FTIR spectroscopic method for quantitative analysis of ibuprofen tablets. Pharmacia. 70(4): 999-1004.
Fanelli, S., Zimmermann, A., Totoli, E.G., and Salgado, H.R.N. 2018. FTIR spectrophotometry as a green tool for quantitative analysis of drugs: Practical application to amoxicillin. Journal of Chemistry. 2018(1): 3920810.
Feng, S.T., Wang, Z.Z., Yuan, Y.H., Sun, H.M., Chen, N.H., and Zhang, Y. 2019. Mangiferin: A multipotent natural product preventing neurodegeneration in Alzheimer’s and Parkinson’s disease models. Pharmacological Research. 146: 104336.
Gamal, M., Naguib I.A., Panda D.S., Abdallah F.F. 2021. Comparative study of four greenness assessment tools for selection of greenest analytical method for assay of hyoscine N-butyl bromide. Analytical Methods. 13(3): 369-380.
Harshou, N., Trefi, S., Bitar, Y. 2022. Fourier transform infrared spectroscopy for quantitative determination of valsartan in bulk materials and in pharmaceutical dosage forms. Bulletin of Pharmaceutical Sciences. 45(2): 747-760.
International Council for Harmonisation. 2022. ICH guideline Q2(R2) on validation of analytical procedures. International Council for Harmonisation of Technical Requirements for Pharmaceuticals for Human Use. Amsterdam, Netherlands.
Jiang, T., Han, F., Gao, G., and Liu, M. 2020. Mangiferin exert cardioprotective and anti-apoptotic effects in heart failure induced rats. Life Sciences. 249: 117476.
Jutiviboonsuk, A., and Sardsaengjun, C. 2010. Mangiferin in leaves of three Thai mango (Mangifera indica L.) varieties. Isan Journal of Pharmaceutical Sciences. 6(3): 122-129.
Kumar, P., Srivastava, V., and Kumar, L. 2008. Development of new reversed-phase HPLC method for the determination of Mangiferin in Mangifera indica Linn. Biosciences Biotechnology Research Asia. 5(1): 383-388.
Leeprechanon, W., and Jutiviboonsuk, A. 2015. Quantitative determination of mangiferin isolated from leaves of Mangifera indica L. variety Nam Doc Mai using HPTLC and its DPPH scavenging activity. p. 163-173. In: Rungsawanpho, D. (ed). Proceeding of the 6th International Conference of Suan Sunandha Rajabhat University. Bangkok, 28-29 Apr 2015. Suan Sunandha Rajabhat University, Bangkok.
Li, X., Cui, X., Sun, X., Li, X., Zhu, Q., and Li, W. 2010. Mangiferin prevents diabetic nephropathy progression in streptozotocin‐induced diabetic rats. Phytotherapy Research. 24(6): 893-899.
Loan, N.T.T., Long, D.T., Yen, P.N.D., Hanh, T.T.M., Pham, T.N., and Pham, D.T.N. 2021. Purification process of mangiferin from Mangifera indica L. leaves and evaluation of its bioactivities. Processes. 9(5): 852.
Matkovic, S.R., Valle, G.M., and Briand, L.E. 2005. Quantitative analysis of ibuprofen in pharmaceutical formulations through FTIR spectroscopy. Latin American Applied Research. 35(3): 189-195.
Mejías, C., Arenas, M., Martín, J., Santos, J.L., Aparicio, I., and Alonso, E. 2023. Green assessment of analytical procedures for the determination of pharmaceuticals in sewage sludge and soil. Critical Reviews in Analytical Chemistry: 2276294
Morozkina, S.N., Nhung Vu, T.H., Generalova, Y.E., Snetkov, P.P., and Uspenskaya, M.V. 2021. Mangiferin as new potential anti-cancer agent and mangiferin-integrated polymer systems—A novel research direction. Biomolecules. 11(1): 79.
Muruganandan, S., Srinivasan, K., Gupta, S., Gupta, P.K., and Lal, J. 2005. Effect of mangiferin on hyperglycemia and atherogenicity in streptozotocin diabetic rats. Journal of Ethnopharmacology. 97(3): 497-501.
Núñez Selles, A.J., Daglia, M., and Rastrelli, L. 2016. The potential role of mangiferin in cancer treatment through its immunomodulatory, anti‐angiogenic, apoptopic, and gene regulatory effects. Biofactors. 42(5): 475-491.
Pandey, S., Pandey, P., Tiwari, G., Tiwari, R., & Rai, A.K. 2012. FTIR spectroscopy: A tool for quantitative analysis of ciprofloxacin in tablets. Indian Journal of Pharmaceutical Sciences. 74(1): 86-90.
Pena-Pereira, F., Wojnowski, W., and Tobiszewski, M. 2020. AGREE—Analytical GREEnness metric approach and software. Analytical Chemistry. 92(14): 10076-10082.
Rechenchoski, D.Z., and Code, Q.R. 2018. Antiviral potential of mangiferin against poliovirus. International Journal of Pharmacological Research. 8(4): 34-39.
Sabbagh, B.A., Kumar, P.V., Chew, Y.L., Chin, J.H., and Akowuah, G.A. 2022. Determination of metformin in fixed-dose combination tablets by ATR-FTIR spectroscopy. Chemical Data Collections. 39: 100868.
Saha, S., Sadhukhan, P., and Sil, P.C. 2016. Mangiferin: A xanthonoid with multipotent anti‐inflammatory potential. Biofactors. 42(5): 459-474.
Stoilova, I., Jirovetz, L., Stoyanova, A., Krastanov, A., Gargova, S., and Ho, L. 2008. Antioxidant activity of the polyphenol mangiferin. Electronic Journal of Environmental, Agricultural and Food Chemistry. 7(13): 2706-2716.
Sukkasem, C., Machikowa, T., Tanthanuvh, W., and Wongprasaid, S. 2015. Rapid chemometric method for the determination of oleic and linoleic acid in sunflower seeds by ATR-FTIR spectroscopy. Chiang Mai Journal of Science. 42(4): 930-938.
Watson, D.G. 2012. High-performance liquid chromatography. p. 301-355. In: D.G. Watson and R. Edrada-Ebel (eds). Pharmaceutical analysis: A textbook for pharmacy students and pharmaceutical chemists. 3rd ed. Churchill Livingstone, Edinburgh.
Wejnerowska, G., and Narloch, I. 2023. Comparison of the greenness assessment of chromatographic methods used for analysis of UV filters in cosmetic samples. Analytica. 4(4): 447-455.
Zheng, M.S., and Lu, Z.Y. 1990. Antiviral effect of mangiferin and isomangiferin on herpes simplex virus. Chinese Medical Journal. 103(02): 160-165.
Zou, T.B., Xia, E.Q., He, T.P., Huang, M.Y., Jia, Q., and Li, H.W. 2014. Ultrasound-assisted extraction of mangiferin from mango (Mangifera indica L.) leaves using response surface methodology. Molecules. 19(2): 1411-1421.
OPEN access freely available online
Natural and Life Sciences Communications
Chiang Mai University, Thailand. https://cmuj.cmu.ac.th
Suthira Yanaso1, *, Aranya Jutiviboonsuk2, Phurit Thanarangsarit1, and Kanokporn Sawasdee2
1 Department of Pharmaceutical Chemistry, Faculty of Pharmaceutical Sciences, Huachiew Chalermprakiet University, Samut Prakan, 10540, Thailand.
2 Department of Pharmacognosy, Faculty of Pharmaceutical Sciences, Huachiew Chalermprakiet University, Samut Prakan, 10540, Thailand.
Corresponding author: Suthira Yanaso, E-mail: suthira.yanaso@gmail.com
ORCID: Suthira Yanaso: https://orcid.org/0000-0003-1812-9315
Total Article Views
Editor: Nisit Kittipongpatana,
Chiang Mai University, Thailand
Article history:
Received: June 12, 2024;
Revised: August 19, 2024;
Accepted: September 9, 2024;
Online First: September 18, 2024