 ISSN: 2822-0838 Online

Assessment of Hair Polycyclic Aromatic Hydrocarbons and Their Impact on Respiratory Health and Functional Exercise Capacity in Adolescent Females: A Study in Chiang Mai, Thailand
Kessaya Radarit, Pitakchon Ponsawansong, Kawinwut Somsunun, Nathaporn Thongjan, Teetawat Santijitpakdee, and Tippawan Prapamontol*Published Date : September 11, 2024
DOI : https://doi.org/10.12982/NLSC.2024.058
Journal Issues : Number 4, October-December 2024
Abstract Polycyclic aromatic hydrocarbons (PAHs) are ubiquitous environmental pollutants originating from various combustion processes. While PAH exposure has been associated with adverse respiratory health outcomes, including impaired lung function, this cross-sectional study examines the associations between hair PAH concentrations, lung function, and functional exercise capacity among 352 female school students in Chiang Mai, Thailand. Hair samples were analyzed for 15 PAHs, and lung function was assessed using spirometry while functional exercise capacity was evaluated using the six-minute walk test (6MWT). Nine PAHs were quantitatively detected in hair samples, with significant inverse correlations observed between PAH levels in hair and various lung function parameters, including the percentage of predicted values for forced vital capacity (% pred FVC), forced expiratory volume in one second (% pred FEV1), peak expiratory flow (% pred PEF), FEV1/FVC ratio (% pred FEV1/FVC), mean forced expiratory flow between 25% and 75% of FVC (% pred FEF25−75), and FEF25–75/FVC ratio (% pred FEF25−75/FVC). Elevated PAH concentrations were also associated with reduced six-minute walk distance (6MWD). Our study provides compelling evidence of the adverse effects of PAH exposure on respiratory health and functional exercise capacity in adolescent females.
Keywords: Polycyclic aromatic hydrocarbons, Hair analysis, Lung function, Six-minute walk test
Funding: The authors would like to acknowledge the scholarship provided by Science Achievement Scholarship of Thailand (SAST), grant number KKU 013/2553 to Kessaya Radarit.
Citation: Radarit, K., Ponsawansong, P., Somsunun, K., Thongjan, N., Santijitpakdee, T., and Prapamontol, T. 2024. Assessment of hair polycyclic aromatic hydrocarbons and their impact on respiratory health and functional exercise capacity in adolescent females: A study in Chiang Mai, Thailand. Natural and Life Sciences Communications. 23(4): e2024058.
INTRODUCTION
Polycyclic aromatic hydrocarbons (PAHs) are formed through incomplete combustion processes involving fossil fuels and biomass burning, originating from various sources such as wood stoves, cigarettes, coal, traffic-related air pollution, and high-temperature cooking methods such as grilling, roasting, and frying (Khalili et al., 1995; Slezakova et al., 2009). PAHs released from these sources can either attach to or form small particles in the air. The accumulation of PAHs in humans occurs through dietary intake, with the potential contribution of dermal contact exposure being minimal for non-occupational populations. It is important to note that certain PAHs possess genotoxic and carcinogenic properties. (International Agency for Research on Cancer, 1983). The U.S. Environmental Protection Agency (EPA) has identified 16 PAHs as priority pollutants, selected based on their toxicity, potential for human exposure, frequency of occurrence at hazardous waste sites, and the availability of data. Among these, the EPA considers seven, benzo(a)anthracene, chrysene, benzo(b)fluoranthene, benzo(k)fluoranthene, benzo(a)pyrene, indeno(1,2,3-cd)pyrene, and dibenz(a,h)anthracene, as probable human carcinogens (IARC, 2010). The molecular structures of these carcinogenic PAHs are illustrated in Figure 1.
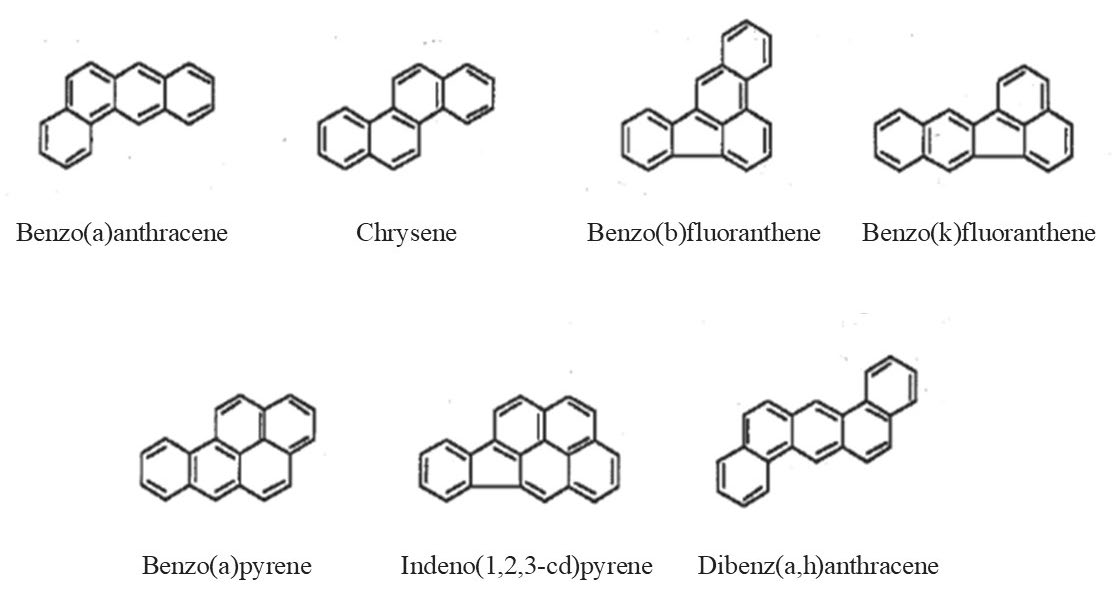
Figure 1. Molecular structures of the 7 polycyclic aromatic hydrocarbons (PAHs) classified as carcinogenic to humans by the IARC Monographs Programme, out of the 16 priority PAHs (IARC, 2010).
PAH exposure has been linked to adverse respiratory health outcomes in children. For instance, Barraza-Villarreal et al. (2014) conducted a study on 64 schoolchildren from Mexico City and found a significant negative association between increased concentrations of urinary 2-hydroxyfluorene, a metabolite of PAHs, and lung function parameters, as well as pH of exhaled breath condensate (EBC). Similarly, Zhou et al. (2016) investigated the relationship between urinary metabolite concentrations of PAHs and lung function levels in a 3,053 residents aged 18 to 80 years who had lived for more than 5 years in two communities (one in an urban district and the other in a suburb) in the city of Wuhan, revealing a reduction in lung function associated with total and specific urinary PAH metabolites. Furthermore, Cakmak et al. (2017) explored the associations between PAH exposure and respiratory physiologic measures in cycles 2 and 3 of the Canadian Health Measures Survey, a nationally representative population sample. They observed significant reductions in forced expiratory volume in 1 second (FEV1) and forced vital capacity (FVC) in relation to changes in urinary PAH metabolite concentrations. These findings suggest that exposure to PAHs may have a detrimental impact on lung function in various populations. Additionally, it is worth noting that due to differences in cardiorespiratory development, children are more susceptible to environmental risks compared to adults.
In northern Thailand, a previous study conducted by Leelasittikul et al. (2020) examined the effects of air quality on pulmonary function and functional capacity in children and adults before, during, and after the haze period. The study involved 300 participants from Chiang Mai, Chiang Rai, and Nan Provinces, and measurements of pulmonary function using spirometry and functional exercise capacity using the six-minute walk test (6MWT) test were obtained. The study revealed significant differences in FEV1/FVC in the children's group between the haze and non-haze periods, as well as significant differences in 6MWT in both children and adults between the different periods. The findings indicated that moderate air quality during the haze period posed a risk to the cardiorespiratory system. However, there is currently no research has been conducted regarding the long-term effects of respiratory health associated with exposure to PAHs using internal biomarkers in the northern region of Thailand.
Spirometry is a fundamental test that assesses lung function, diagnosing respiratory conditions, and monitoring their progression by providing key measurements. Forced Expiratory Volume in 1 Second (FEV1), which measures the volume of air forcefully exhaled in the first second after a deep breath, is particularly useful for assessing airway obstruction, with reduced values indicating conditions like asthma and chronic obstructive pulmonary disease (COPD). Forced Vital Capacity (FVC), which measures the total volume of air exhaled after maximal inhalation, serves as an indicator of lung capacity, and a reduced FVC suggests restrictive lung diseases where lung expansion is impaired. Peak Expiratory Flow (PEF) captures the highest speed of exhalation and is a crucial marker for the severity of airway constriction, with lower values often associated with more severe airway obstruction, especially in asthma. Meanwhile, Forced Expiratory Flow (FEF), typically measured at 25-75% of the FVC, provides additional insights into smaller airways' function, and abnormal FEF values can signal early-stage obstructive conditions even before significant changes in FEV1 or FVC are evident. Thus, these spirometry variables together offer a comprehensive view of lung function, enhancing the diagnosis, monitoring, and management of various respiratory diseases (Graham et al., 2019; Kwon et al., 2020).
Biomonitoring of PAH exposure through the measurement of urinary metabolites has been widely employed in epidemiological studies. The quantification of PAH metabolites in urine provides a useful indicator of recent exposure and allows for the assessment of individual variations in PAH uptake and metabolism (Perera et al., 2006; Alghamdi et al., 2015; Grova et al., 2017; Diaz de Leon-Martinez et al., 2021). Nonetheless, as a result of the relatively brief periods of time that these substances remain in the body, the presence of PAHs and their byproducts in blood or urine can solely reflect recent instances of exposure (Li et al., 2012; Gong et al., 2015). Additionally, hair analysis has emerged as a valuable tool for assessing long-term cumulative PAH exposure (Toriba et al., 2003; Li et al., 2016; Palazzi et al., 2018; Lin et al., 2019; Wang et al., 2020; Radarit et al., 2024). The measurement of PAH concentrations in hair samples offers a comprehensive assessment of exposure over an extended period, providing insights into chronic effects on lung function.
Several studies have examined the impact of air pollution on respiratory health, particularly focusing on air quality data from monitoring stations and short-term individual exposure to PAHs. However, research on the long-term effects of individual exposure to PAHs on respiratory health remains limited. Given the distinct differences in cardiorespiratory development, children are more susceptible to environmental risks compared to adults. Therefore, this study aims to investigate the effects of long-term environmental exposure to PAHs on respiratory health and functional capacity among female school students in Chiang Mai Province, Thailand, utilizing hair analysis as a biomonitoring tool to assess PAH exposure levels
MATERIAL AND METHODS
Reagents and materials
The mixture of 15 PAHs, namely acenaphthylene (Acy), acenaphthene (Ace), fluorene (Flu), phenanthrene (Phe), anthracene (Ant), fluoranthene (Fla), pyrene (Pyr), benzo(a)anthracene (BaA), chrysene (Chr), benzo(b)fluoranthene (BbF), benzo(k)fluoranthene (BkF), benzo(a)pyrene (BaP), indenol (1,2,3-cd)pyrene (IcdP), dibenzo(a,h)anthracene (DahA), and benzo(g,h,i)perylene (BghiP), was obtained from Restek (Bellefonte, Pennsylvania, US). Acenaphthene-D10 and Pyrene-D12 from Supelco, Inc. (Bellefonte, Pennsylvania, US) were used as internal standards for quantifying PAHs. Hexanes (Hex) and dichloromethane (DCM) were procured from J.T. Baker® (Radnor, Pennsylvania, US). Sodium Chloride (99%) was purchased from RCI Labscan Ltd (Bangkok, Thailand).
Study design and target population
This study is a component of our broader research project, as illustrated in Figure 2. In order to investigate the impact of prolonged exposure to PAHs on respiratory function and functional exercise capacity in children with lungs that are still developing, a cross-sectional study was conducted among female school students. The study was carried out at Navamindarajudis Phayap School and Horpra School in Chiang Mai, Thailand. A total of 352 participants were enrolled in the study. Specifically, the study subjects were female students in grades 7 to 9, predominantly aged between 12 and 15 years. Inclusion criteria included having hair longer than twelve centimeters, living in Chiang Mai for at least 12 months, and no prior history of active smoking.
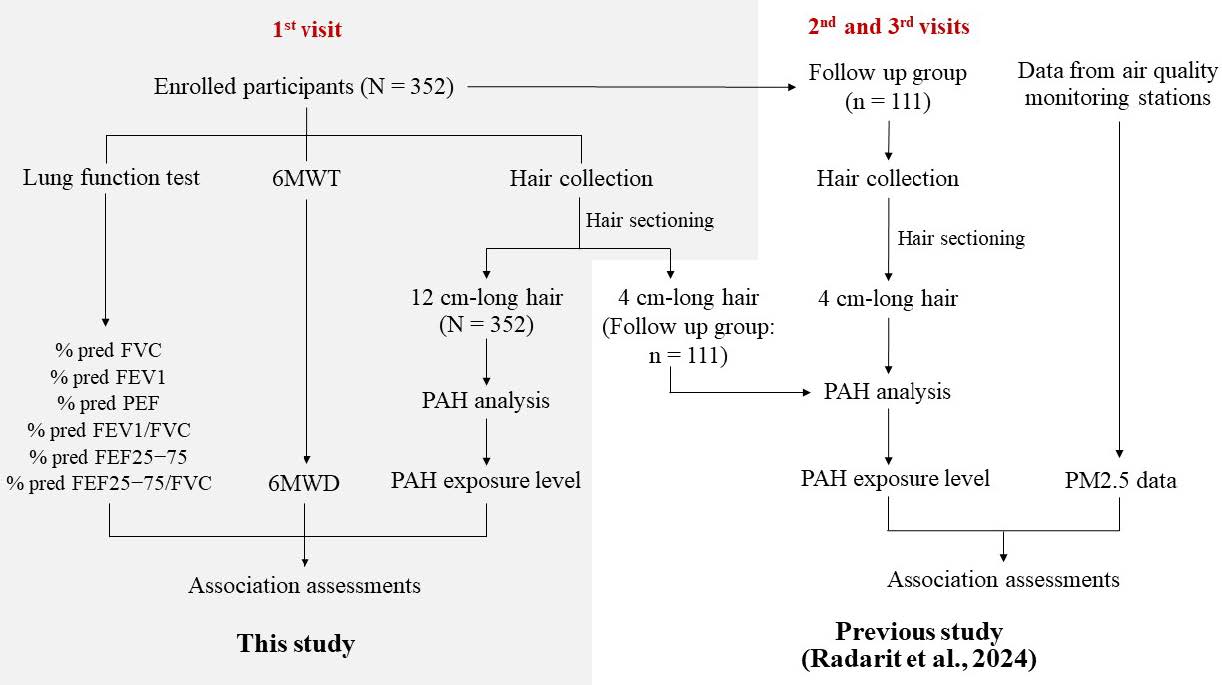
Figure 2. The flowchart of the entire research project, encompassing the research methodology from a previous publication study and the current investigation.
Definition of abbreviations: N = total number of samples; n = number of samples in the follow-up group; PAH = polycyclic aromatic hydrocarbon; 6MWT = six-minute walk test; 6MWD = six-minute walk distance; % pred FVC = the percentage of predicted values for forced vital capacity; % pred FEV1 = the percentage of predicted values for forced expiratory volume in one second; % pred PEF = the percentage of predicted values for peak expiratory flow; % pred FEV1/FVC = the percentage of predicted values for FEV1/FVC ratio; % pred FEF25−75 = the percentage of predicted values for mean forced expiratory flow between 25% and 75% of FVC; and % pred FEF25−75/FVC = the percentage of predicted values for FEF25–75/FVC ratio
Hair collection
In accordance with the guidelines set forth by Society of Hair Testing (2004), which recommend an average monthly hair growth rate of 1 centimeter for human scalp hair, participants were required to have a minimum hair length of 12 centimeters. This criterion was necessary to facilitate analyzing annual PAH concentration levels in the hair samples. Hair samples were obtained from each participant by carefully cutting them from the posterior region of the scalp using stainless steel scissors. The collection site was selected to ensure proximity to the scalp. Following collection, the hair samples were immediately placed in individual polyethylene zip-lock bags, sealed securely with aluminum foil, and properly labeled. Subsequently, the samples were stored at a temperature of 4 °C until they were ready for analysis.
Lung function test
Lung function tests were conducted using an electronic spirometer (Spirolyser Q13, FIM Medical, France), compliant with EN 6060-1, EN 60601-1-2, and ATS 2015 standards. Trained personnel from the Thoracic Society of Thailand under Royal Patronage operated the spirometer, following the standardization of spirometry guidelines provided by the American Thoracic Society/European Respiratory Society (ATS/ERS) (Miller et al., 2005). The lung function parameters considered for statistical analysis included the percentage of predicted values for forced vital capacity (% pred FVC), forced expiratory volume in one second (% pred FEV1), peak expiratory flow (% pred PEF), FEV1/FVC ratio (% pred FEV1/FVC), mean forced expiratory flow between 25% and 75% of FVC (% pred FEF25−75), and FEF25–75/FVC ratio (% pred FEF25−75/FVC).
6MWT
The 6MWT was conducted by members of the Environmental Health Research Unit at the Research Institute for Health Sciences (RIHES), Chiang Mai University, in accordance with ATS Committee on Proficiency Standards for Clinical Pulmonary Function Laboratories (2002). After completing the pulmonary function test, participants were instructed to rest by sitting on a chair positioned near the initial location for a minimum of 10 minutes before commencing the 6MWT. The 6MWT was conducted indoors along an elongated, level, unobstructed corridor with a solid surface that is infrequently traversed, following the guidelines outlined by the American Thoracic Society (Ats statement, 2002). After walking for 6 minutes, the total distance covered by each participant was meticulously documented.
PAH analysis
The analysis method used to quantify concentrations of PAHs in hair has been previously described (Radarit et al., 2024). Briefly, the protocol involved obtaining a 12 cm long raw human hair sample to capture exposure over a year. The sample was washed three times in 5 mL of n-hexane, cut into fine pieces, and weighed (25 mg) into a test tube. Acenaphthene-D10 and Pyrelene-D12 were added as internal standards, and the hair was digested in an alkaline solution (1.5 M NaOH) overnight. The PAHs were then extracted using a liquid-liquid extraction method with a hexane/dichloromethane mixture (2:1 v/v). The extracted solution was centrifuged, and the upper layer was collected. This process was repeated three times, and the organic phase was combined. The extraction solution was filtered using a 0.2 μm PTFE filter, concentrated to 200 μL via evaporation under a rotary evaporator, and analyzed using gas chromatography (Agilent 7890A, US) coupled with a mass spectrometer (MS, Agilent 5975A, US) equipped with an HP-5MS capillary column (30 m x 0.25 mm x 0.25 μL). Fifteen specific PAHs (Acy, Ace, Flu, Phe, Ant, Fla, Pyr, BaA, Chr, BbF, BkF, BaP, IcdP, DahA, and BghiP) were analyzed. A laboratory blank (prepared by adding reagents in the same order and concentration as used in the sample preparation process but omitting the actual sample) and two quality control samples (pooled hair spiked with 0.8 ppb of a mixed PAH standard) were included in each batch of analysis. The calibration curve of the standard PAHs was examined at seven concentration levels, ranging from a minimum of 0.2 ppb (1.6 ng/g hair) to a maximum of 19.2 ppb (153.6 ng/g hair). The amount of PAHs was quantified by determining the area ratios between the analyte and the internal standards. The concentrations of PAHs in the samples were calculated by subtracting the PAH concentration of the corresponding blank. Analytical quality control was described in our previous study (Radarit et al., 2024). Briefly, the recoveries for the intraday assay ranged from 91% to 108%, while those for the interday assay ranged from 78% to 118%. The relative standard deviations (RSD%) for intraday precision study of all PAHs were in the range of 1-12%, and for the interday assay, they were in the range of 2-18%. The limits of detection (LOD) for individual PAHs were as follows: Acy (0.27 ng/g hair), Ace (0.14 ng/g hair), Flu (0.24 ng/g hair), Phe (0.80 ng/g hair), Ant (0.23 ng/g hair), Fla (0.33 ng/g hair), Pyr (0.36 ng/g hair), BaA (0.16 ng/g hair), Chr (0.31 ng/g hair), BbF (0.62 ng/g hair), BkF (0.32 ng/g hair), BaP (0.30 ng/g hair), IcdP (0.37 ng/g hair), DahA (0.58 ng/g hair), and BghiP (0.51 ng/g hair).
Ethical approval
The research protocol underwent the necessary ethical review process and was submitted to the Human Experiment Committee at the Research Institute for Health Sciences (RIHES), Chiang Mai University, Thailand, for approval before commencing sample collection activities under project No. 3/63. Written informed consent was obtained from both the subjects and their parents or legal guardians, indicating their voluntary agreement to participate in the study.
Statistical analysis
All statistical analyses were conducted using SPSS software version 23.0. The levels of hair PAHs were divided into quartiles based on their distribution among all the participants: Q1 = lowest quartile (1 to 25%); Q2 = the second quartile (26 to 50%); Q3 = the third quartile (51-75%); and Q4 = the top quartile (76-100%). One-way analysis of variance (ANOVA) was applied to compare baseline characteristics, six-minute walk distance (6MWD) and lung function parameters by quartiles of totals PAH, and differences between mean values were assessed using Duncan multiple range tests (P < 0.05).
Associations between hair PAHs and health outcomes (6MWD, % pred FVC, % pred FEV1, % pred PEF, % pred FEV1/FVC, % pred FEF25−75 and % pred FEF25−75/FVC) were assessed using linear mixed models with subjects as a random effect. Associations were quantified by using estimated changes and 95% confidence intervals (CIs) in lung function and functional exercise capacity for the second, third, and fourth quartiles of PAHs in hair, with comparison to the first quartile (categorical analyses).
RESULTS
PAHs in hair
Among the 15 PAHs examined, nine were quantitatively assessed in hair samples collected from 352 female students, albeit Phe, Ant, Pyr, BaA, and Chr were not detected in all samples. The frequency of positive detections ranged from 19% (BaA) to 100% (Acy, Ace, Flu and Fla). The median concentrations of Acy, Ace, Flu, Phe, Ant, Fla, Pyr, BaA, Chr, and the total PAHs were 6.3, 6.7, 2.9, 7.4, 1.6, 4.5, 3.9, 1.5, 2.0, and 33.7 ng/g hair, respectively. The levels of PAHs in hair were stratified into quartiles (Q1-Q4) based on their distribution among all participants, as detailed in Table 1.
Table 1. Concentrations and quartiles of total polycyclic aromatic hydrocarbons (∑PAHs) in hair samples of all participants (n = 352).
|
PAHs |
Blank (ng/g hair) |
PAHs in hair (ng/g hair) |
Quartile of PAHs in hair (ng/g hair)* |
|||||
|
Median [range] |
Detection (%) |
Median [range] |
Q1 |
Q2 |
Q3 |
Q4 |
||
|
Acy |
n.d. |
100% |
6.3 [4.4 to 77.3] |
≤ 5.8 |
5.9 - 6.5 |
6.6 - 7.2 |
> 7.2 |
|
|
Ace |
n.d. |
100% |
6.7 [3.2 to 118.8] |
≤ 6.2 |
6.3 - 7.3 |
7.4 - 8.2 |
> 8.2 |
|
|
Flu |
n.d. |
100% |
2.9 [2.0 to 84.0] |
≤ 2.9 |
3.0 - 3.2 |
3.3 - 3.9 |
> 3.9 |
|
|
Phe |
3.6 [2.6 to 4.8] |
98% |
7.4 [2.8 to 194.5] |
≤ 8.6 |
8.7 - 12.7 |
12.8 - 21.4 |
> 21.4 |
|
|
Ant |
n.d. |
86% |
1.6 [0.8 to 24.6] |
≤ 1.8 |
1.9 - 2.6 |
2.7 - 4.3 |
> 4.3 |
|
|
Fla |
n.d. |
100% |
4.5 [1.6 to 70.0] |
≤ 6.9 |
7.0 - 10.0 |
10.1 – 20.0 |
> 20.0 |
|
|
Pyr |
n.d. |
97% |
3.9 [1.3 to 75] |
≤ 7.4 |
7.5 - 11.9 |
12 - 19.5 |
> 19.5 |
|
|
BaA |
n.d. |
19% |
1.5 [0.5 to 32.6] |
≤ 1.2 |
1.3 - 2.1 |
2.1 - 3.4 |
> 3.4 |
|
|
Chr |
n.d. |
31% |
2.0 [1.1 to 32.2] |
≤ 1.6 |
1.7 - 2.9 |
3 - 5.3 |
> 5.3 |
|
|
∑PAHs |
- |
|
- |
33.7 [18.7 to 334.1] |
≤ 47.8 |
47.9 - 63.2 |
63.3 - 95.8 |
> 95.8 |
Note: Definition of abbreviations: n.d. = not detected Acy = acenaphthylene, Ace = acenaphthene, Flu = fluorene, Phe = phenanthrene, Ant = anthracene, Fla = fluoranthene, Pyr = pyrene, BaA = benzo (a) anthracene, Chr = chrysene
* The levels of hair PAHs were divided into quartiles based on their distribution among all the participants: Q1 = lowest quartile (1 to 25%); Q2 = the second quartile (26 to 50%); Q3 = the third quartile (51-75%); and Q4 = the top quartile (76-100%).
Baseline characteristics
The baseline characteristics of the participants categorized into quartiles of ∑PAHs are presented in Table 2. The average age of all 352 participants was 13.25 ± 0.97 years. The mean BMI registered at 21.42 ± 5.00 kg/m2. The mean exercise frequency was 1.54 ± 2.04 times per week. Notably, all participants were nonsmokers, while 37.78% were exposed to passive smoking. Upon analysis, no significant differences were observed in age, BMI, exercise frequency, or the prevalence of passive smoking among the quartiles of ∑PAHs (P > 0.05).
Table 2. Baseline characteristics of study participants by quartiles of total polycyclic aromatic hydrocarbons (∑PAHs) in hair samples of all participants (n = 352).
|
Characteristics |
All Participants |
Quartile of total PAHs (ng/g hair)1 |
P value2 |
|||
|
Q1 ≤ 47.8 |
Q2 47.9 - 63.2 |
Q3 63.3 - 95.8 |
Q4 > 95.8 |
|||
|
No. subjects |
352 |
88 |
88 |
88 |
88 |
|
|
Age (year) |
13.25 ± 0.97 |
13.13 ± 0.85 |
13.26 ± 0.91 |
13.39 ± 0.95 |
13.20 ± 1.16 |
0.355 |
|
BMI (kg/m2) |
21.42 ± 5.00 |
21.86 ± 5.29 |
21.38 ± 5.10 |
20.99 ± 4.18 |
21.55 ± 5.26 |
0.805 |
|
Exercise frequency (time/week) |
1.54 ± 2.04 |
1.59 ± 2.16 |
1.58 ± 1.96 |
1.51 ± 2.05 |
1.55 ± 2.10 |
0.994 |
|
Passive smoking (no.(%)) |
133 (37.78) |
26 (7.38) |
31 (8.80) |
43 (12.21) |
33 (9.37) |
0.286 |
Note: Definition of abbreviations: BMI = body mass index
1 The levels of total PAH in hair were divided into quartiles based on their distribution among all the participants: Q1 = lowest quartile (1 to 25%); Q2 = the second quartile (26 to 50%); Q3 = the third quartile (51-75%); and Q4 = the top quartile (76-100%).
2 p value of one-way ANOVA for different means of characteristics in all quartiles
Lung function and 6MWD
The baseline lung function and 6MWD of the participants categorized by quartiles of ∑PAHs are presented in Table 3. Comparing quartiles of ∑PAHs, we noted that % pred FEV1/FVC at Q2 and Q4 were significantly lower than at Q1 (P < 0.05). Additionally, % pred FEV1/FVC at Q3 was marginally lower than at Q1 (P > 0.05). However, no differences were observed in other lung function parameters and 6MWD across the quartiles of ∑PAHs.
Table 3. Lung function and six-minute walk distance (6MWD) of all participants by quartiles of total polycyclic aromatic hydrocarbon (∑PAHs) in hair samples (n = 352).
|
Parameters |
Quartile of total PAHs (ng/g hair)1 |
p value2 |
|||||||||
|
Q1 ≤ 47.8 |
Q2 47.9 - 63.2 |
Q3 63.3 - 95.8 |
Q4 > 95.8 |
||||||||
|
6MWD (m) |
425.2 [270.2 to 555.0] |
413.7 [339.2 to 510.0] |
426.4 [287.0 to 547.2] |
420.6 [292.7 to 506.5] |
0.194 |
||||||
|
% pred FVC (%) |
92.6 [54.0 to 115.8] |
90.4 [62.9 to 120.7] |
89.9 [56.6 to 112.6] |
91.8 [69.5 to 123.1] |
0.524 |
||||||
|
% pred FEV1 (%) |
99.4 [57.6 to 120.7] |
94.8 [67.6 to 119.7] |
95.4 [63.7 to 120.3] |
98.3 [69.1 to 126.9] |
0.357 |
||||||
|
% pred PEF (%) |
98.9 [51.8 to 146.4] |
91.7 [46.2 to 137.8] |
94.3 [61.8 to 138.3] |
95.2 [62.8 to 125.0] |
0.084 |
||||||
|
% pred FEV1/FVC (%) |
107.8 [96.5 to 114.9]b |
106.7 [83.9 to 113.6]a |
107.7 [86.5 to 113.7]ab |
105.6 [91.0 to 113.6]a |
0.031* |
||||||
|
% pred FEF25to75 (%) |
92.7 [49.8 to 126.0] |
87.1 [40.8 to 125.9] |
87.2 [36.3 to 137.3] |
84.1 [43.2 to 133.0] |
0.170 |
||||||
|
% pred FEF25to75/FVC (%) |
97.7 [68.5 to 225.0] |
99.1 [41.3 to 158.7] |
96.4 [45.8 to 172.0] |
90.9 [53.8 to 166.9] |
0.120 |
||||||
Note: Definition of abbreviations: 6MWD = six-minute walk distance; % pred FVC = the percentage of predicted values for forced vital capacity; % pred FEV1 = the percentage of predicted values for forced expiratory volume in one second; % pred PEF = the percentage of predicted values for peak expiratory flow; % pred FEV1/FVC = the percentage of predicted values for FEV1/FVC ratio; % pred FEF25−75 = the percentage of predicted values for mean forced expiratory flow between 25% and 75% of FVC; and % pred FEF25−75/FVC = the percentage of predicted values for FEF25–75/FVC ratio
1 The levels of total PAH in hair were divided into quartiles based on their distribution among all the participants: Q1 = lowest quartile (1 to 25%); Q2 = the second quartile (26 to 50%); Q3 = the third quartile (51-75%); and Q4 = the top quartile (76-100%).
2 P value of one-way ANOVA for different means of parameters in all quartiles
3 Different letters indicate a significant difference among health parameters by quartiles of total PAHs (P < 0.05).
Association between PAH concentrations in hair and lung function
The study revealed significant inverse correlations between lung function and both individual PAHs as well as total PAHs (Figure 3). Specifically, statistically significant relationships were detected between heightened levels of Flu in hair samples at Q2 and subsequent declines of 3.63% and 4.29% in % pred FVC and % pred FEV1, respectively, in comparison to the lowest quartile (Q1) (P < 0.05). Furthermore, significant associations were established between elevated concentrations of Acy at Q4, Flu at Q2, Flu at Q4, and total PAHs at Q2, resulting in reductions of 5.17%, 5.30%, 4.99%, and 5.88%, respectively, in % pred PEF relative to Q1 (P < 0.05). Likewise, notable associations were identified between elevated concentrations of Acy at Q4, Flu at Q4, BaA at Q4, total PAHs at Q2, and total PAHs at Q4, leading to decreases of 2.20%, 1.50%, 3.79%, 2.02%, and 1.90%, respectively, in % pred FEV1/FVC relative to Q1 (P < 0.05). Additionally, statistically significant associations were established between elevated concentrations of Acy at Q4, Ace at Q2, Flu at Q3, Flu at Q4, Pyr at Q2, and BaA at Q4, resulting in reductions of 6.50%, 7.01%, 5.58%, 5.79%, 5.81%, and 14.78%, respectively, in % pred FEF25−75 relative to Q1 (P < 0.05). Lastly, significant associations were observed between elevated concentrations of Acy at Q4, Ace at Q2, Ace at Q3, Ace at Q4, BaA at Q4, and total PAHs at Q4, leading to decreases of 10.14%, 8.49%, 7.62%, 8.33%, 14.06%, and 8.13%, respectively, in % pred FEF25−75/FVC, relative to Q1 (P < 0.05).
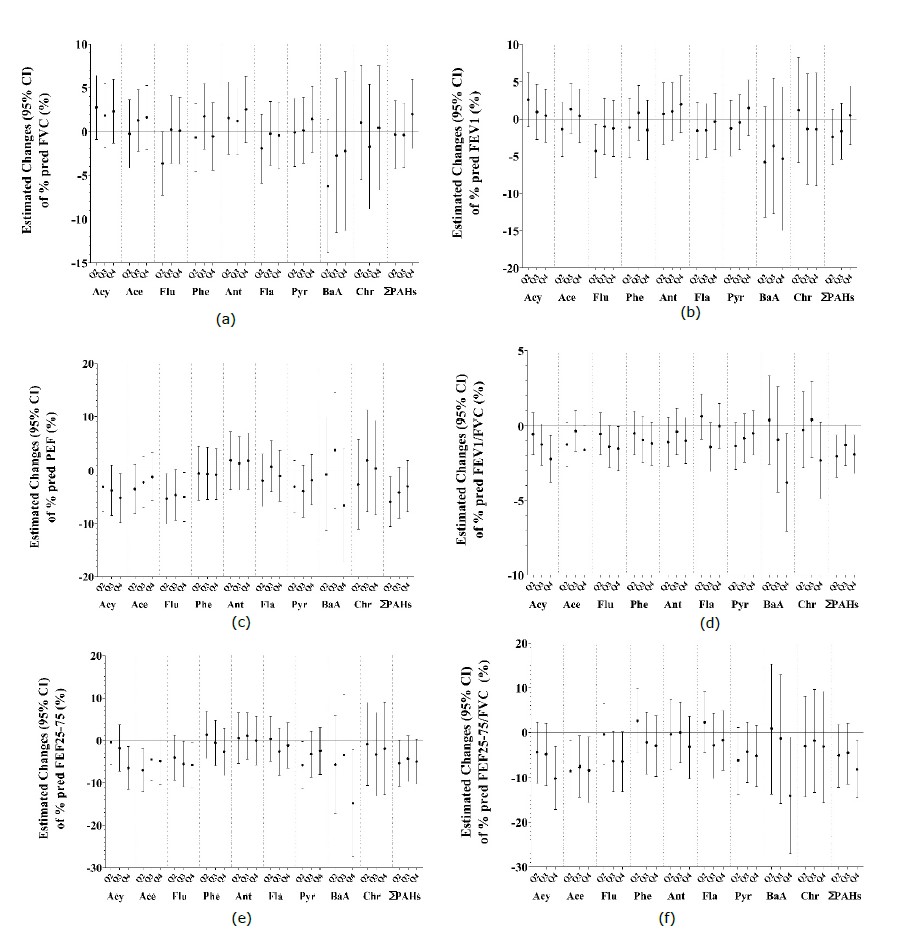
Figure 3. Estimated changes in health outcomes for: (a) the percentage of predicted values for forced vital capacity (% pred FVC); (b) the percentage of predicted values for forced expiratory volume in one second (% pred FEV1); (c) the percentage of predicted values for peak expiratory flow (% pred PEF); (d) the percentage of predicted values for FEV1/FVC ratio (% pred FEV1/FVC); (e) the percentage of predicted values for mean forced expiratory flow between 25% and 75% of FVC (% pred FEF25−75); and (f) the percentage of predicted values for FEF25–75/FVC ratio (% pred FEF25−75/FVC), with each quartile (Q2, Q3, and Q4) of PAHs (Acy = acenaphthylene, Ace = acenaphthene, Flu = fluorene, Phe = phenanthrene, Ant = anthracene, Fla = fluoranthene, Pyr = pyrene, BaA = benzo(a)anthracene, Chr = chrysene and ∑PAHs = total PAHs) compared to the reference level (Q1). The results were obtained from linear mixed models with subjects as a random effect. The midpoint indicates the mean concentration changes in PAHs, and the vertical error bars indicate the 95% confidence interval of mean changes.
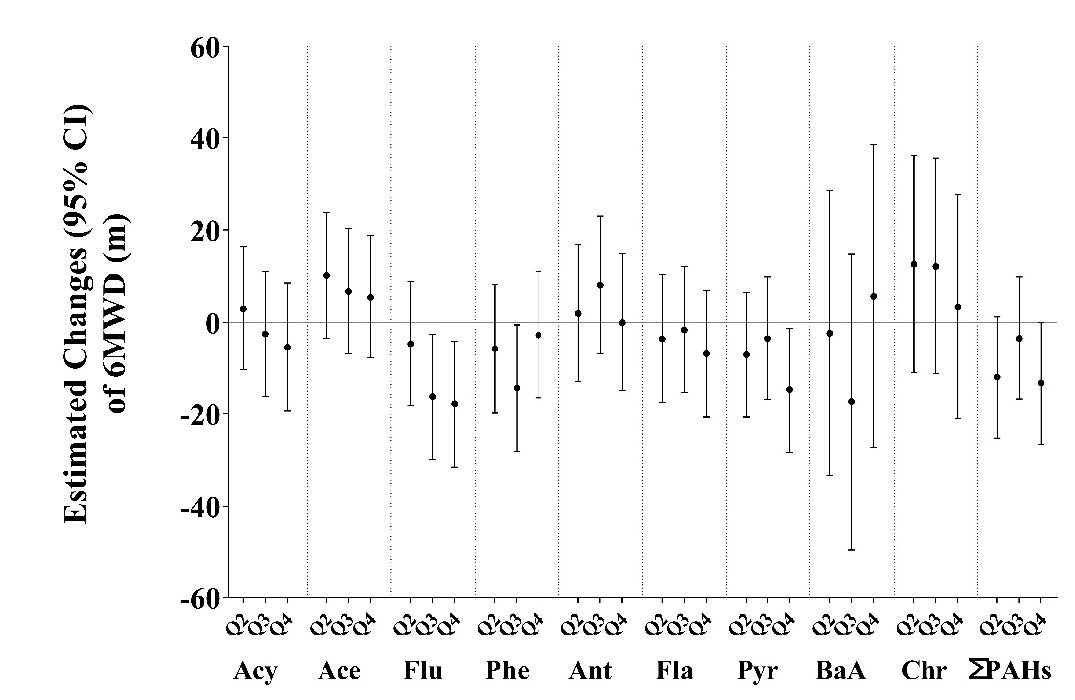
Figure 4. Estimated changes in six-minute walk distance (6MWD), with each quartile (Q2, Q3, and Q4) of PAHs (Acy = acenaphthylene, Ace = acenaphthene, Flu = fluorene, Phe = phenanthrene, Ant = anthracene, Fla = fluoranthene, Pyr = pyrene, BaA = benzo(a)anthracene, Chr = chrysene and ∑PAHs = total PAHs) compared to the reference level (Q1). The results were obtained from linear mixed models with subjects as a random effect. The midpoint indicates the mean concentration changes in PAHs, and the vertical error bars indicate the 95% confidence interval of mean changes.
DISCUSSION
The comprehensive analysis conducted in this study sheds light on the intricate relationships between PAHs exposure, respiratory health, and functional exercise capacity among female students.
Among the 15 PAHs examined, nine were quantitatively assessed in hair samples collected from 352 participants. The frequency of positive detections ranged widely among the PAHs, from 19% for BaA to 100% for Acy, Ace, Flu, and Fla. These variations in detection frequencies may reflect different PAH profiles among subjects and suggest diverse sources of PAH exposure, including combustion processes, industrial activities, and environmental pollution (Mallah et al., 2022; World Health Organization, 2016). Low molecular weight (LMW) PAHs are typically emitted from low-temperature combustion, such as wood burning and open biomass burning (Wang et al., 2015; Wu et al., 2020), while high molecular weight (HMW) PAHs are more likely associated with vehicle emissions, including those from diesel and gasoline engines (Wang et al., 2009; Wang et al., 2015). However, further evidence is needed to determine whether the detection rate of each chemical in hair can reliably identify specific sources or routes of exposure. Additionally, exposure patterns differ among individuals due to variations in physiological factors such as respiratory rates. The respiratory rate, or the number of breaths taken per minute, significantly influences the volume of air inhaled and, consequently, the amount of pollutants, including polycyclic aromatic hydrocarbons (PAHs), that individuals are exposed to. Individuals with higher respiratory rates inhale more air over the same period, which can lead to a potentially greater intake of airborne contaminants compared to those with lower respiratory rates (Yang et al., 2021). Similar studies have reported variations in PAH exposure levels and detection frequencies among different populations and geographic regions (Wang et al., 2016; Lin et al., 2019; Wang et al., 2020; Radarit et al., 2024). Moreover, the identification of specific PAHs with higher detection frequencies and concentrations may inform targeted interventions to mitigate exposure and reduce associated health risks.
In this study, we examined the baseline characteristics of participants, categorized into quartiles based on the concentration of ∑PAHs. Intriguingly, despite variations in PAH exposure levels across quartiles, no significant differences were detected in age, BMI, exercise frequency, or the prevalence of passive smoking among the quartiles of ∑PAHs (P > 0.05). This suggests a remarkable consistency in demographic and lifestyle factors across the different exposure groups. Consistent with our findings, our previous study (Radarit et al., 2024) also reported a lack of association between hair PAH concentrations and variables such as age, BMI, traffic exposure time, passive smoking, cooking at home, and consumption of PAH-contaminated foods. However, Zhou et al. (2016) found associations between hydroxylated PAHs (∑OH-PAHs) and various factors including gender, height, weight, BMI, age, physical activity, and smoking status in a larger cohort of 3,698 residents aged 18 to 80 years in Wuhan. This discrepancy could be attributed to the consistency in demographic and lifestyle factors within our study population, as well as the smaller sample size in our study. Nevertheless, it is crucial to thoroughly screen potential covariates to develop optimal models for each experimental design. Therefore, further research is necessary to establish reliable conclusions regarding the influence of these factors on PAH accumulation in human hair.
The results of our study provide significant evidence of the adverse effects of exposure to PAHs on lung function and functional exercise capacity. We observed significant inverse correlations between individual PAHs as well as total PAHs detected in hair samples and various parameters of lung function, including % pred FVC, % pred FEV1, % pred PEF, % pred FEV1/FVC, % pred FEF25−75, and % pred FEF25−75/FVC. Additionally, we found statistically significant negative relationships between elevated concentrations of certain PAHs and the 6MWD, indicating a decline in functional exercise capacity. Comparing our findings with existing research provides valuable insights into the broader implications of PAH exposure on respiratory health. A previous study conducted in a general Chinese population demonstrated associations between urinary PAH metabolites and reduced lung function, supporting our findings of the detrimental effects of PAH exposure on respiratory function (Zhou et al., 2016). Similarly, a study in Mexican schoolchildren found that biomarkers of PAH exposure were inversely associated with lung function parameters, reinforcing the negative impact of PAHs on respiratory health observed in our study (Barraza-Villarreal et al., 2014). Additionally, the study conducted in Canada revealed significant decrements in lung function measures associated with exposure to PAH metabolites, further corroborating our findings and emphasizing the adverse effects of PAH exposure on respiratory physiology (Cakmak et al., 2017). Moreover, a study among coke oven workers highlighted the impairment of pulmonary function due to long-term exposure to PAH-enriched particulate matter, supporting the notion that occupational exposure to PAHs can lead to significant respiratory issues (Shen et al., 2018). Furthermore, a prospective cohort study in northern Thailand demonstrated the negative effects of air pollution, including high levels of PM10, on pulmonary function and cardiovascular endurance across different age groups (Leelasittikul et al., 2020). This study provides further evidence of the adverse impact of poor air quality on respiratory health and functional exercise capacity, supporting our findings regarding the association between PAH exposure and reduced lung function and functional exercise capacity.
However, it is essential to acknowledge that a study conducted on MBBS students found no significant effects of short-term ambient air pollution on functional exercise capacity and pulmonary function in young healthy adults (Agarwal et al., 2019). This suggests that the impacts of air pollution, including PAH exposure, may vary depending on factors such as age, health status, and duration of exposure.
Further research should focus on elucidating the specific biological mechanisms through which PAH exposure impairs lung function and exercise capacity. Investigating how different PAHs affect various aspects of respiratory health could provide insights into the pathways of harm. Additionally, conducting longitudinal studies could help to better understand the long-term health effects of PAH exposure and identify potential thresholds for adverse outcomes. Comparative studies across different populations and geographic regions could enhance the understanding of PAH-related health risks and inform the development of tailored, region-specific health policies and interventions.
CONCLUSION
Our study establishes a significant link between exposure to PAHs and impaired lung function and exercise capacity, evident from the inverse correlations observed between PAH levels in hair samples and various lung function parameters, as well as the 6MWD. This aligns with prior research demonstrating similar associations across diverse populations, emphasizing the urgent need for addressing PAH exposure as a public health priority to safeguard respiratory health. However, variations in the effects of PAH exposure underscore the importance of further research to understand the underlying mechanisms and develop tailored interventions to mitigate its adverse impacts.
ACKNOWLEDGEMENTS
The authors would like to extend our appreciation to the students who actively participated in the study. We also acknowledge and express gratitude for the valuable support provided by Navamindarajudis Phayap School and Horpra School in facilitating the data and sample collection processes. The authors are grateful to the Research Institute for Health Sciences, Chiang Mai University for laboratory and field research support.
AUTHOR CONTRIBUTIONS
Kessaya Radarit was responsible for designing and conducting the research, performing statistical analysis and data visualization, and authoring the manuscript. Tippawan Prapamontol supervised the research conduction and provided review and editing for the manuscript. Pitakchon Ponsawansong, Kawinwut Somsunun, Nathaporn Thongjan, and Teetawat Santijitpakdee assisted with the data and sample collection processes. All authors have read and given their approval for the final version of the manuscript.
CONFLICT OF INTEREST
The authors declare that they hold no competing interests.
REFERENCES
Agarwal, S., Bhardwaj, A., and Singh, M. 2019. Effect of ambient air quality on functional exercise capacity and pulmonary function in healthy young adults. Indian Journal of Clinical Anatomy and Physiology. 6(1): 109-112.
Alghamdi, M.A., Alam, M.S., Stark, C., Mohammed, N., Harrison, R.M., Shamy, M., Khoder, M.I., Shabbaj, I.I., and Göen, T. 2015. Urinary metabolites of polycyclic aromatic hydrocarbons in Saudi Arabian schoolchildren in relation to sources of exposure. Environmental Research. 140: 495-501.
ATS Committee on Proficiency Standards for Clinical Pulmonary Function Laboratories. 2002. Ats statement: Guidelines for the six-minute walk test. American Journal of Respiratory and Critical Care Medicine. 166: 111-117.
Ats statement. 2002. American Journal of Respiratory and Critical Care Medicine. 166(1): 111-117.
Barraza-Villarreal, A., Escamilla-Nunez, M.C., Schilmann, A., Hernandez-Cadena, L., Li, Z., Romanoff, L., Sjodin, A., Del Rio-Navarro, B.E., Diaz-Sanchez, D., Diaz-Barriga, F. et al. 2014. Lung function, airway inflammation, and polycyclic aromatic hydrocarbons exposure in Mexican schoolchildren: A pilot study. Journal of Occupational and Environmental Medicine. 56(4): 415-419.
Cakmak, S., Hebbern, C., Cakmak, J.D., and Dales, R.E. 2017. The influence of polycyclic aromatic hydrocarbons on lung function in a representative sample of the Canadian population. Environmental Pollution. 228: 1-7.
Diaz de Leon-Martinez, L., Flores-Ramírez, R., Rodriguez-Aguilar, M., Berumen-Rodríguez, A., Pérez-Vázquez, F.J., and Díaz-Barriga, F. 2021. Analysis of urinary metabolites of polycyclic aromatic hydrocarbons in precarious workers of highly exposed occupational scenarios in Mexico. Environmental Science and Pollution Research. 28(18): 23087-23098.
Gong, J., Zhu, T., Kipen, H., Rich, D.Q., Huang, W., Lin, W.T., Hu, M., and Zhang, J.J. 2015. Urinary polycyclic aromatic hydrocarbon metabolites as biomarkers of exposure to traffic-emitted pollutants. Environment International. 85: 104-110.
Graham, B.L., Steenbruggen, I., Miller, M.R., Barjaktarevic, I.Z., Cooper, B.G., Hall, G.L., Hallstrand, T.S., Kaminsky, D.A., McCarthy, K., and McCormack, M.C. 2019. Standardization of spirometry 2019 update. An official American thoracic society and european respiratory society technical statement. American Journal of Respiratory and Critical Care Medicine. 200(8): e70-e88.
Grova, N., Faÿs, F., Hardy, E., and Appenzeller, B. 2017. New insights into urine-based assessment of polycyclic aromatic hydrocarbon-exposure from a rat model: Identification of relevant metabolites and influence of elimination kinetics. Environmental Pollution. 228: 484-495.
IARC. 2010. Some non-heterocyclic polycyclic aromatic hydrocarbons and some related exposures. IARC Monographs on the Evaluation of Carcinogenic Risks to Humans. 92: 1-853.
International Agency for Research on Cancer. 1983. IARC Monographs on the Evaluation of Carcinogenic Risk of Chemicals to Humans: Polynuclear aromatic compounds, part 1, chemical, environmental and experimental data. Lyon, France: World Health Organization.
Khalili, N.R., Scheff, P.A., and Holsen, T.M. 1995. PAH source fingerprints for coke ovens, diesel and, gasoline engines, highway tunnels, and wood combustion emissions. Atmospheric Environment. 29(4): 533-542.
Kwon, D.S., Choi, Y.J., Kim, T.H., Byun, M.K., Cho, J.H., Kim, H.J., and Park, H.J. 2020. Fef25-75% values in patients with normal lung function can predict the development of chronic obstructive pulmonary disease. International Journal of Chronic Obstructive Pulmonary Disease. 2913-2921.
Leelasittikul, K., Koonkumchoo, P., Buranapuntalug, S., Pongpanit, K., and Yuenyongchaiwat, K. 2020. Effect of air quality on cardio-respiratory systems in northern Thailand (Chiang Mai, Chiang Rai and Nan province). Chiang Mai University Journal of Natural Sciences. 19(4): 702-717.
Li, Z., Romanoff, L., Bartell, S., Pittman, E.N., Trinidad, D.A., McClean, M., Webster, T.F., and Sjödin, A. 2012. Excretion profiles and half-lives of ten urinary polycyclic aromatic hydrocarbon metabolites after dietary exposure. Chemical Research in Toxicology. 25(7): 1452-1461.
Li, Z., Wang, B., Ge, S., Yan, L., Liu, Y., Li, Z., and Ren, A. 2016. A simultaneous analysis method of polycyclic aromatic hydrocarbons, nicotine, cotinine and metals in human hair. Environmental Pollution. 219: 66-71.
Lin, M., Tang, J., Ma, S., Yu, Y., Li, G., Mai, B., Fan, R., and An, T. 2019. Simultaneous determination of polybrominated diphenyl ethers, polycyclic aromatic hydrocarbons and their hydroxylated metabolites in human hair: A potential methodology to distinguish external from internal exposure. Analyst. 144(24): 7227-7235.
Mallah, M.A., Changxing, L., Mallah, M.A., Noreen, S., Liu, Y., Saeed, M., Xi, H., Ahmed, B., Feng, F., and Mirjat, A.A. 2022. Polycyclic aromatic hydrocarbon and its effects on human health: An overeview. Chemosphere. 296: 133948.
Miller, M.R., Hankinson, J., Brusasco, V., Burgos, F., Casaburi, R., Coates, A., Crapo, R., Enright, P., van der Grinten, C.P., Gustafsson, P. et al. 2005. Standardisation of spirometry. European Respiratory Journal. 26(2): 319-338.
Palazzi, P., Mezzache, S., Bourokba, N., Hardy, E.M., Schritz, A., Bastien, P., Emond, C., Li, J., Soeur, J., and Appenzeller, B.M. 2018. Exposure to polycyclic aromatic hydrocarbons in women living in the Chinese cities of Baoding and Dalian revealed by hair analysis. Environment International. 121: 1341-1354.
Perera, F.P., Rauh, V., Whyatt, R.M., Tsai, W.-Y., Tang, D., Diaz, D., Hoepner, L., Barr, D., Tu, Y.-H., and Camann, D. 2006. Effect of prenatal exposure to airborne polycyclic aromatic hydrocarbons on neurodevelopment in the first 3 years of life among inner-city children. Environmental Health Perspectives. 114(8): 1287-1292.
Radarit, K., Wiriya, W., Chai-Adisaksopha, C., Chantara, S., and Prapamontol, T. 2024. Significantly increased accumulations of PAHs in scalp hair during smoke-haze period among female adolescents in Chiang Mai, Thailand. Natural and Life Sciences Communications. 23(1): e2024013.
Shen, M., Xing, J., Ji, Q., Li, Z., Wang, Y., Zhao, H., Wang, Q., Wang, T., Yu, L., Zhang, X. et al. 2018. Declining pulmonary function in populations with long-term exposure to polycyclic aromatic hydrocarbons-enriched pm2.5. Environmental Science & Technology. 52(11): 6610-6616.
Slezakova, K., Castro, D., Pereira, M.d.C., Morais, S., Delerue-Matos, C., and Alvim-Ferraz, M. 2009. Influence of tobacco smoke on carcinogenic PAH composition in indoor pm10 and pm2.5. Atmospheric Environment. 43(40): 6376-6382.
Society of Hair Testing. 2004. Recommendations for hair testing in forensic cases. Forensic Science International. 145(2–3): 83-84.
Toriba, A., Kuramae, Y., Chetiyanukornkul, T., Kizu, R., Makino, T., Nakazawa, H., and Hayakawa, K. 2003. Quantification of polycyclic aromatic hydrocarbons (PAHs) in human hair by hplc with fluorescence detection: A biological monitoring method to evaluate the exposure to pahs. Biomedical Chromatography. 17: 126-132.
Wang, B., Li, Z., Ma, Y., Qiu, X., and Ren, A. 2016. Association of polycyclic aromatic hydrocarbons in housewives' hair with hypertension. Chemosphere. 153: 315-321.
Wang, C., Zhou, S., Wu, S., Tang, J., Li, H., and Du, J. 2020. Exposure to polycyclic aromatic hydrocarbons (PAHs) in people living in urban and rural areas as revealed by hair analysis. Chemosphere. 246: 125764.
Wang, D., Tian, F., Yang, M., Liu, C., and Li, Y.-F. 2009. Application of positive matrix factorization to identify potential sources of PAHs in soil of Dalian, China. Environmental Pollution. 157(5): 1559-1564.
Wang, F., Lin, T., Feng, J., Fu, H., and Guo, Z. 2015. Source apportionment of polycyclic aromatic hydrocarbons in pm2. 5 using positive matrix factorization modeling in Shanghai, China. Environmental Science: Processes & Impacts. 17(1): 197-205.
World Health Organization. 2016. Ambient air pollution: A global assessment of exposure and burden of disease. Switzerland: World Health Organization.
Wu, J., Li, J., Ma, M., and Zhang, D. 2020. Source apportionment of soil PAH concentration and associated carcinogenic and mutagenic potencies by combined utilization of pmf and toxic assessment: A case study in north china. Soil and Sediment Contamination: An International Journal. 29(4): 421-437.
Yang, L., Zhang, H., Zhang, X., Xing, W., Wang, Y., Bai, P., Zhang, L., Hayakawa, K., Toriba, A., and Tang, N. 2021. Exposure to atmospheric particulate matter-bound polycyclic aromatic hydrocarbons and their health effects: A review. International Journal of Environmental Research and Public Health. 18(4): 2177.
Zhou, Y., Sun, H., Xie, J., Song, Y., Liu, Y., Huang, X., Zhou, T., Rong, Y., Wu, T., Yuan, J. et al. 2016. Urinary polycyclic aromatic hydrocarbon metabolites and altered lung function in Wuhan, China. American Journal of Respiratory and Critical Care Medicine. 193(8): 835-846.
OPEN access freely available online
Natural and Life Sciences Communications
Chiang Mai University, Thailand. https://cmuj.cmu.ac.th
Supplementary Materials
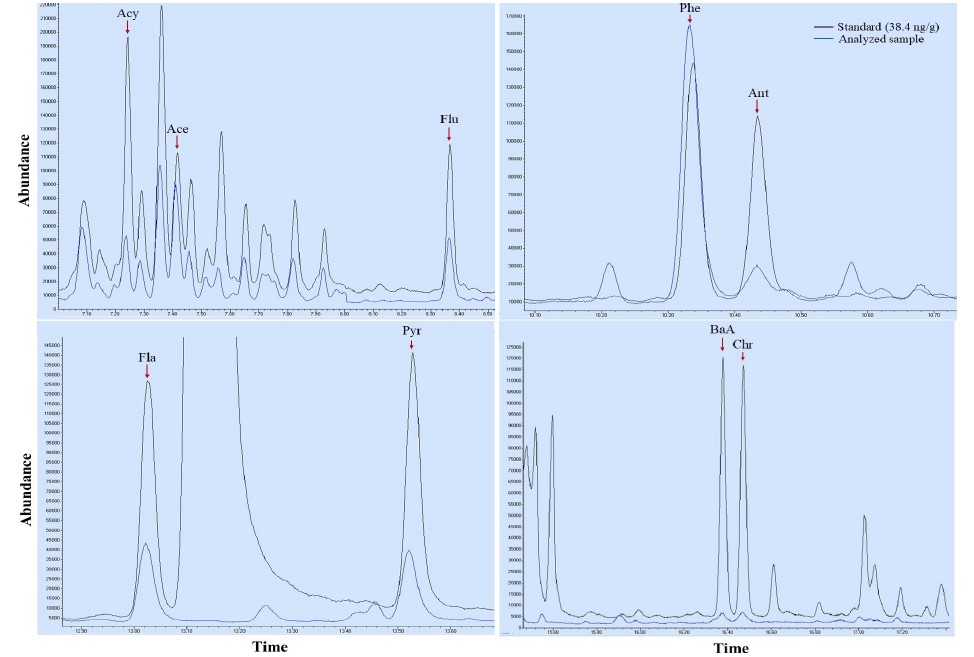
Figure S1. GC-MS chromatograms of polycyclic aromatic hydrocarbons (PAHs) from a standard spiked sample (38.4 ng/g, black line) and an analyzed hair sample (blue line). The PAHs identified include acenaphthylene (Acy), acenaphthene (Ace), fluorene (Flu), phenanthrene (Phe), anthracene (Ant), fluoranthene (Fla), pyrene (Pyr), benzo[a]anthracene (BaA), and chrysene (Chr).
Table S1. Lung function and six-minute walk distance (6MWD) of all participants by quartiles of PAHs in hair samples (n = 352).
|
PAHs |
Quartile* |
Lung Function Parameters (median [range]) |
6MWD (m) (median [range]) |
|||||||||
|
pFVC (%) |
pFEV1 (%) |
pPEF (%) |
pFEV1/FVC (%) |
pFEF25to75 (%) |
pFEF25to75/FVC (%) |
|||||||
|
Total PAHs |
Q1 |
92.60 [54.05 to 115.84] |
99.40 [57.66 to 120.73] |
98.95 [51.87 to 146.48] |
107.82 [96.55 to 114.94] |
92.71 [49.85 to 126.01] |
97.78 [68.57 to 225.00] |
425.25 [270.20 to 555.00] |
||||
|
Q2 |
90.45 [62.90 to 120.75] |
94.86 [67.61 to 119.76] |
91.76 [46.24 to 137.86] |
106.78 [83.91 to 113.64] |
87.11 [40.87 to 125.97] |
99.12 [41.35 to 158.77] |
413.75 [339.29 to 510.00] |
|||||
|
Q3 |
89.91 [56.61 to 112.68] |
95.41 [63.75 to 120.33] |
94.30 [61.81 to 138.37] |
107.78 [86.52 to 113.79] |
87.24 [36.33 to 137.35] |
96.44 [45.87 to 172.07] |
426.44 [287.00 to 547.28] |
|||||
|
Q4 |
91.85 [69.55 to 123.10] |
98.35 [69.12 to 126.90] |
95.21 [62.84 to 125.00] |
105.65 [91.01 to 113.64] |
84.17 [43.21 to 133.05] |
90.94 [53.85 to 166.98] |
420.60 [292.71 to 506.54] |
|||||
|
Acy |
Q1 |
91.36 [70.18 to 112.94] |
96.90 [76.19 to 124.23] |
90.10 [62.84 to 110.98] |
106.78 [100.00 to 109.09] |
80.14 [62.99 to 101.75] |
89.95 [77.59 to 104.72] |
401.62 [365.51 to 471.85] |
||||
|
Q2 |
101.61 [70.34 to 108.56] |
100.90 [78.68 to 111.24] |
99.82 [75.00 to 119.51] |
102.25 [96.55 to 112.36] |
90.55 [61.06 to 104.72] |
89.29 [65.71 to 148.18] |
440.85 [357.49 to 510.00] |
|||||
|
Q3 |
87.00 [69.55 to 122.00] |
96.15 [69.12 to 125.41] |
98.35 [67.65 to 118.96] |
106.74 [98.89 to 112.64] |
89.76 [52.52 to 133.05] |
95.28 [72.97 to 152.78] |
420.00 [292.71 to 460.00] |
|||||
|
Q4 |
86.52 [76.03 to 101.47] |
94.09 [72.36 to 106.46] |
101.86 [70.92 to 125.00] |
107.95 [91.95 to 113.64] |
94.58 [43.21 to 127.84] |
100.00 [53.85 to 166.98] |
426.38 [345.00 to 498.39] |
|||||
|
Ace |
Q1 |
85.21 [76.03 to 90.22] |
92.03 [78.63 to 99.19] |
87.18 [70.92 to 109.81] |
108.89 [102.20 to 112.36] |
103.14 [76.12 to 107.54] |
116.96 [96.36 to 127.27] |
424.44 [345.00 to 477.5] |
||||
|
Q2 |
89.41 [70.18 to 112.94] |
94.05 [76.19 to 124.23] |
95.43 [62.84 to 108.57] |
105.59 [100.00 to 112.36] |
83.05 [61.06 to 104.72] |
90.41 [76.15 to 148.18] |
429.66 [399.66 to 510.00] |
|||||
|
Q3 |
90.30 [73.47 to 108.56] |
97.43 [80.00 to 111.24] |
97.44 [73.94 to 125.00] |
106.68 [98.90 to 113.64] |
86.83 [64.13 to 133.05] |
90.26 [76.52 to 166.98] |
428.44 [292.71 to 486.80] |
|||||
|
Q4 |
96.48 [69.55 to 122.00] |
100.86 [69.12 to 125.41] |
103.85 [67.65 to 119.51] |
105.05 [91.95 to 112.64] |
90.04 [43.21 to 129.00] |
95.90 [53.85 to 118.27] |
417.42 [365.51 to 498.39] |
|||||
|
Flu |
Q1 |
81.96 [70.18 to 93.75] |
87.54 [76.19 to 98.89] |
85.70 [62.84 to 108.57] |
107.35 [105.62 to 109.09] |
74.18 [62.99 to 85.37] |
90.31 [89.72 to 90.91] |
424.38 [421.2 to 427.56] |
||||
|
Q2 |
89.69 [70.34 to 102.42] |
98.72 [78.63 to 111.24] |
95.36 [70.92 to 114.05] |
107.95 [102.20 to 112.36] |
92.38 [76.12 to 104.72] |
374.31 [91.23 to 148.18] |
441.00 [394.33 to 510.00] |
|||||
|
Q3 |
90.93 [73.47 to 122.00] |
96.61 [80.00 to 124.34] |
92.84 [71.33 to 118.96] |
104.46 [96.55 to 112.64] |
84.60 [61.06 to 133.05] |
89.97 [65.71 to 152.78] |
429.07 [292.71 to 499.60] |
|||||
|
Q4 |
91.47 [69.55 to 112.94] |
97.95 [69.12 to 125.41] |
100.99 [67.65 to 125.00] |
106.18 [91.95 to 113.64] |
92.74 [43.21 to 129.00] |
92.79 [53.85 to 166.98] |
417.42 [345.00 to 459.15] |
|||||
|
Phe |
Q1 |
91.60 [54.05 to 115.84] |
97.80 [57.66 to 120.73] |
97.57 [51.87 to 146.48] |
107.33 [95.45 to 114.94] |
84.63 [47.28 to 126.01] |
93.25 [62.62 to 225.00] |
424.65 [270.20 to 555.00] |
||||
|
Q2 |
96.62 [70.34 to 108.56] |
95.70 [67.98 to 119.76] |
94.48 [46.24 to 141.76] |
107.69 [92.13 to 113.64] |
91.52 [42.90 to 129.85] |
100.90 [56.52 to 164.86] |
440.85 [392.30 to 510.00] |
|||||
|
Q3 |
93.75 [70.18 to 112.73] |
97.01 [63.75 to 125.41] |
92.68 [62.84 to 137.86] |
107.73 [83.91 to 113.64] |
87.54 [40.87 to 137.35] |
96.52 [41.35 to 172.07] |
417.00 [378.56 to 486.80] |
|||||
|
Q4 |
90.22 [69.55 to 122.00] |
94.67 [68.44 to 126.90] |
95.04 [63.88 to 125.00] |
105.65 [86.52 to 113.64] |
86.72 [36.33 to 133.05] |
95.34 [45.87 to 166.98] |
421.88 [292.71 to 499.60] |
|||||
|
Ant |
Q1 |
89.69 [62.30 to 114.23] |
96.47 [64.55 to 118.41] |
94.66 [62.63 to 146.48] |
107.78 [92.13 to 113.64] |
87.26 [47.28 to 137.35] |
97.44 [60.18 to 172.07] |
421.00 [324.00 to 555.00] |
||||
|
Q2 |
92.17 [54.05 to 118.11] |
96.90 [57.66 to 120.73] |
94.30 [51.87 to 140.10] |
106.25 [83.91 to 114.94] |
88.71 [40.87 to 129.85] |
96.34 [41.35 to 225.00] |
427.29 [287.00 to 510.00] |
|||||
|
Q3 |
90.54 [56.61 to 118.25] |
96.08 [63.75 to 118.39] |
93.53 [61.81 to 137.86] |
107.82 [93.33 to 113.64] |
89.08 [42.90 to 124.54] |
98.21 [58.41 to 154.05] |
424.49 [270.20 to 547.28] |
|||||
|
Q4 |
91.67 [70.18 to 123.10] |
95.83 [72.36 to 126.90] |
95.06 [62.84 to 141.76] |
106.67 [91.95 to 113.79] |
87.90 [43.21 to 133.05] |
95.28 [53.85 to 166.98] |
424.44 [292.71 to 514.30] |
|||||
|
Fla |
Q1 |
92.07 [54.09 to 120.75] |
98.34 [60.70 to 120.73] |
95.38 [59.63 to 146.48] |
107.33 [86.52 to 114.94] |
89.68 [36.33 to 124.54] |
97.34 [45.87 to 225.00] |
424.89 [340.80 to 530.00] |
||||
|
Q2 |
89.19 [54.05 to 118.11] |
95.69 [57.66 to 119.76] |
95.33 [46.24 to 140.10] |
107.78 [91.01 to 113.79] |
89.93 [49.85 to 126.01] |
98.60 [54.95 to 158.77] |
419.25 [270.20 to 555.00] |
|||||
|
Q3 |
91.19 [64.98 to 113.18] |
95.41 [67.61 to 120.33] |
94.35 [61.81 to 138.37] |
105.59 [83.91 to 112.64] |
84.28 [40.87 to 137.35] |
96.24 [41.35 to 172.07] |
424.49 [339.29 to 513.80] |
|||||
|
Q4 |
90.28 [69.55 to 123.10] |
96.43 [69.12 to 126.90] |
92.21 [62.84 to 125.00] |
107.78 [91.95 to 113.64] |
88.24 [43.21 to 133.05] |
93.69 [53.85 to 166.98] |
423.72 [287.00 to 506.54] |
|||||
|
Pyr |
Q1 |
91.01 [56.61 to 120.75] |
96.30 [63.75 to 120.73] |
97.79 [51.87 to 141.76] |
107.87 [90.91 to 114.94] |
89.64 [47.28 to 137.35] |
99.08 [51.89 to 172.07] |
423.60 [324.00 to 555.00] |
||||
|
Q2 |
90.83 [54.05 to 118.11] |
96.00 [57.66 to 115.12] |
92.91 [63.32 to 140.10] |
106.10 [86.52 to 113.64] |
84.35 [36.33 to 126.01] |
93.25 [45.87 to 225.00] |
418.79 [270.20 to 495.00] |
|||||
|
Q3 |
89.17 [66.55 to 123.10] |
94.26 [68.30 to 126.90] |
92.27 [46.24 to 127.63] |
107.87 [83.91 to 113.64] |
89.40 [40.87 to 124.54] |
98.63 [41.35 to 148.18] |
428.19 [339.29 to 513.80] |
|||||
|
Q4 |
91.57 [69.55 to 122.00] |
98.77 [69.12 to 125.41] |
95.89 [62.84 to 125.00] |
107.73 [91.95 to 113.79] |
88.45 [43.21 to 133.05] |
94.46 [53.85 to 166.98] |
420.60 [287.00 to 506.54] |
|||||
|
BaA |
Q1 |
97.95 [70.18 to 110.86] |
106.38 [76.19 to 118.39] |
98.91 [62.84 to 122.92] |
106.82 [97.78 to 113.79] |
95.76 [62.99 to 122.12] |
93.75 [66.07 to 148.18] |
424.48 [344.00 to 510.00] |
||||
|
Q2 |
90.94 [73.47 to 101.47] |
98.17 [78.63 to 107.38] |
97.20 [70.92 to 125.00] |
107.95 [100.00 to 113.64] |
85.37 [70.19 to 127.84] |
95.28 [77.36 to 166.98] |
427.56 [345.00 to 486.80] |
|||||
|
Q3 |
94.91 [69.55 to 112.73] |
100.00 [69.12 to 125.41] |
99.82 [74.80 to 119.51] |
107.78 [96.55 to 112.64] |
93.33 [52.52 to 133.05] |
98.21 [65.71 to 152.78] |
421.88 [292.71 to 498.39] |
|||||
|
Q4 |
90.03 [77.43 to 122.00] |
94.14 [72.36 to 124.34] |
90.17 [63.55 to 109.21] |
102.30 [91.95 to 108.89] |
81.29 [43.21 to 107.54] |
81.42 [53.85 to 127.10] |
437.00 [365.51 to 510.00] |
|||||
|
Chr |
Q1 |
93.22 [54.05 to 118.02] |
100.00 [57.66 to 124.11] |
91.56 [63.88 to 138.37] |
107.95 [94.44 to 113.64] |
96.93 [48.56 to 115.11] |
96.58 [60.18 to 154.05] |
417.00 [345.00 to 510.00] |
||||
|
Q2 |
93.75 [76.03 to 106.27] |
98.83 [78.63 to 116.61] |
90.32 [59.63 to 118.95] |
107.78 [94.38 to 112.64] |
89.63 [57.27 to 124.54] |
96.40 [60.91 to 120.56] |
426.38 [346.22 to 486.80] |
|||||
|
Q3 |
89.29 [56.61 to 112.73] |
95.36 [63.75 to 125.41] |
98.67 [62.84 to 123.92] |
107.78 [96.74 to 113.64] |
81.45 [62.99 to 129.00] |
95.28 [74.17 to 145.79] |
421.20 [357.49 to 506.54] |
|||||
|
Q4 |
88.74 [69.55 to 122.00] |
95.33 [69.12 to 124.34] |
98.35 [67.65 to 125.00] |
104.49 [91.95 to 113.64] |
89.76 [43.21 to 133.05] |
92.04 [53.85 to 166.98] |
424.44 [292.71 to 499.60] |
|||||
Note: Definition of abbreviations: Acy = acenaphthylene; Ace = acenaphthene; Flu = fluorene; Phe = phenanthrene; Ant = anthracene; Fla = fluoranthene; Pyr = pyrene; BaA = benzo (a) anthracene; Chr = chrysene; 6MWD = six-minute walk distance; % pred FVC = the percentage of predicted values for forced vital capacity; % pred FEV1 = the percentage of predicted values for forced expiratory volume in one second; % pred PEF = the percentage of predicted values for peak expiratory flow; % pred FEV1/FVC = the percentage of predicted values for FEV1/FVC ratio; % pred FEF25−75 = the percentage of predicted values for mean forced expiratory flow between 25% and 75% of FVC; and % pred FEF25−75/FVC = the percentage of predicted values for FEF25–75/FVC ratio
* The levels of PAHs in hair were divided into quartiles based on their distribution among all the participants: Q1 = lowest quartile (1 to 25%); Q2 = the second quartile (26 to 50%); Q3 = the third quartile (51-75%); and Q4 = the top quartile (76-100%).
Table S2. Correlations between hair PAH levels and lung function and 6-minute walk distance (6MWD).
|
PAHs |
Q1 |
pFVC (%) |
pFEV1 (%) |
pPEF (%) |
pFEV1/FVC (%) |
pFEF25-75 (%) |
pFEF25-75/FVC (%) |
6MWT |
||||||||||
|
Estimated changes2 [95% CI] (m) |
p value |
Estimated changes [95% CI] (m) |
p value |
Estimated changes [95% CI] (m) |
p value |
Estimated changes [95% CI] (m) |
p value |
Estimated changes [95% CI] (m) |
p value |
Estimated changes [95% CI] (m) |
p value |
Estimated changes [95% CI] (m) |
p value |
|||||
|
Acy |
Q2 |
2.76 [-0.90 to 6.43] |
0.138 |
2.57 [-1.05 to 6.20] |
0.163 |
-3.09 [-7.64 to 1.45] |
0.181 |
-0.54 [-1.91 to 0.82] |
0.434 |
-0.47 [-5.68 to 4.74] |
0.858 |
-4.47 [-11.24 to 2.29] |
0.194 |
2.95 [-10.45 to 16.35] |
0.665 |
|
||
|
Q3 |
1.83 [-1.85 to 5.52] |
0.327 |
0.95 [-2.75 to 4.66] |
0.612 |
-3.73 [-8.44 to 0.96] |
0.119 |
-1.23 [-2.61 to 0.14] |
0.080 |
-1.80 [-7.27 to 3.66] |
0.516 |
-4.90 [-11.84 to 2.04] |
0.165 |
-2.55 [-16.18 to 11.10] |
0.714 |
|
|||
|
Q4 |
2.31 [-1.33 to 5.97] |
0.213 |
0.44 [-3.11 to 3.99] |
0.807 |
-5.17 [-9.78 to -0.56] |
0.028 |
-2.20 [-3.77 to -0.63] |
0.006 |
-6.50 [-11.58 to -1.41] |
0.012 |
-10.14 [-17.12 to -3.17] |
0.005 |
-5.42 [-19.39 to 8.53] |
0.445 |
|
|||
|
Ace |
Q2 |
-0.26 [-4.15 to 3.62] |
0.893 |
-1.38 [-5.07 to 2.31] |
0.461 |
-3.49 [-8.17 to 1.18] |
0.142 |
-1.23 [-2.74 to 0.27] |
0.108 |
-7.01 [-12.08 to -1.94] |
0.007 |
-8.49 [-15.21 to -1.76] |
0.014 |
10.16 [-3.44 to 23.77] |
0.143 |
|
||
|
Q3 |
1.28 [-2.20 to 4.77] |
0.469 |
1.33 [-2.04 to 4.70] |
0.436 |
-2.24 [-6.93 to 2.45] |
0.347 |
-0.33 [-1.70 to 1.02] |
0.626 |
-4.50 [-9.45 to 0.45] |
0.075 |
-7.62 [-14.45 to -0.79] |
0.029 |
6.72 [-6.94 to 20.38] |
0.334 |
|
|||
|
Q4 |
1.61 [-2.05 to 5.27] |
0.387 |
0.41 [-3.18 to 4.01] |
0.820 |
-1.18 [-5.64 to 3.26] |
0.599 |
-1.59 [-3.19 to 0.01] |
0.052 |
-4.90 [-10.38 to 0.58] |
0.080 |
-8.33 [-15.59 to -1.08] |
0.025 |
5.44 [-7.85 to 18.74] |
0.421 |
|
|||
|
Flu |
Q2 |
-3.63 [-7.25 to -0.01] |
0.049 |
-4.29 [-7.88 to -0.70] |
0.019 |
-5.3 [-10.06 to -0.53] |
0.029 |
-0.53 [-1.90 to 0.83] |
0.443 |
-4.04 [-9.30 to 1.21] |
0.131 |
-0.44 [-7.26 to 6.38] |
0.898 |
-4.70 [-18.27 to 8.87] |
0.496 |
|
||
|
Q3 |
0.22 [-3.63 to 4.09] |
0.907 |
-1.02 [-4.83 to 2.78] |
0.596 |
-4.62 [-9.40 to 0.15] |
0.058 |
-1.38 [-2.79 to 0.02] |
0.054 |
-5.58 [-10.96 to -0.21] |
0.042 |
-6.45 [-13.13 to 0.22] |
0.058 |
-16.26 [-29.86 to -2.66] |
0.019 |
|
|||
|
Q4 |
0.11 [-3.71 to 3.93] |
0.955 |
-1.28 [-5.05 to 2.48] |
0.502 |
-4.99 [-9.63 to -0.34] |
0.036 |
-1.50 [-2.99 to -0.01] |
0.047 |
-5.79 [-11.10 to -0.48] |
0.032 |
-6.54 [-13.16 to 0.08] |
0.053 |
-17.83 [-31.51 to -4.15] |
0.011 |
|
|||
|
Phe |
Q2 |
-0.68 [-4.62 to 3.26] |
0.734 |
-1.17 [-5.10 to 2.74] |
0.555 |
-0.56 [-5.53 to 4.40] |
0.822 |
-0.48 [-1.90 to 0.92] |
0.497 |
1.29 [-4.22 to 6.81] |
0.644 |
2.60 [-4.56 to 9.77] |
0.474 |
-5.82 [-19.82 to 8.18] |
0.414 |
|
||
|
Q3 |
1.73 [-2.01 to 5.48] |
0.363 |
0.82 [-2.84 to 4.50] |
0.656 |
-0.63 [-5.46 to 4.19] |
0.796 |
-0.93 [-2.46 to 0.59] |
0.230 |
-0.55 [-5.93 to 4.82] |
0.840 |
-2.29 [-9.16 to 4.57] |
0.511 |
-14.40 [-28.25 to -0.54] |
0.042 |
|
|||
|
Q4 |
-0.55 [-4.43 to 3.32] |
0.778 |
-1.49 [-5.51 to 2.52] |
0.464 |
-0.78 [-5.48 to 3.92] |
0.744 |
-1.17 [-2.61 to 0.27] |
0.113 |
-2.68 [-8.25 to 2.87] |
0.341 |
-2.99 [-9.66 to 3.67] |
0.376 |
-2.76 [-16.54 to 11.01] |
0.693 |
|
|||
|
Ant |
Q2 |
1.54 [-2.59 to 5.68] |
0.462 |
0.69 [-3.46 to 4.85] |
0.742 |
1.75 [-3.62 to 7.12] |
0.521 |
-1.07 [-2.68 to 0.54] |
0.192 |
0.53 [-5.42 to 6.50] |
0.859 |
-0.41 [-8.26 to 7.43] |
0.917 |
1.92 [-12.99 to 16.84] |
0.800 |
|
||
|
Q3 |
1.20 [-2.64 to 5.05] |
0.537 |
1.01 [-2.81 to 4.85] |
0.600 |
1.27 [-3.63 to 6.18] |
0.608 |
-0.38 [-1.91 to 1.13] |
0.618 |
1.05 [-4.40 to 6.50] |
0.704 |
-0.03 [-6.88 to 6.82] |
0.993 |
8.06 [-6.90 to 23.02] |
0.290 |
|
|||
|
Q4 |
2.54 [-1.27 to 6.35] |
0.190 |
1.97 [-1.87 to 5.82] |
0.312 |
1.68 [-3.46 to 6.84] |
0.518 |
-0.99 [-2.50 to 0.51] |
0.195 |
-0.05 [-5.80 to 5.70] |
0.986 |
-3.26 [-10.15 to 3.61] |
0.350 |
-0.04 [-14.98 to 14.88] |
0.995 |
|
|||
|
Fla |
Q2 |
-1.92 [-5.85 to 2.01] |
0.337 |
-1.59 [-5.48 to 2.29] |
0.419 |
-1.91 [-6.75 to 2.91] |
0.435 |
0.60 [-0.88 to 2.10] |
0.423 |
0.33 [-4.99 to 5.66] |
0.902 |
2.21 [-4.65 to 9.08] |
0.525 |
-3.62 [-17.58 to 10.33] |
0.609 |
|
||
|
Q3 |
-0.23 [-3.90 to 3.43] |
0.900 |
-1.52 [-5.14 to 2.09] |
0.406 |
0.71 [-3.99 to 5.41] |
0.766 |
-1.40 [-3.04 to 0.22] |
0.090 |
-2.63 [-8.16 to 2.90] |
0.350 |
-2.92 [-10.13 to 4.27] |
0.424 |
-1.66 [-15.4 to 12.07] |
0.812 |
|
|||
|
Q4 |
-0.45 [-4.26 to 3.35] |
0.815 |
-0.36 [-4.18 to 3.45] |
0.851 |
-1.04 [-5.76 to 3.67] |
0.662 |
0.00 [-1.46 to 1.44] |
0.991 |
-1.19 [-6.57 to 4.18] |
0.662 |
-1.76 [-8.37 to 4.84] |
0.599 |
-6.92 [-20.68 to 6.84] |
0.323 |
|
|||
|
Pyr |
Q2 |
-0.10 [-4.00 to 3.79] |
0.958 |
-1.26 [-5.01 to 2.48] |
0.507 |
-3.04 [-7.80 to 1.71] |
0.208 |
-1.34 [-2.91 to 0.23] |
0.095 |
-5.81 [-11.34 to -0.28] |
0.039 |
-6.30 [-13.71 to 1.09] |
0.095 |
-7.14 [-20.69 to 6.4] |
0.301 |
|
||
|
Q3 |
0.15 [-3.61 to 3.92] |
0.937 |
-0.47 [-4.16 to 3.21] |
0.799 |
-3.88 [-8.78 to 1.00] |
0.119 |
-0.82 [-2.42 to 0.76] |
0.305 |
-3.21 [-8.68 to 2.24] |
0.247 |
-4.38 [-11.09 to 2.33] |
0.200 |
-3.52 [-16.88 to 9.83] |
0.604 |
|
|||
|
Q4 |
1.43 [-2.34 to 5.21] |
0.453 |
1.46 [-2.26 to 5.20] |
0.439 |
-1.82 [-6.53 to 2.89] |
0.446 |
-0.48 [-1.93 to 0.96] |
0.512 |
-2.48 [-8.06 to 3.09] |
0.380 |
-5.27 [-12.09 to 1.54] |
0.129 |
-14.76 [-28.3 to -1.22] |
0.033 |
|
|||
|
BaA |
Q2 |
-6.24 [-13.86 to 1.38] |
0.105 |
-5.79 [-13.19 to 1.59] |
0.120 |
-0.74 [-11.36 to 9.87] |
0.887 |
0.37 [-2.54 to 3.29] |
0.794 |
-5.71 [-17.23 to 5.81] |
0.320 |
0.85 [-13.67 to 15.38] |
0.905 |
-2.37 [-33.35 to 28.61] |
0.878 |
|
||
|
Q3 |
-2.75 [-11.52 to 6.00] |
0.526 |
-3.63 [-12.71 to 5.43] |
0.420 |
3.65 [-7.14 to 14.45] |
0.496 |
-0.92 [-4.42 to 2.57] |
0.594 |
-3.43 [-17.58 to 10.72] |
0.624 |
-1.39 [-15.74 to 12.95] |
0.844 |
-17.34 [-49.49 to 14.8] |
0.284 |
|
|||
|
Q4 |
-2.23 [-11.31 to 6.83] |
0.619 |
-5.34 [-14.98 to 4.30] |
0.267 |
-6.59 [-17.12 to 3.93] |
0.211 |
-3.79 [-7.06 to -0.52] |
0.024 |
-14.78 [-27.36 to -2.19] |
0.023 |
-14.06 [-27.04 to -1.09] |
0.035 |
5.64 [-27.28 to 38.56] |
0.732 |
|
|||
|
Chr |
Q2 |
1.03 [-5.51 to 7.58] |
0.751 |
1.19 [-5.85 to 8.24] |
0.734 |
-2.64 [-11.05 to 5.75] |
0.529 |
-0.27 [-2.80 to 2.24] |
0.825 |
-0.90 [-10.68 to 8.87] |
0.853 |
-3.11 [-14.34 to 8.11] |
0.579 |
12.57 [-11.00 to 36.16] |
0.292 |
|
||
|
Q3 |
-1.73 [-8.86 to 5.40] |
0.629 |
-1.34 [-8.73 to 6.03] |
0.716 |
1.74 [-7.71 to 11.21] |
0.712 |
0.39 [-2.14 to 2.93] |
0.754 |
-3.31 [-13.17 to 6.55] |
0.503 |
-1.85 [-13.31 to 9.60] |
0.747 |
12.10 [-11.37 to 35.57] |
0.308 |
|
|||
|
Q4 |
0.44 [-6.66 to 7.55] |
0.901 |
-1.39 [-8.96 to 6.16] |
0.713 |
0.41 [-8.40 to 9.23] |
0.925 |
-2.29 [-4.86 to 0.27] |
0.079 |
-1.94 [-12.87 to 8.97] |
0.723 |
-3.22 [-15.63 to 9.19] |
0.606 |
3.35 [-20.95 to 27.65] |
0.785 |
|
|||
|
Total PAHs |
Q2 |
-0.35 [-4.21 to 3.49] |
0.854 |
-2.41 [-6.17 to 1.34] |
0.207 |
-5.88 [-10.56 to -1.19] |
0.014 |
-2.02 [-3.43 to -0.60] |
0.005 |
-5.37 [-10.74 to 0.00] |
0.050 |
-5.17 [-12.13 to 1.77] |
0.144 |
-12.04 [-25.27 to 1.18] |
0.074 |
|
||
|
Q3 |
-0.40 [-4.10 to 3.28] |
0.828 |
-1.63 [-5.43 to 2.15] |
0.395 |
-4.15 [-8.98 to 0.67] |
0.091 |
-1.27 [-2.65 to 0.10] |
0.070 |
-4.31 [-9.67 to 1.05] |
0.114 |
-4.64 [-11.39 to 2.10] |
0.176 |
-3.47 [-16.81 to 9.86] |
0.609 |
|
|||
|
Q4 |
2.00 [-1.94 to 5.95] |
0.318 |
0.49 [-3.47 to 4.45] |
0.807 |
-2.99 [-7.72 to 1.74] |
0.214 |
-1.90 [-3.19 to -0.60] |
0.004 |
-5.03 [-10.31 to 0.23] |
0.061 |
-8.13 [-14.53 to -1.73] |
0.013 |
-13.31 [-26.64 to 0.02] |
0.500 |
|
|||
Definition of abbreviations: Acy = acenaphthylene; Ace = acenaphthene; Flu = fluorene; Phe = phenanthrene; Ant = anthracene; Fla = fluoranthene; Pyr = pyrene; BaA = benzo (a) anthracene; Chr = chrysene; 6MWD = six-minute walk distance; % pred FVC = the percentage of predicted values for forced vital capacity; % pred FEV1 = the percentage of predicted values for forced expiratory volume in one second; % pred PEF = the percentage of predicted values for peak expiratory flow; % pred FEV1/FVC = the percentage of predicted values for FEV1/FVC ratio; % pred FEF25−75 = the percentage of predicted values for mean forced expiratory flow between 25% and 75% of FVC; % pred FEF25−75/FVC = the percentage of predicted values for FEF25–75/FVC ratio; and 95% CI = 95% confidence interval
1 The levels of PAHs in hair were divided into quartiles based on their distribution among all the participants: Q1 = lowest quartile (1 to 25%); Q2 = the second quartile (26 to 50%); Q3 = the third quartile (51-75%); and Q4 = the top quartile (76-100%).
2 Estimated changes in lung function and 6MWD with each quartile (Q2, Q3, and Q4) of PAHs compared to the reference level (Q1). The results were obtained from linear mixed models with subjects as a random effect.
Kessaya Radarit1, 2, Pitakchon Ponsawansong1, Kawinwut Somsunun1, Nathaporn Thongjan1, Teetawat Santijitpakdee1, and Tippawan Prapamontol1, *
1 Environment and Health Research Group, Research Institute for Health Sciences, Chiang Mai University, Chiang Mai 50200, Thailand.
2 Ph.D. Degree Program in Environmental Science, Environmental Science Research Center, Faculty of Science, Chiang Mai University, Chiang Mai 50200, Thailand.
Corresponding author: Tippawan Prapamontol, E-mail: tippawan.prapamontol@cmu.ac.th
ORCID: Tippawan Prapamontol: https://orcid.org/0000-0001-7132-3235
Total Article Views
Editor: Nisit Kittipongpatana,
Chiang Mai University, Thailand
Article history:
Received: May 24, 2024;
Revised: August 28, 2024;
Accepted: September 5, 2024;
Online First: September 11, 2024
https://doi.org/10.12982/NLSC.2024.058