 ISSN: 2822-0838 Online

Indicator Films Containing Dendrobium Orchid Flower Extract and TiO2 Nanoparticles for Monitoring Fish Fillet Spoilage
Ratchadaporn Jaimun, Nattapong Kanha, and Jurmkwan Sangsuwan*Published Date : June 17, 2024
DOI : https://doi.org/10.12982/NLSC.2024.036
Journal Issues : Number 3, July-September 2024
Abstract This work aimed to study a novel pH indicator film prepared from carboxymethyl cellulose (CMC)/tapioca starch (TS) incorporating Dendrobium orchid flowers and TiO2 nanoparticles for monitoring fish fillet freshness. The films were prepared based on carboxymethyl cellulose (CMC) and tapioca starch (TS) blend (CMC/TS) incorporated with TiO2 nanoparticles and Dendrobium orchid flower (DOF) extract. The result showed that the DOF extract contained peonidin-3,5-O-diglucoside and exhibited distinguishable color changes in different pH buffers. Likewise, the CMC/TS+TiO2+DOF film’s color changed corresponding to the extract. The X-ray diffraction analysis revealed the expansion of the film’s amorphous region, due to the intermolecular interactions. Analyzing scanning electron microscope images showed the effects of TiO2 and DOF extract on the surface morphology of films. The incorporation of TiO2 and DOF extract into the film formulation improved various film properties, such as redness, opacity, tensile strength, and water solubility. For the sensitivity testing, the color of the CMC/TS+TiO2+DOF film responded to ammonia vapor more than acetic acid vapor, suitable for monitoring seafood spoilage behavior. In addition, the application of film for monitoring the freshness of fish fillets was conducted. The CMC/TS+TiO2+DOF film color changed from purple to bluish-purple corresponding to the spoilage of samples. Indicating its potential as an indicator for monitoring fish fillets' freshness.
Keywords: Dendrobium orchid flower, Anthocyanins, TiO2 nanoparticles, Indicator film, Fish spoilage
Funding: This work (Grant No. RGNS 63-106) was supported by Office of the Permanent Secretary, Ministry of Higher Education, Science, Research and Innovation (OPS MHESI), Thailand Science Research and Innovation (TSRI) and Rajamangala University of Technology Lanna.
Citation: Jaimun, R., Kanha, N., and Sangsuwan, J. 2024. Indicator films containing Dendrobium orchid flower extract and tio2 nanoparticles for monitoring fish fillet spoilage. Natural and Life Sciences Communications. 23(3): e2024036.
INTRODUCTION
The safety and quality of food are important issues in public health. The consumption of unsafe food can lead to diseases such as diarrhea, cancer, etc (World Health Organization, 2018) which is primarily caused by the growth of contaminated microorganisms (Kanha et al., 2022). One of the foods widely consumed around the world and easily found microbial spoilage during distribution is raw fish fillet. Not only a commercial food product, but it is also an important source of human nutrition. Some kinds of raw fish fillets, e.g., tuna, can be consumed freshly and often found in some recipes like sushi. Moreover, raw fish fillet is still mainly used as a raw material for processing to be other food products. However, the picking of this product for consumption needs experience and consideration by the eyes, which cannot determine the real-time result of the enzymatic reaction and the generation of metabolites, e.g., total volatile-based nitrogen (TVB-N), by microbial growth (Lee et al., 2019; Grzyb et al., 2021). Advanced instruments and highly skilled operators are needed to determine metabolites which some kinds may be harmful, however, chemical detection cannot be done easily at a place of sale. Therefore, the cost-effective strategy for rapid evaluation of real-time fish spoilage is still challenging.
Intelligent food packaging is getting great attention from both industry and academia for monitoring the real-time quality of packed food (Kanha et al., 2022). Recent theoretical developments have proved that anthocyanins can be natural pH indicators within pH indicator films as intelligent food packaging (Kanha et al., 2022). These pigments can react with the volatile compounds generated during food spoilage and such reaction causes a wide range of color development and reversibility (Zhang et al., 2019). Uniquely, the color development of pH indicator films after sensing is dependent on the source of anthocyanins. Much research thus attempts to explore and develop pH indicator films from new anthocyanin sources (Ma and Wang, 2016; Qin et al., 2019; Zhang et al., 2020). Interestingly, the extract of the Dendrobium orchid flower (DOF) is a rich source of anthocyanins providing various shades of color according to pH value, and its application in this research field is not found.
Additionally, the use of nanoparticles to improve the mechanical and barrier properties of biodegradable biopolymer-based films is becoming a good alternative way. Nanoparticles are defined as particles with the size in the range of few nanometers to 1000 nm (Medina et al., 2007; Aschner, 2009; Prabha et al., 2016). Among various nanoparticles, titanium dioxide (TiO2) nanoparticles have several good points, such as stable, biocompatible, dispersible, hydrophilic, photocatalytic, and UV-blocking properties (Daghrir et al., 2013; Zhang et al., 2019). In addition, TiO2 nanoparticles also have excellent antimicrobial activities (Azizi-Lalabadi et al., 2019). Recently, Zhang et al. (2019) developed multifunctional food packaging films containing TiO2 nanoparticles and found that the addition of TiO2 nanoparticles could successfully improve the opacity and other physical properties of the films.
Until now, the application of DOF extract as a natural pH indicator in the blended film has still not been studied. Therefore, we aimed to develop the pH indicator film using carboxymethyl cellulose and tapioca starch blend (CMC/TS) to form a film matrix since CMC/TS films were successfully prepared and showed great physical properties (Tongdeesoontorn et al., 2011). The DOF extract and TiO2 nanoparticles were incorporated into the film to function as a natural pH indicator and to improve film properties, respectively. The effect of DOF extract and TiO2 in the blended film on mechanical, physical, and microscopic properties was investigated. In addition, color development during the storage of fish fillets was also monitored for the evaluation of potential applications.
MATERIALS AND METHODS
Raw materials and chemicals
The Dendrobium orchid flowers (DOF), a variety of Sonia Bom 17 – Figure 1 (A), were purchased from a local flower farm in Chiang Mai, Thailand. They were washed and cut into small pieces and dried at 60°C for 8 h using a hot air oven (UN110, Memmert GmbH + Co. KG, Bavaria, Germany). Dried flowers were crushed as fine powders using a blender, packed in an aluminum bag, and kept at -20°C until use.
Carboxymethyl cellulose (CMC; Changshu Wealthy Science & Technology Co. Ltd., Jiangsu, China) and tapioca starch (TS; WGC Co. Ltd., Nakorn Pathom, Thailand) were used as film-forming agents. Polyethylene glycol 400 (PEG400; Merck KGaA, Darmstadt, Germany) functioned as a plasticizer. Titanium dioxide (TiO2) nanoparticles with a particle size of 300 nm (Brenntag Specialties, Inc., South Plainfield, NJ, USA) were used as an additive. Peptone and plate count agar (PCA) were purchased from HiMedia Laboratories Pvt. Ltd., Mumbai, India. Analytical grade ethanol (95%) was bought from RCI Labscan Limited, Bangkok, Thailand.
Preparation of DOF extract
The dried DOF powders (1 g) were mixed with 37% (w/v) ethanol solution (20 mL) and the extraction was done using a water bath shaker (WNE 45, Memmert GmbH + Co. KG, Bavaria, Germany) for 90 min. Then, the DOF ethanolic extracts were filtered through Whatman filter paper No. 1 (GE Healthcare Life Sciences, Chicago, IL, USA) equipped with a suction flask and vacuum pump. After that, the ethanol in the filtered extract was removed by a rotary evaporator (BÜCHI Labortechnik AG, Flawil, Switzerland). Finally, all the DOF extracts were pooled into the brown glass bottle and kept at 4°C for a maximum of 2 days to remove the sediment and then filtered again as in the above step. This extract (Figure 1 (B)) functioned as the pH indicator in this study.
Characterization of phenolic compounds in DOF extract
The total phenolic content (TPC) was analyzed according to the method described by Kanha et al. (2021). Sample (50 μL), distilled water (3,000 μL), 250 μL of Folin–Ciocalteu’s reagent, and 7% NaCO3 (750 μL) were added into a test tube, mixed, and incubated for 10 min at room temperature. After that, distilled water (950 μL) was immediately added and vigorously mixed. The mixture was left for the reaction in a dark room for 2 h at 30°C in a water bath (WNE 45, Memmert GmbH + Co. KG, Bavaria, Germany) before the absorbance at 765 nm was measured against a blank using a UV-visible spectrophotometer (Genesys 10, Thermo Scientific, NY, USA). Finally, the TPC was reported as mg gallic acid equivalent (GAE)/100 g dry weight (DW) by calibrating with a linear plot of standard gallic acid with a linearity range of 50 to 1,000 μg/mL (R2 = 0.9998).
The total anthocyanin content (TAC) was determined according to the pH differential method, described by Kanha et al. (2021), using a UV-visible spectrophotometer (Thermo Scientific). Samples were diluted with the buffer solution of potassium chloride (pH 1.0) and sodium acetate (pH 4.5). Values for absorbance at 510 nm (A510) and 700 nm (A700) were read, to use for calculating the absorbance difference (Adiff; Eq. 2). The TAC (mg cyanidin-3-glucoside (C3G)/L) was calculated by Eq. 3.
Adiff = (A510 – A700)pH 1.0 – (A510 – A700)pH 4.5 (2)
TAC (mg C3G/L) = (Adiff × MW × DF × 1,000) / (ε × l) (3)
Where MW is the molecular weight of C3G (449.39 g/mol), DF is the dilution factor, while the molar absorptivity (ε) is 26,900 l/mol⋅cm and the path length (l) is 1.0 cm.
Characterization of phenolic compounds in the DOF extract was performed using an Agilent 1290 Infinity LC instrument (Agilent Technologies, Palo Alto, CA, USA). The sample solution was filtered through a Nylon filter before analysis. Agilent Poroshell 120 EC-C18 column (4.6 x 150 mm, 2.7 μm) was eluted at 0.2 mL/min and 35°C by phases A (0.1%, v/v, formic acid aqueous solution) and B (0.1%, v/v, formic acid in acetonitrile solution) as followings: 0 – 5% B (0 – 1 min), 5 – 17% B (1 – 10 min), 17% B (10 – 13 min), 17 – 100% B (13 – 20 min), 100% B (20 – 25 min), 100 – 5% B (25 – 27 min), and 5% B (27 – 33 min). The injection volume and column temperature were 1 µL and 35°C, respectively. Phenolic compounds in the DOF extract were identified by mass spectrometry (MS) on an Agilent 6540 series QTOF-MS equipped with an electrospray ionization source. Computational analysis was conducted by Agilent mass Hunter workstation software (Qualitative Analysis, version B.08.00, Agilent) and Personal Compound Database and Library (PCDL).
Preparation of pH indicator film
TS (6 g) was mixed with CMC (3 g), before adding it to 95% ethanol solution (150 g). Then, 8% (w/w) TiO2 nanoparticles on a total hydrocolloid basis were added to such ethanol solution. With the aid of a magnetic stirrer (IKA C-MAG HS 7, Werke GmbH & Co. KG, Baden-Württemberg, Germany), all hydrocolloids were melted at 90°C for 30 min along with a dispersion of TiO2 nanoparticles. After 15 min of stirring time, 50% (w/w) PEG 400 on a total hydrocolloid basis was immediately added and continuously stirred until the mixture was homogenized completely. After that, the DOF extract (150 g) was incorporated into the above mixture and continuously stirred without heating for 15 min. When the mixture was homogeneous, film casting was done on a smooth surface plate (14 cm diameter). Each plate was dried in a hot air oven at 40°C for 24 h. Finally, the prepared indicator films were stored at 25°C in a desiccator with 50% relative humidity (RH) until equilibrium.
Color response analysis
The DOF extract (1 mL) was mixed with various buffer solutions (1 mL) between pH 1 to 13 and then the mixture was allowed to equilibrate for 10 min. While the pH indicator films were immersed in 10 mL of various buffer solutions between pH 1 and 13 for 10 min. Their color response in various pH buffers was confirmed through a photo taken using a digital camera.
Characterization of CMC/TS, CMC/TS+TiO2, CMC/TS+DOF, and CMC/TS+TiO2+DOF films
Color and opacity of films
The film (5 cm × 5 cm) was measured using a colorimeter (Konica Minolta, CR-400, Tokyo, Japan), and the white standard plate (L* = 98.09, a* = 0.40, and b* = 1.02) was used as a background. The total color difference (ΔE) was calculated as Eq. (1):
ΔE = [(ΔL*)2 + (Δa*)2 + (Δb*)2]0.5 (1)
where ΔL*, Δa*, and Δb* were differences between the color parameters of the white standard plate and the DOF indicator film. The whiteness index (WI) of the film was calculated as Eq. (2), (Agarwal et al., 2020).
WI = 100 – [(100 – L*) + (a*)2 + (b*)2]0.5 (2)
The opacity of the film was tested according to the method of Zhang et al. (2019), with some modifications. The absorbance of the film piece (5 cm × 5 cm) at 600 nm was measured using a UV-visible spectrophotometer (Genesys 10S, Thermo Fisher Scientific Inc., NY, USA). Film opacity was calculated by the following Eq. (3):
Opacity (mm-1) = A600/X (3)
where A600 was the absorbance of film at 600 nm and X was film thickness (mm).
Thickness and mechanical properties of films
Film thickness was randomly measured at ten locations by Mitutoyo No. 293–766 digital micrometer (Tester Sangyo Co. Ltd., Japan). The tensile strength (TS) and elongation at break (EB) of film sample (60 mm × 10 mm) was measured using a TMS-Pro texture analyzer (Food Technology Co., Sterling, VA, USA) setting 4 cm of initial grip distance and 6 cm/min of crosshead speed. The TS and EB of the film sample were calculated by the following equations (Eqs. (4) and (5)):
TS (MPa) = F/(Χ × W) (4)
EB (%) = ∆L/L0) × 100 (5)
where, F was the stress of film at break (N), X was the film thickness, and W was the film width (mm); ΔL and L0 were the elongated and original lengths (mm) of the film sample, respectively.
Moisture-related properties of films
Moisture content, water-holding capacity, and water solubility
The moisture content of indicator films was gravimetrically measured from the weight change when the films (2.5 cm × 2.5 cm) were dried at 105°C for 24 h. The moisture content of the film was calculated as Eq. (6) (Roy and Rhim, 2021):
Moisture content (%) = [(W1 − W2)/(W1)] × 100 (6)
where W1 and W2 were the weight of the film before and after drying, respectively.
For the determination of water-holding capacity, a pre-weighed film sample (2.5 cm × 2.5 cm) was immersed in 20 mL distilled water for 1 h, then taken from the water, and the surface water was removed using blotting paper and then re-weighed. The water-holding capacity value of films was calculated as Eq. (7) (Roy et al., 2020):
Water-holding capacity (%) = [(W2 − W1)/(W1)] × 100 (7)
where W1 and W2 were the initial and final weights of the film samples, respectively.
For the water solubility measurement, the film samples (2.5 cm × 2.5 cm) were dried at 60°C overnight and weighed (W1), and then the dried films were immersed in 30 mL of distilled water for 24 h at 25°C with gentle agitation. Then film samples were taken out and dried in an air oven at 105°C for 24 h and re-weighed (W2). The water solubility value of the film sample was calculated as Eq. (8) (Roy and Rhim, 2021).
Water solubility (%) = [(W1 − W2)/(W1)] × 100 (8)
Water vapor permeability of films
The water vapor permeability (WVP) of the film was determined gravimetrically according to the standard method of ASTM E96-95. The film (7.5 cm × 7.5 cm) was mounted on the rim of the WVP cup (2.5 cm depth and 6.8 cm diameter) containing 18 mL of distilled water and tightly sealed by the lid. The assembled cups were placed in a humidity chamber (model FX 1077, Jeio Tech Co., Ltd. Ansan, Korea) controlled at 25°C and 50% RH, and the weight change of the cup was measured at a 1 h interval for an 6 h period. The WVP (g·m/m2·Pa·s) of the film was calculated as the following Eq. (9):
WVP = (∆W × L)/(t × A × ΔP) (9)
where W was the increased weight of test vessel (g), L was film thickness (m), t was the time (s) for weight increase, A was film permeation area (m2), and ΔP was 2339 Pa at 20°C.
Structural properties of films
X-ray diffraction (XRD) analysis of films
The XRD patterns of film samples were measured using an X-ray diffractometer (SmartLab, Rigaku Co., Tokyo, Japan) and recorded using Cu-Kα radiation at a wavelength of 1.549°A. The diffraction angle range was between 2Ө of 10 and 60°, with a scanning speed of 10°/min.
Surface morphology by scanning electron microscope (SEM) of films
The surface of the films was morphologically evaluated using an SEM (JSM-5200, JEOL, Japan). The films (0.5 mm × 0.5 mm) were mounted on SEM stubs using double-sided adhesive carbon tape (Ted Pella Inc., Redding, CA, USA) prior to being coated with a thin gold layer using the gold sputter coater (SPI Supplies, Structure Probe Inc., West Chester, PA, USA). The SEM was operated at 15 kV with a 500× magnification.
Sensitivity of indicator film against volatile ammonia vapor and acetic acid vapor
Responses of indicator films to volatile ammonia vapor and acetic acid vapor were tested according to the method of Kuswandia et al. (2012), with some modifications. A real polyethylene terephthalate packaging containing either 100 mL ammonia solution (8 mM) or 100 mL acetic acid solution (8 mM), and the films (20 × 20 mm) were held on the lid of the packaging using transparent tape at 1 cm above the solution for 30 min at 25°C. The films were measured by the colorimeter to indicate the ΔE) value (Eq. (1)) for every 5 min.
Application of films for monitoring fish fillet freshness
pH of fish fillet during storage
The pH of fish fillet was done according to the method of Choi et al. (2017), with some modifications. Firstly, 10 grams of fresh fish fillet samples were prepared and packed in a polyethylene terephthalate package. Fish fillet samples were stored at a refrigerated temperature (5°C) and analyzed periodically (up to 9 Days) to detect pH changes. Each fish fillet sample was then blended with 90 mL of distilled water for 3 min using a stomacher to homogenize samples. All pH values were recorded by a digital pH meter (CyberScan pH 510, Eutech Instruments Pte. Ltd., Singapore), by immersing the glass electrode in homogenized samples. All tests were performed in triplicate.
Total volatile-based nitrogen (TVB-N)
TVB-N was analyzed using the Conway micro-diffusion technique (Sutthasupa et al., 2021), with some modifications. A fish fillet sample (5 g) was added to 4% (w/v) trichloroacetic acid and then homogenized to obtain a well-ground homogenate. The homogenate was filtered through Whatman filter paper No. 1 to obtain the filtrate for analysis. The filtrate (1 mL) was placed in the outer ring of the Conway apparatus. The inner ring solution (1 mL of a 1% boric acid solution) containing the indicator (0.01 g bromocresol green and 0.02 g methyl red in 10 mL ethyl alcohol) was subsequently pipetted into the inner ring. The reaction was initiated by mixing K2CO3 (1 mL) with the filtrate. The Conway unit was incubated at 37°C for 60 min before titration with 0.02 M HCl until the green color turned pink. The concentration of TVB-N was indicated as mg of N/100 g sample. TVB-N of all samples were evaluated in triplicate.
Microbiological analysis
Total viable counts were determined according to the method of Li et al. (2013), with some modifications. Samples (25 g) were mixed with sterilized 0.1% peptone water (225 mL) and the mixture was homogenized with a stomacher for 120 s. Serial decimal dilutions of the homogeneous sample were made up in duplicate. From each replication, the dilutions (1 mL) were transferred in triplicate to Petri dishes containing 15 mL commercial plate count agar (60°C). Total viable counts were determined by counting the number of colony-forming units after incubation at 37°C for 48 h and represented as log10 CFU/g of the fillet.
Statistical analysis
All the analyses were done in triplicate. All data were subjected to analysis of variance (ANOVA) and significant differences between averages were evaluated by Duncan's multiple range test using the Statistical Package for the Social Sciences (Version 24, SPSS Inc., Chicago, IL, USA) at a significant level of P ≤ 0.05.
RESULTS
Characterization of phenolic compounds in DOF extract
The TPC and TAC values of the DOF extract were spectrophotometrically determined and found that their values were 1,708.17 ± 13.48 mg GAE/100 g DW and 1,586.71 ± 81.70 mg C3G/100 g DW, respectively. According to Table 1, peonidin-3,5-O-diglucoside is the only kind of anthocyanin detected in the DOF extract, and the others are phenolic compounds. Three phenolic acids found include p-hydroxylbenzoic acid, p-hydroxycinnamic acid, and phloretic acid. Flavones include apigenin 6-C-α-L-arabinosyl-8-C-β-D-xyloside, neoschaftoside, and isoviolanthin. For flavonols, this extract contained various flavonols including keampferol-3-rutinoside-7-glucoside, keampferol-3-O-α-L-rutinoside, quercetin-3-O-rutinoside, and quercetin-3-rutinoside-7-glucoside. Other phenolic compounds found are chrysotobibenzyl, dihydroxyconiferyl dihydro-p-coumarate, dendrocandin A, (E)-coniferyl aldehyde, hydroxycinnamic acid glycoside, and tristin.
Table 1. Phenolic compounds in the Dendrobium orchid flower (DOF) extract.
|
No. |
RT (min) |
m/z |
Identification |
|
1 |
1.709 |
333.170 |
Chrysotobibenzyl |
|
2 |
1.937 |
139.040 |
p-Hydroxylbenzoic acid |
|
3 |
1.991 |
534.140 |
Apigenin 6-C-α-L-arabinosyl-8-C-β-D-xyloside |
|
4 |
2.630 |
165.050 |
p-Hydroxycinnamic acid |
|
5 |
4.489 |
434.100 |
1-O-caffeoyl-β-D-glucoside |
|
6 |
9.200 |
773.210 |
Quercetin-3-rutinoside-7-glucoside |
|
7 |
10.07 |
575.220 |
Keampferol-3-rutinoside-7-glucoside |
|
8 |
11.34 |
595.170 |
Keampferol-3-O-α-L-rutinoside |
|
9 |
12.69 |
564.150 |
Neoschaftoside |
|
10 |
15.296 |
611.160 |
Quercetin-3-O-rutinoside (Rutin) |
|
11 |
15.901 |
579.170 |
Isoviolanthin |
|
12 |
16.035 |
331.150 |
Dihydroxyconiferyl dihydro-p-coumarate |
|
13 |
16.506 |
626.180 |
Peonidin-3,5-O-diglucoside |
|
14 |
18.270 |
167.070 |
Phloretic acid |
|
15 |
18.803 |
305.140 |
Dendrocandin A |
|
16 |
18.910 |
261.110 |
Tristin |
|
17 |
30.696 |
179.070 |
(E)-Coniferyl aldehyde |
Color responses of DOF extract and indicator film to various pH buffers
The color responses of DOF extract and indicator film (CMC/TS+TiO2+DOF film) in different buffers (pH 1–13) are shown in Figures 1 (C) and (D). The DOF extract provided a different color at different pH values: bright red at pH 1–2, pink at 3–4, purple at pH 5–7, violet at pH 8–9, blue at pH 10–11, bright green at pH 12, and bright yellow at pH 13. While the color change of the DOF indicator film was similar to that of the DOF extracts, which gradually changed by buffer pH values: red (pH 1–2), pink (pH 3–4), purple (pH 5–6), violet (pH 7–9), blue (pH 10–11), green (pH 12), and yellow (pH 13).
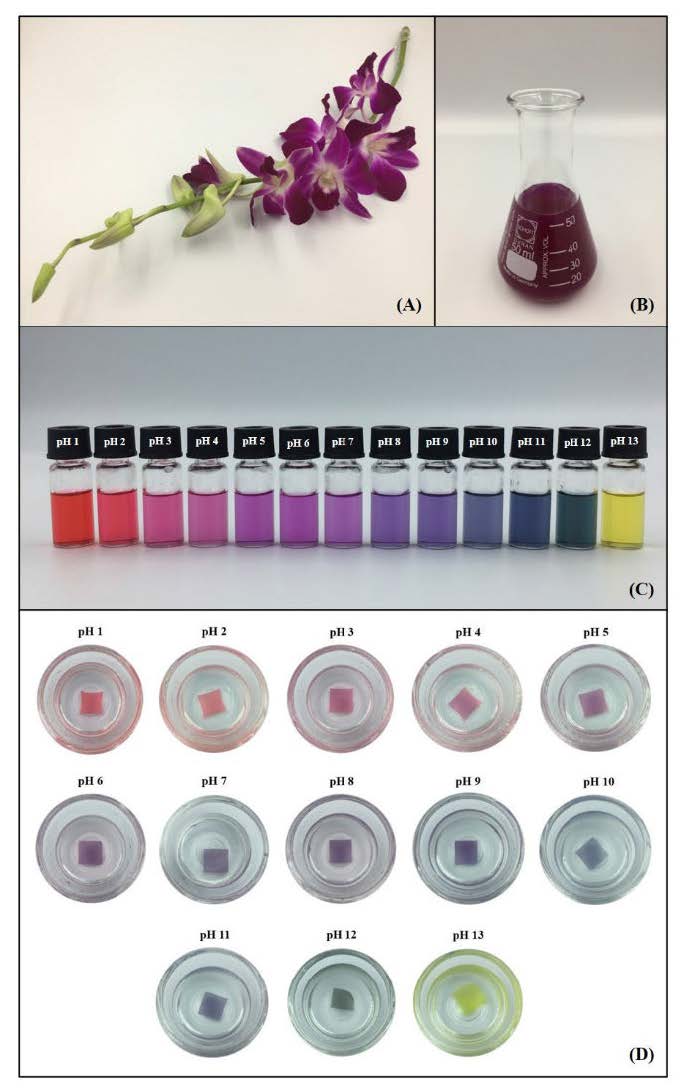
Figure 1. The characteristics of the Dendrobium orchid flower (DOF) (A), DOF extract (B), the color development of the DOF extract (C), and indicator film in different pH conditions (D).
Characterization of CMC/TS, CMC/TS+TiO2, CMC/TS+DOF, and CMC/TS+TiO2+DOF films
Color and opacity of films
As given in Table 2, color parameters including L* (lightness), a* (redness/greenness), b* (yellowness/blueness), ∆E* (difference between the color of the white plate and samples), and WI (whiteness index) were used to distinguish differences in film color. Among the four films, the CMC/TS+TiO2 film had the highest values of WI and L* (P < 0.05), indicating the brightest. The existence of DOF extract in the film caused a decrease in the WI and L* values (P < 0.05), and an increase in a* and b* values. CMC/TS+DOF film showed more redness compared to CMC/TS and CMC/TS+TiO2 films. Likewise, the addition of TiO2 nanoparticles remarkably multiplied the redness and yellowness of the CMC/TS+TiO2+DOF film as well, also making this film have the highest ∆E value.
Opacity is a commonly measured characteristic reflecting film transparency (Zhao et al., 2022). Table 2 shows that the highest opacity among the DOF indicator films was CMC/TS+TiO2+DOF film, followed by CMC/TS+TiO2, CMC/TS+DOF, and CMC/TS films, respectively (P < 0.05).
Table 2. Color and opacity of CMC/TS, CMC/TS+TiO2, CMC/TS+DOF, and CMC/TS+TiO2+DOF films.
|
Film |
L* |
a* |
b* |
WI |
ΔE |
Opacity |
|
|
|
|
|
|
|
(mm-1) |
|
CMC/TS |
90.75 b ± 0.17 |
-0.46 c ± 0.03 |
2.05 d ± 0.16 |
90.40 b ± 0.20 |
2.96 c ± 0.09 |
8.51 d ± 0.22 |
|
CMC/TS+TiO2 |
91.51 a ± 0.06 |
-0.71 d ± 0.03 |
4.09 c ± 0.30 |
90.98 a ± 0.11 |
1.59 d ± 0.09 |
11.62 b ± 0.45 |
|
CMC/TS+DOF |
89.01 b ± 0.21 |
0.92 b ± 0.14 |
5.60 b ± 0.36 |
87.63 c ± 0.33 |
3.52 b ± 0.29 |
9.23 c ± 0.44 |
|
CMC/TS+TiO2+DOF |
83.93 c ± 0.34 |
2.99 a ± 0.17 |
6.04 a ± 0.24 |
82.57 d ± 0.41 |
8.93 a ± 0.40 |
12.77 a ± 1.39 |
Abbreviation: WI stands for whiteness index. Values are shown as the average ± standard deviation (n = 3). Different superscript letters in each column indicate significant difference at P ≤ 0.05.
Film thickness and mechanical properties
As summarized in Table 3, the thickness of DOF indicator films was in the range of 63.87 to 66.63 µm which was not significantly different among the films (P > 0.05). The mechanical properties of films including tensile strength (TS) and elongation at break (EB) are shown in Table 3. TS and EB varied in ranges of 9.78 to 23.69 MPa and 6.94 to 27.07%, respectively. The addition of TiO2 nanoparticles and/or DOF extracts could significantly increase the TS of films, which confirmed the result of Zhang et al. (2019) who found that the incorporation of TiO2 nanoparticles and/or black plum peel extract into chitosan film could enhance its TS. In contrast, the incorporation of TiO2 nanoparticles and/or DOF extracts into the films led to obtaining a significantly lower EB, compared to CMC/TS film (P < 0.05).
Table 3. Thickness, tensile strength, and elongation at break of CMC/TS, CMC/TS+TiO2, CMC/TS+DOF, and CMC/TS+TiO2+DOF films.
|
Film |
Thickness |
Tensile strength |
Elongation at break |
|
|
(µm)NS |
(MPa) |
(%) |
|
CMC/TS |
66.33 ± 1.63 |
9.78 d ± 0.44 |
27.07 a ± 4.30 |
|
CMC/TS+TiO2 |
64.70 ± 0.66 |
11.58 c ± 0.29 |
12.96 b ± 1.71 |
|
CMC/TS+DOF |
66.63 ± 2.23 |
12.29 b ± 0.13 |
10.42 c ± 0.10 |
|
CMC/TS+TiO2+DOF |
67.80 ± 2.55 |
23.69 a ± 2.53 |
6.94 d ± 0.46 |
Note: Values show the average ± standard deviation (n = 3). NS indicates a non-significant difference (P > 0.05). Different superscript letters in each column indicate significant differences (P ≤ 0.05).
Moisture-related properties
As shown in Table 4, the moisture contents of CMC/TS, CMC/TS+TiO2, CMC/TS+DOF, and CMC/TS+TiO2+DOF films ranged from 21.10 to 26.40%. The moisture contents of blended films containing TiO2 nanoparticles and/or DOF extracts were significantly higher than those of CMC/TS film (P < 0.05). Meanwhile, the water solubility of all films ranged from 31.67 to 39.08% (Table 4). CMC/TS had the highest water solubility. The incorporation of TiO2 nanoparticles and/or DOF extracts into films caused a significant decrease in water solubility (P < 0.05). For the water-holding capacity value of films (Table 4), this value slightly varied from 1,132.10 to 1,282.00% and was lower than those of the cellulose nanofiber-based indicator film (1,816.2 to 1,850.3%) reported by Roy and Rhim (2021). According to the result, CMC/TS+TiO2 film had a higher water-holding capacity value than CMC/TS film (P < 0.05), while the water-holding capacity values of CMC/TS+DOF and CMC/TS+TiO2+DOF films were not significantly different from the value of CMC/TS film. For WVP values, all films insignificantly varied from 0.91 to 1.12 ×10⁻¹¹‧g‧m-1‧Pa-1‧s-1 (P > 0.05) (Table 4), which were significantly higher than that of CMC/TS+TiO2+DOF film (0.62 ×10⁻¹¹‧g‧m-1‧Pa-1‧s-1) (P < 0.05).
Table 4. Moisture content, water solubility, water-holding capacity, and water vapor permeability of CMC/TS, CMC/TS+TiO2, CMC/TS+DOF, and CMC/TS+TiO2+DOF films.
|
Film |
Moisture content |
Water solubility |
Water-holding capacity |
Water vapor permeability |
|
|
(%) |
(%) |
(%) |
(×10-11‧g‧m-1‧Pa-1‧s-1) |
|
CMC/TS |
21.10c ± 0.47 |
39.08a ± 0.60 |
1,132.10b ± 38.22 |
0.91a ± 0.07 |
|
CMC/TS+TiO2 |
23.63b ± 0.80 |
36.51b ± 0.39 |
1,282.00a ± 96.73 |
1.12a ± 0.21 |
|
CMC/TS+DOF |
24.08b ± 1.38 |
35.09b ± 1.66 |
1,218.56ab ± 52.65 |
1.02a ± 0.08 |
|
CMC/TS+TiO2+DOF |
26.40a ± 0.42 |
31.67c ± 0.44 |
1,200.93ab ± 12.69 |
0.62b ± 0.01 |
Note: Values show the average ± standard deviation (n = 3). Different superscript letters in each column indicate significant differences (P ≤ 0.05).
Structural properties
The XRD patterns of CMC/TS, CMC/TS+TiO2, CMC/TS+DOF, and CMC/TS+TiO2+DOF films are shown in Figure 2. Several sharp diffraction peaks of TiO2 nanoparticles at around 2θ = 25.3°, 29.4°, 37.8°, 43.1°, 48.5°, and 53.9° were observed in all the films. Among them, 25.3° and 29.4° matched with (101) diffraction planes of anatase which were reported by Plermjai et al. (2019) and Uddin et al. (2020), respectively. While 37.8°, 43.1°, 48.5°, and 53.9° matched with (101) diffraction planes of anatase (Plermjai et al., 2019; Uddin et al., 2020; Siripatrawan and Kaewklin, 2018). Broad peaks at around 2θ = 20° were observed in all the films, indicating their amorphous region. This region was gradually expanded when TiO2, DOF, and TiO2+DOF were respectively added.
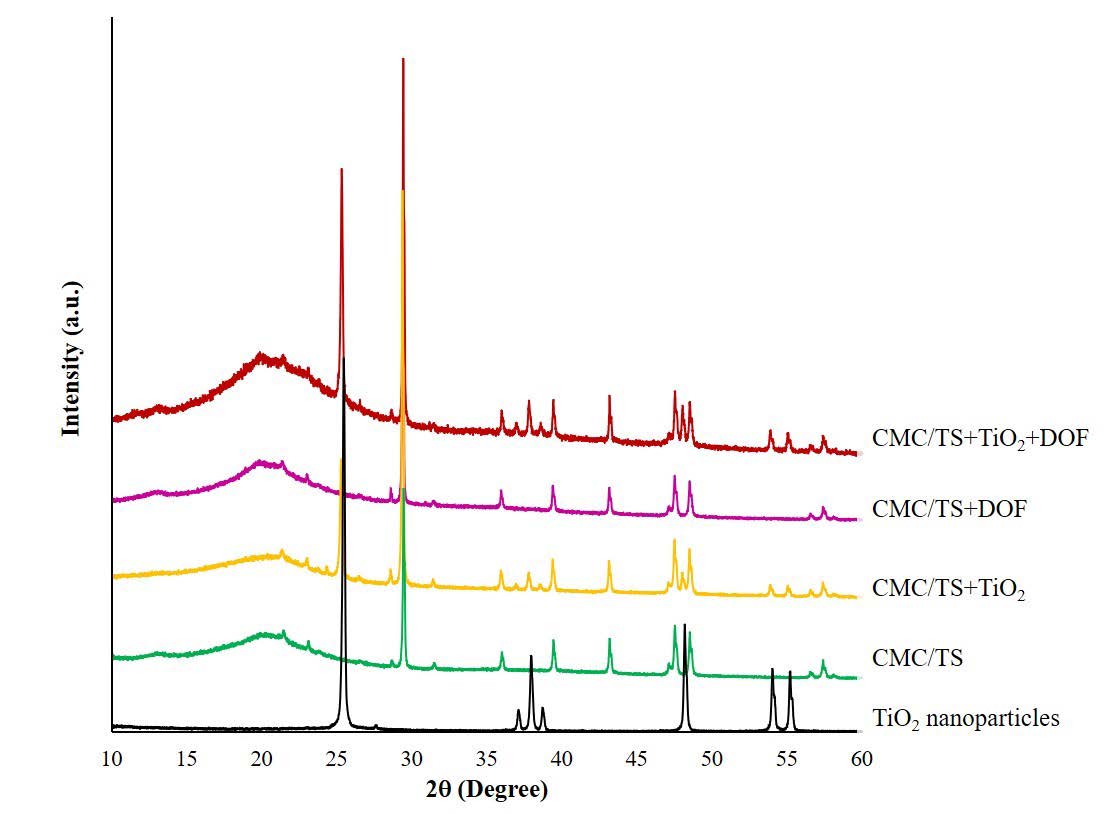
Figure 2. X-ray diffraction patterns of blended films.
Figure 3 shows the SEM images for evaluating the surface morphology of all films. CMC/TS films without DOF extract and TiO2 had the smoothest surface, while other films were not smooth. The surface of CMC/TS+TiO2 and CMC/TS+TiO2+DOF films showed regular dispersion of white TiO2 nanoparticles. In CMC/TS+DOF and CMC/TS+TiO2+DOF films, the globule particles dispersed on the film surface, and a larger particle size was observed on the surface of CMC/TS+TiO2+DOF films.
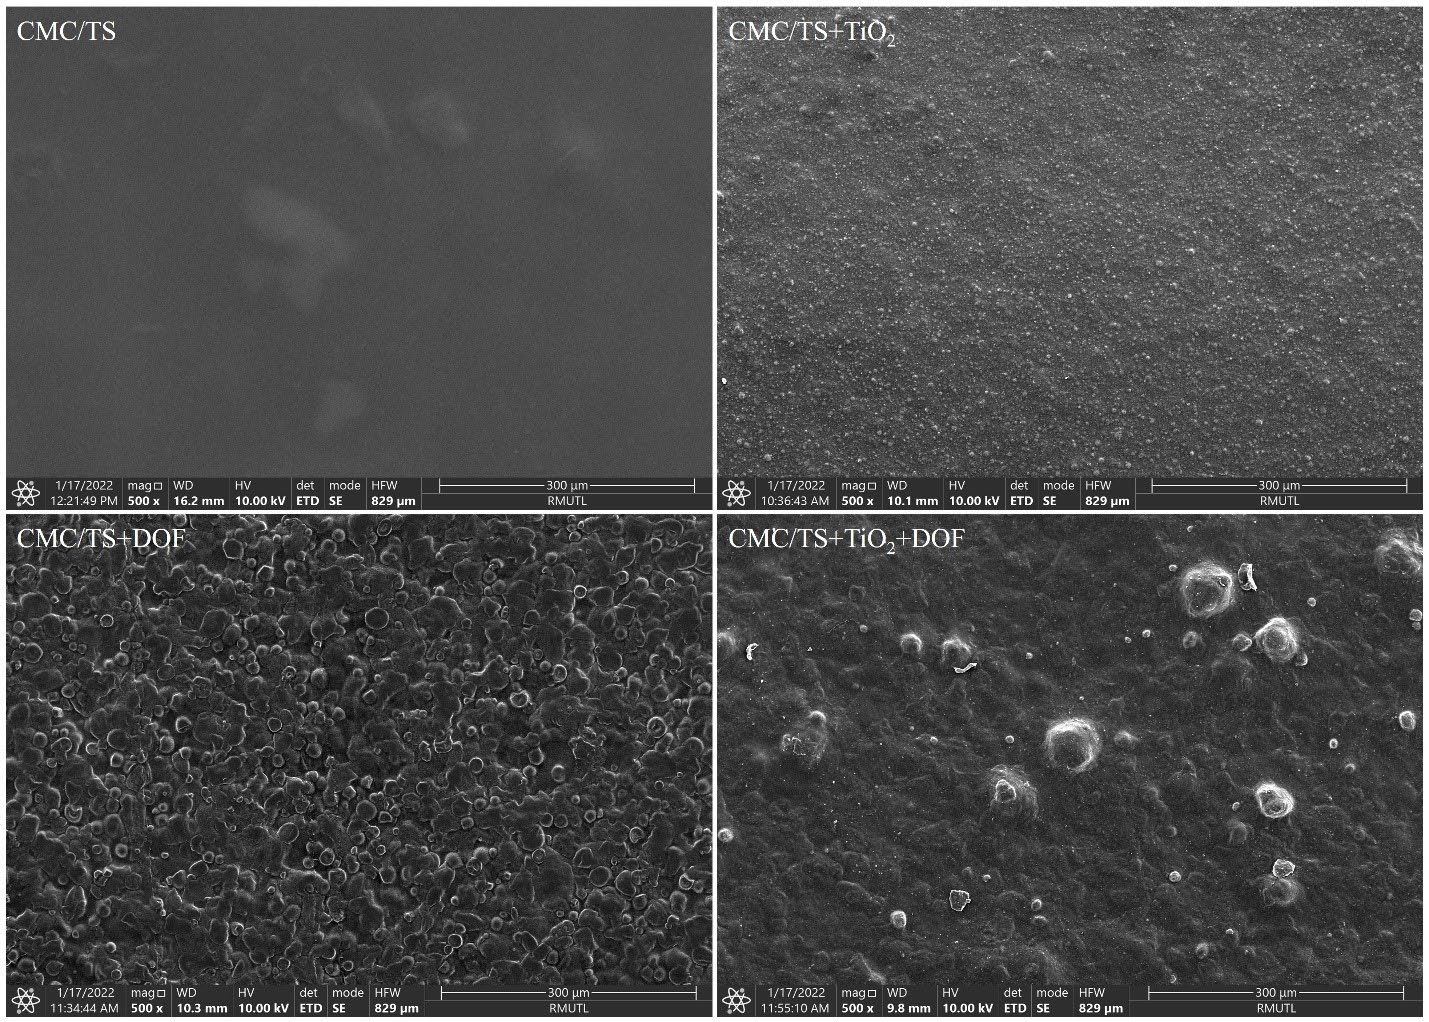
Figure 3. Scanning electron microscopic images show the surface morphology of the blended films (500× magnification).
Sensitivity of indicator film to vapors of ammonia and acetic acid
Figure 4 shows the sensitivity of indicator film (CMC/TS+TiO2+DOF film) responding to vapors of ammonia or acetic acid. It was observed that the film could effectively respond to both ammonia and acetic acid vapor by changing the color as a function of time. Notably, the ∆E value of the film sharply increased when exposed to ammonia vapor in the first 5 min. At this point, ammonia vapor could clearly change the film color from purple to green. Meanwhile, a slower increase in ∆E value was observed when the film was exposed to acetic acid vapor.
Potential application of indicator film for the freshness of packaged fish
In this work, a piece of the Tuna fillet of was kept in a polyethylene terephthalate (PET) package where the CMC/TS+TiO2+DOF film was attached inside a package lid, as shown in Figure 5. The results showed that the quality of fish fillets changed throughout 9 days of storage, which was related to the change of indicator film color. As shown in Figure 5 (A), TVB-N contents gradually increase throughout the storage period. Meanwhile, the pH value of the fish fillet changed up and down throughout the storage period, but the overview had an increased trend (Figure 5 (B)). The microbial growth in the sample continuously increased throughout the storage period (Figure 5 (C)). However, the bacterial spoilage threshold is defined as log 7.0 CFU/g (Pacquit et al., 2007). Therefore, the shelf life of this sample was 4 days (7.44 log CFU/g). For ∆E value, the initial ∆E value of the film was zero and it tended to continuously increase during storage (Figure 5 (D)). Interestingly, the spoilage of the packaged fish fillet during storage could be evidently monitored in real-time by changing the film color (Figure 5 (E)). The film color was initially purple when the fish fillet was fresh. Then, the film color gradually turned to a bluish-purple color (∆E = 14.31) on day 4 and the last turned to a green color (∆E = 20.94) on day 9, indicating a completely spoiled fish fillet that could not be consumed.
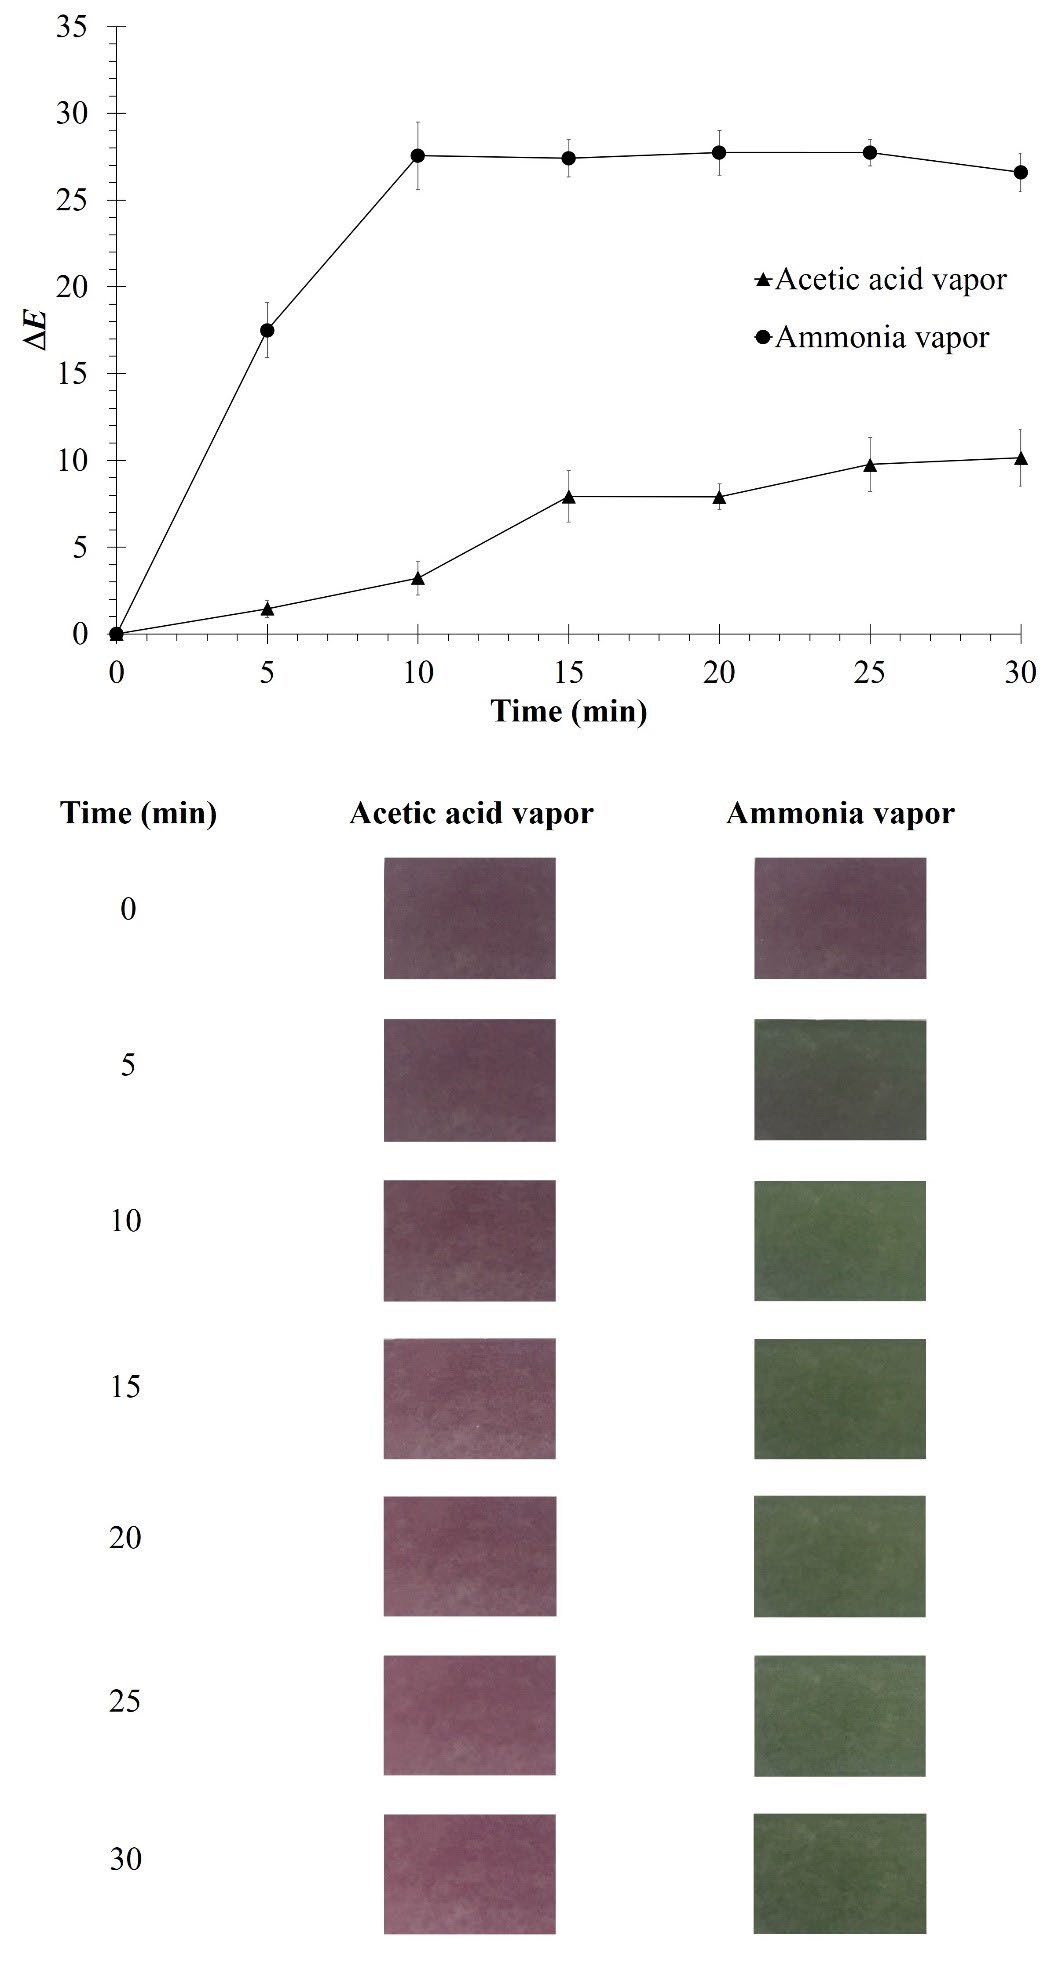
Figure 4. Sensitivity and color change of CMC/TS+TiO2+DOF film against acetic acid vapor and ammonia vapor.
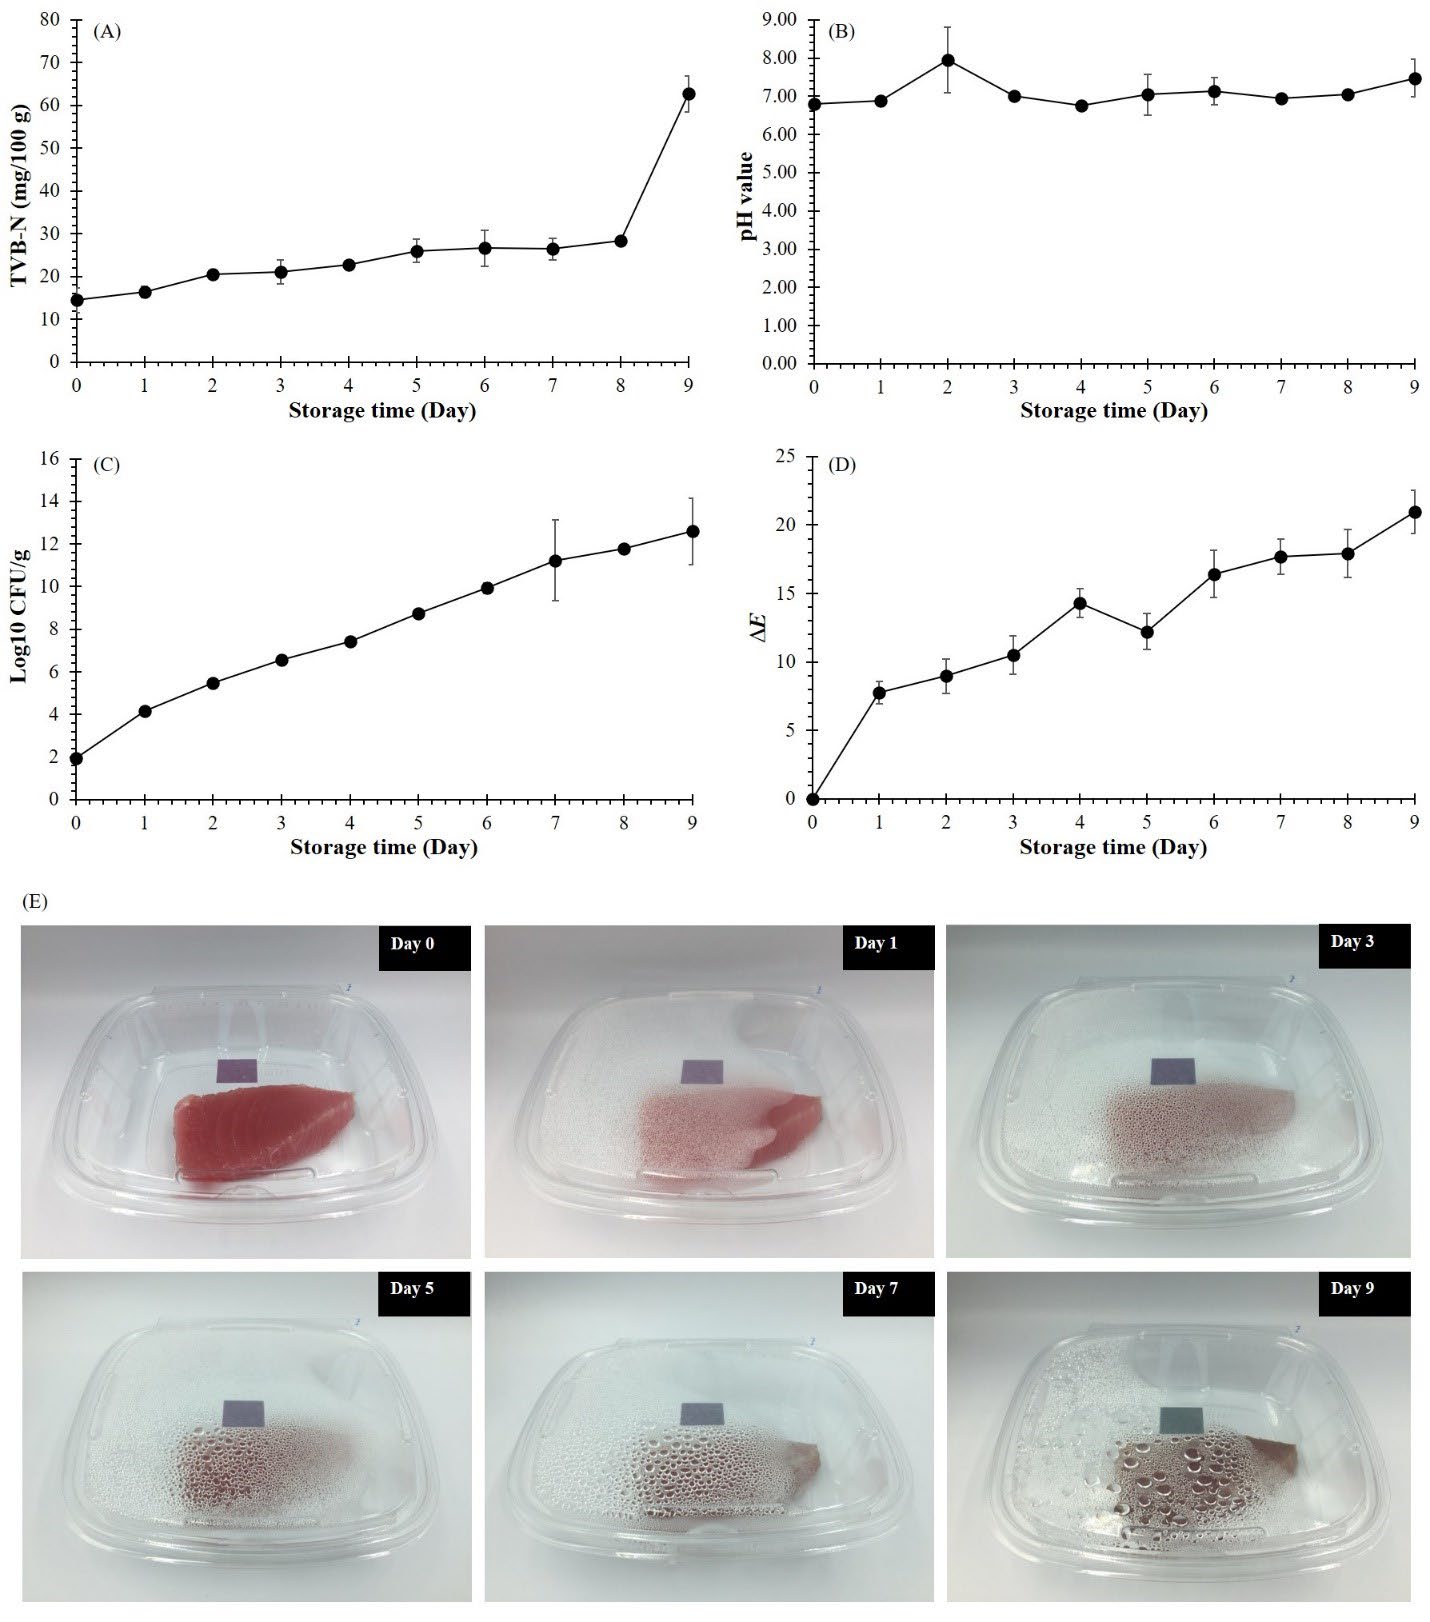
Figure 5. Changes in total volatile-based nitrogen (TVB-N) (A), pH value (B), microbial growth (C),∆E value (D), and color of CMC/TS+TiO2+DOF film during spoilage of Tuna fish fillets at 4°C for 9 days (E).
As summarized in Table 5, TVB-N content was correlated with the Log10 CFU/g and ∆E values. The higher the TVB-N content, the higher the values for Log10 CFU/g (r = 0.728, P ≤ 0.05) and ∆E (r = 0.721, P ≤ 0.05). The Log10 CFU/g was highly correlated with the ∆E value. The higher Log10 CFU/g strongly contributed to the higher ∆E value (r = 0.970, P ≤ 0.01).
Table 5. Pearson correlation coefficients for TVB-N, pH value, and Log10 CFU/g of Tuna fish fillets correlated with ∆E value of the indicator film (CMC/TS+TiO2+DOF film).
|
|
TVB-N |
pH |
Log10 CFU/g |
DE |
|
TVB-N |
1.000 |
NS |
0.728 * |
0.721 * |
|
pH value |
|
1.000 |
NS |
NS |
|
Log10 CFU/g |
|
|
1.000 |
0.970** |
|
DE |
|
|
|
1.000 |
DISCUSSION
The TPC and TAC values of the DOF extract were very high, compared to the extracts from other sources, such as black bean, red cabbage, black plum peel, and black rice (Prietto et al., 2017; Zhang et al., 2019; Leonarski et al., 2024), indicating that this natural colorant was excellent for application in a pH indicator. The LC-MS/MS data obtained from analysis of DOF extract revealed the existence of the pigment (peonidin-3,5-O-diglucoside) in anthocyanin groups and phenolic compounds. Among these phenolic compounds, many kinds of them can play the role of antioxidant, anticancer, and anti-inflammatory activities (Caparica et al., 2020; Ahammed et al., 2021). Moreover, phenolic acids, flavones, and flavonols possibly function as a copigment in the copigmentation reaction as well (Zhang et al., 2016; Cao et al., 2023), which might support the color development of the indicator film. Under pH variation, the anthocyanin molecules were structurally transformed to be a specific form suitable to the pH value, and likewise, their UV-visible light absorption was also changed. The anthocyanin molecules are a flavylium cation at pH values below 4. At pH 5 to 7, the redness decreases and turns to blueness more, because of an increasing formation of a neutral quinonoidal anhydrobase (Trouillas et al., 2016). At pH 8 to 12, the increasing formation of an anionic quinoidal anhydrobase and a yellow chalcone in a strongly alkaline environment causes the increment of blueness until it finalizes green at pH 12. Under a pH 13 environment, all anthocyanin molecules are completely transformed into yellow chalcone. Evidently, these color responses for DOF extracts and indicator films were not similar to other sources that had been reported previously (Choi et al., 2017; Zhang et al., 2019; Zhang et al., 2019). Theoretically, the differences in color properties of anthocyanin extracts from different sources can be attributed to the kind and concentration of anthocyanins and copigments.
Remarkably, the addition of TiO2 nanoparticles to the CMC/TS+TiO2+DOF film contributed to the increase in its redness, yellowness, and color difference. This directly resulted from adding white TiO2 nanoparticles since it was assumed to have a synergistic effect on color expression between pigments and TiO2 nanoparticles. The nanoparticles would improve the opacity of the film by functioning as a background material enhancing the color expression of the indicator pigment. Similar results were reported by previous findings in gelatin/agar-TiO2 bilayer film (Vejdan et al., 2016) and chitosan-black plum peel extract film (Zhang et al., 2019).
In the study of film thickness, films were prepared using ethanol, making whole components fully dispersed. Thus, the addition of DOF extract and/or TiO2 nanoparticles slightly affected the film thickness. Corresponded with Zhang et al. (2019), the authors discussed that the incorporation of TiO2 and anthocyanin-rich extract little influenced the film thickness since they could be well distributed in the space of the film matrix. However, the added extract can increase the dry matter content of film casting solution at the same amount, resulting in a mass increase and therefore inducing an increased film thickness (Qin et al., 2019; Zhang et al., 2020). For opacity, it was clearly seen that the addition of TiO2 nanoparticles and/or DOF extracts directly influenced the film opacity. Corresponded with recent research (Vejdan et al., 2017; Zhang et al., 2019; Zhang et al., 2023), films with increased opacity also improved ultraviolet light barrier properties. Therefore, this result suggested that the CMC/TS+TiO2+DOF film could be used as food packaging to reduce the negative effects of UV–visible light on nutrient losses, discoloration, and off-flavor. Significantly, the synergistic effect of TiO2 nanoparticles and DOF extracts on film opacity was observed, and it could be confirmed by a greatly enhanced red color of the CMC/TS+TiO2+DOF film over CMC/TS+TiO2 and CMC/TS+DOF films. In addition, high opacity could improve the color development of the indicator film during food storage to easily be observed by bare eyes.
For the mechanical properties, TiO2 nanoparticles added could strengthen the CMC/TS film network through the increasing formation of hydrogen bonds, while phenolic compounds could act in the role of plasticizer (Cheng et al., 2015; Siripatrawan and Kaewklin, 2018; Yuan et al., 2022). For EB value, an inhomogeneous distribution of the agglomerated TiO2 nanoparticles, as evidenced in the SEM image, may disrupt the intermolecular interactions within a film network, resulting in lower EB. Previously, a decrease in EB with the incorporation of TiO2 nanoparticles has been reported (Siripatrawan and Kaewklin, 2018; Zhang et al., 2019). In addition, a film with higher TS showed a lower stretchability since the increasing electrostatic interaction among ions of flavylium cations, TiO2, and CMC’s carboxylate anions might occur, thus obtaining stronger films but a lower stretch. Different experimental results have been reported previously, which supported an increase in EB with the incorporation of anthocyanin-rich extract in the indicator film (Liang et al., 2019; Zhang et al., 2019; Zhang et al., 2020). However, a film with high stretchability is not necessary since an on-package indicator film requires a stable structure.
For the moisture-related properties, CMC/TS+TiO2+DOF film exhibited the highest moisture content since both TiO2 nanoparticles and DOF extracts were full of abundant hydrophilic groups. Furthermore, the porosity of TiO2 nanoparticles in films facilitated moisture absorption (Vejdan et al., 2016; Achachlouei and Zahedi, 2018). For water solubility, it is an important parameter reflecting water resistance and dimension stability of films (Guerrero et al., 2011). CMC/TS showed the highest value of water solubility owing to the hydrophilic nature of both CMC and TS. Similar results were studied in gelatin/κ-carrageenan/TiO2/saffron anthocyanin films which were reported recently by Sani et al. (2022). In this work, the presence of TiO2 and flavylium cations expectedly contributed to the addition of positive charges to the CMC film matrix’s negative charges. Consequently, the strengthened films reduced the water solubility and the dimension loss. A higher water-holding capacity value of CMC/TS+TiO2 film over CMC/TS film implied that the incorporation of TiO2 nanoparticles into the film could enhance the water-holding capacity due to the increasing probability of hydrogen bond formation and swelling. While the films without both TiO2 and DOF extract or with DOF extract might have a high crosslinking density and limit the swelling of films. For the indicator film, we assumed that the water-holding capacity should not be high due to the limitations of anthocyanin stability, dimension stability, and color development. For the WVP, this parameter is evaluated for its barrier property against water vapor, and it is noted that a lower WVP was generally required for food packaging (Huang et al., 2019). This result indicated that the incorporation of TiO2 nanoparticles and DOF extracts into films influenced the WVP. The existence of both DOF extract and TiO2 nanoparticles in the film caused the formation of large agglomerates some of which could be seen on the surface of the CMC/TS+TiO2+DOF film, as shown in Figure 3. Phenolic compounds in the DOF extract might bind to TiO2 nanoparticles and form agglomerates containing an air bubble. This reservoir-like structure could greatly entrap the water vapor as well as hinder the film network's water vapor micro-paths, leading to a decrease in WVP value. This result can be assumed as the synergistic effect of DOF extract and TiO2 nanoparticles in the improvement of film quality.
In the study of the structural properties, two properties including the XRD pattern and SEM image were investigated. According to the XRD patterns, the obtained results corresponded to Zhang et al. (2019), the authors indicated that the formation of amorphous complexes by blending anthocyanin-rich black plum peel extract into chitosan film could occur. Likewise, Siripatrawan and Kaewklin (2018) revealed that the formation of hydrogen bonds between TiO2 and chitosan could expand the amorphous region of chitosan, leading to the reduction of the film's crystallinity. The peak of CMC/TS+TiO2+DOF film at 2θ = 25.3° was more intensified than CMC/TS+TiO2, due to the formation of electrostatic interaction between CMC’s carboxylate anion and peonidin-3,5-O-diglucoside (Liang et al., 2019), which might disrupt and reduce the hydrogen bonds between CMC/TS and TiO2. The number of TiO2 nanoparticles without bonding in that film might be more, resulting in more intensity of the TiO2 peak. Following SEM images’ results, similar findings about regular dispersion of an agglomerate of white TiO2 nanoparticles on the film surface were also found in previous works (Siripatrawan and Kaewklin, 2018; Zhang et al., 2019). Siripatrawan and Kaewklin (2018) demonstrated that the TiO2 nanoparticle agglomerates in the film matrix were attributed to high TiO2 concentrations. This was a regular dispersion between film-forming hydrocolloids and the compatible particles. However, the formation of globule particles dispersed on the film surface was complex. Theoretically, flavylium cations might be entrapped electrostatically by long chains of CMC carboxylate anions (Liang et al., 2019) and formed as small globule particles buried on the film surface. Likewise, it was possible that anthocyanins might combine with titanium ions through electrostatic interaction (Amogne et al., 2020), and the complexes might be entrapped in the CMC networks resulting in large globule particles on the film surface.
Additionally, the sensitivity of indicator film (CMC/TS+TiO2+DOF film) responding to vapors of ammonia or acetic acid was proved. The result reflected the effective permeability of ammonia vapor into the film leading to the accumulation of an alkaline environment and the development of a green color film. This study suggested that the film was more sensitive to ammonia vapor than acetic acid vapor and was suitable to be used for monitoring the release of volatile nitrogen compounds during fish fillet spoilage.
After the freshness of packaged fish fillets was monitored for 9 days storage time. The quality of fish fillets changed over time during 9 days of storage and related to the color change of the indicator film. The increase in TVB-N during day 0 to day 8 of the storage period could be attributed to the production of various volatile nitrogenous compounds, such as ammonia and amines, by the action of spoilage bacterial enzymes in fish fillets (Cai et al., 2014; Zhang et al., 2019). On day 9, the fish fillet's physiological change due to microbial growth caused the compounds' great release. However, the change in TVB-N content was not related to the pH change. The accumulation of TVB-N in the sample made it the highest pH value on the second day. After that, the decrease in pH value on days 3 and 4 might probably be attributed to bacterial fermentation of carbohydrates, resulting in the formation and accumulation of organic acids (e.g., lactic acid) in fish fillets (Cai et al., 2014). Nevertheless, a recent trend of a continuous increase in pH value was reported in shrimp spoilage since the generation of organic acid was limited by its negligible carbohydrate content (Zhang et al., 2020). The increment of microbial growth might be an important reason for the above results of both TVB-N content and pH value. The food microorganisms can produce enzymes to break down the nutrients and cause spoilage during storage. This study revealed that this sample had 4 days of shelf life judged by microbial count. Although the appearance of the fish fillet on day 4 remained good, the microbial count was over the limit. Therefore, the naked eye could not precisely judge the fish fillet's quality. The increase in the ∆E value of the film tended to continuously increase during storage, reflecting the increase in the invisible activities of TVB-N release and microbial growth, which were confirmed by the statistical results of Pearson correlation coefficients. Interestingly, this study also found that when the fish fillets had already spoiled by the 4th day of storage, their TVB-N contents were 22.75 ± 0.80 mg/100 g, which was lower than 30 mg/100 g as the standard value imposed by the European Commission Decision 95/149/EC (95/149/EC: Commission Decision of 8 March 1995 fixing the total volatile basic nitrogen (TVB-N) limit values for certain categories of fishery products and specifying the analysis methods to be used, 1995). This reflects that the indicator film was highly effective and could detect the quality change of the fish fillets even if the TVB-N content was below standard criteria. Finally, it was enough to conclude that the film became a bluish-purple color when the fish fillet was not fresh and should have been consumed before day 4 at 4°C. Therefore, this indicator film could be efficiently used to monitor the freshness of fish fillets.
CONCLUSION
A novel indicator film was successfully developed by incorporating the CMC/TS blend with TiO2 nanoparticles and DOF extract. The properties of the developed film were greatly influenced by TiO2 and DOF extract. DOF extract was proved as a potential source for the development of indicator film, due to the remarkable chemical compositions and reliable responses to pH variations. The incorporation of TiO2 nanoparticles into the film significantly improved the film's opacity, tensile strength, and water vapor permeability. Evaluation of sensitivity revealed that the film was sensitive to ammonia and suitable for application to detect the pH values of food changed under spoilage processes. In addition, the application of the film to a Tuna fish fillet gave a reliable result for film color change correlated to microbial growth and was easily detectable by the eyes. Therefore, the proposed indicator film is a simple tool for real-time detection of food quality.
ACKNOWLEDGMENT
This work (Grant No. RGNS 63-106) was supported by Office of the Permanent Secretary, Ministry of Higher Education, Science, Research and Innovation (OPS MHESI), Thailand Science Research and Innovation (TSRI) and Rajamangala University of Technology Lanna. This research work was partially supported by Chiang Mai University.
AUTHOR CONTRIBUTIONS
Ratchadaporn Jaimun designed and conducted all of the experiments, performed the statistical analysis and data visualization, and wrote the manuscript. Nattapong Kanha assisted in conducting the experiments. Jurmkwan Sangsuwan performed supervision, writing - review and editing, and validation. All authors have read and approved of the final manuscript.
CONFLICT OF INTEREST
The authors declare that they hold no competing interests.
REFERENCES
95/149/EC: Commission Decision of 8 March 1995 fixing the total volatile basic nitrogen (TVB-N) limit values for certain categories of fishery products and specifying the analysis methods to be used. 1995. Official Journal. L 97: 84-87. http://data.europa.eu/eli/dec/1995/149/oj
Achachlouei, B.F., and Zahedi, Y. 2018. Fabrication and characterization of CMC-based nanocomposites reinforced with sodium montmorillonite and TiO2 nanomaterials. Carbohydrate Polymers. 199: 415–425.
Agarwal, S., Hoque, M., Bandara, N., Pal, K., and Sarkar, P. 2020. Synthesis and characterization of tamarind kernel powder-based antimicrobial edible films loaded with geraniol. Food Packaging and Shelf Life. 26: 100562.
Ahammed, S., Afrin, R., Uddin, N., Al-Amin, Y., Hasan, K., Haque, U., Islam, K.M.M., Alam, A.H.M.K., Tanaka, T., and Sadik, G. 2021. Acetylcholinesterase inhibitory and antioxidant activity of the compounds isolated from Vanda roxburghii. Advances in Pharmacological and Pharmaceutical Sciences. 2021: 5569054.
Amogne, N.Y., Ayele, D.W., and Tsigie, Y.A. 2020. Recent advances in anthocyanin dyes extracted from plants for dye sensitized solar cell. Materials for Renewable and Sustainable Energy. 9: 23.
Aschner M. 2009. Chapter 8 - Nanoparticles: Transport across the olfactory epithelium and application to the assessment of brain function in health and disease. Progress in Brain Research. 180: 141–152.
ASTM E 95–96. 1995. Standard test methods for water vapor transmission of materials (E96-E95). Annual Books of ASTM Standards. 552: 785–792.
Azizi-Lalabadi, M., Ehsani, A., Divband, B., and Alizadeh-Sani, M. 2019. Antimicrobial activity of titanium dioxide and zinc oxide nanoparticles supported in 4A zeolite and evaluation the morphological characteristic. Scientific Reports. 9: 17439.
Caparica, R., Júlio, A., Araújo, M.E.M., Baby, A.R., Fonte, P., Costa, J.G., and Santos de Almeida, T. 2020. Anticancer activity of rutin and its combination with ionic liquids on renal cells. Biomolecules. 10(2): 233.
Cai, L., Wu, X., Li, X., Zhong, K., Li, Y., and Li, J. 2014. Effects of different freezing treatments on physicochemical responses and microbial characteristics of Japanese sea bass (Lateolabrax Japonicas) fillets during refrigerated storage. LWT - Food Science and Technology. 59(1): 122–129.
Cao, Y., Xia, Q., Aniya, Chen, J., and Jin, Z. 2023. Copigmentation effect of flavonols on anthocyanins in black mulberry juice and their interaction mechanism investigation. Food Chemistry. 399: 133927.
Cheng, S.Y., Wang, B.J., and Weng, Y.M. 2015. Antioxidant and antimicrobial edible zein/chitosan composite films fabricated by incorporation of phenolic compounds and dicarboxylic acids. LWT-Food Science and Technology. 63: 115–121.
Choi, I., Lee, J.Y., Lacroix, M., and Han, J. 2017. Intelligent pH indicator film composed of agar/potato starch and anthocyanin extracts from purple sweet potato. Food Chemistry. 218: 122–128.
Daghrir, R., Drogui, P., and Robert, D. 2013. Modified TiO2 for environmental photocatalytic applications: A review. Industrial & Engineering Chemistry Research. 52: 3581–3599.
Guerrero, P., Stefani, P.M., Ruseckaite, R.A., and Caba, K.D.L. 2011. Functional properties of films based on soy protein isolate and gelatin processed by compression molding. Journal of Food Engineering. 105(1): 65–72.
Grzyb, A., Wolna-Maruwka, A., and Niewiadomska, A. 2021. The significance of microbial transformation of nitrogen compounds in the light of integrated crop management. Agronomy. 11(7): 1415.
Huang, S., Xiong, Y., Zou, Y., Dong, Q., Ding, F., Liu, X., and Li, H. 2019. A novel colorimetric indicator based on agar incorporated with Arnebia euchroma root extracts for monitoring fish freshness. Food Hydrocolloids. 90: 198–205.
Kanha, N., Osiriphun, S., Rakariyatham, K., Klangpetch, W., and Laokuldilok, T. 2022. On-package indicator films based on natural pigments and polysaccharides for monitoring food quality: A review. Journal of the Science of Food and Agriculture. 102(15): 6804–6823.
Kanha, N., Regenstein, J. M., Surawang, S., Pitchakarn, P., and Laokuldilok, T. 2021. Properties and kinetics of the in vitro release of anthocyanin-rich microcapsules produced through spray and freeze-drying complex coacervated double emulsions. Food Chemistry. 340: 127950.
Leonarski, E., Kuasnei, M., dos Santos, E.H., Benvenutti, L., Moraes, P.A.D., Cesca, K., de Oliveira, D., and Zielinski, A.A.F. 2024. Ultrasound and microwave-assisted extractions as green and efficient approaches to recover anthocyanin from black rice bran. Biomass Conversion and Biorefinery. https://doi.org/10.1007/s13399-024-05479-4.
Lee, E.J., and Shin, H.S. 2019. Development of a freshness indicator for monitoring the quality of beef during storage. Food Science and Biotechnology. 28(6); 1899–1906.
Li, T., Li, J., Hu, W., and Li, X. 2013. Quality enhancement in refrigerated red drum (Sciaenops ocellatus) fillets using chitosan coatings containing natural preservatives. Food Chemistry. 138(2–3): 821–826.
Liang, T., Sun, G., Cao, L., Li, J., and Wang, L. 2019. A pH and NH3 sensing intelligent film based on Artemisia sphaerocephala Krasch. gum and red cabbage anthocyanins anchored by carboxymethyl cellulose sodium added as a host complex. Food Hydrocolloids. 87: 858–868.
Ma, Q., and Wang, L. 2016. Preparation of a visual pH‐sensing film based on tara gum incorporating cellulose and extracts from grape skins. Sensors and Actuators B: Chemical. 235: 401–407.
Medina, C., Santos-Martinez, M.J., Radomski, A., Corrigan, O.I., and Radomski, M.W. (2007). Nanoparticles: Pharmacological and toxicological significance. British Journal of Pharmacology. 150(5): 552–558.
Pacquit, A., Frisby, J., Diamond, D., Lau, K.T., Farrell, A., Quilty, B., and Diamond, D. 2007. Development of a smart packaging for the monitoring of fish spoilage. Food Chemistry. 102(2): 466–470.
Plermjai, K., Boonyarattanakalin, K., Mekprasart, W., Phoohinkong, W., Pavasupree, S., and Pecharapa, W. 2019. Optical absorption and FTIR study of cellulose/TiO2 hybrid composites. Chiang Mai Journal of Science. 46(3): 618–625.
Prabha, S., Arya, G., Chandra, R., Ahmed, B., and Nimesh, S. 2016. Effect of size on biological properties of nanoparticles employed in gene delivery. Artificial Cells, Nanomedicine, and Biotechnology. 44(1): 83–91.
Prietto, L., Mirapalhete, T.C., Pinto, V.Z., Hoffmann, J.F., Vanier, N.L., Lim, L.-T., Dias, A.R.G., and da Rosa Zavareze, E. 2017. pH-sensitive films containing anthocyanins extracted from black bean seed coat and red cabbage. LWT, 80, 492–500.
Qin, Y., Liu, Y., Yong, H., Liu, J., Zhang, X., and Liu, J. 2019. Preparation and characterization of active and intelligent packaging films based on cassava starch and anthocyanins from Lycium ruthenicum Murr. International Journal of Biological Macromolecules. 134: 80–90.
Roy, S., and Rhim, J. -W. 2021. Fabrication of cellulose nanofiber-based functional color indicator film incorporated with shikonin extracted from Lithospermum erythrorhizon root. Food Hydrocolloids. 114: 106566.
Roy, S., Van Hai, L., Kim, H. C., Zhai, L., and Kim, J. 2020. Preparation and characterization of synthetic melanin-like nanoparticles reinforced chitosan nanocomposite films. Carbohydrate Polymers. 231: 115729.
Sani, M.A., Tavassoli, M., Salim, S.A., Azizi-lalabadi, M., and McClements, D.J. 2022. Development of green halochromic smart and active packaging materials: TiO2 nanoparticle- and anthocyanin-loaded gelatin/κ-carrageenan films. Food Hydrocolloids. 124: 107324.
Siripatrawan, U., and Kaewklin, P. 2018. Fabrication and characterization of chitosan-titanium dioxide nanocomposite film as ethylene scavenging and antimicrobial active food packaging. Food Hydrocolloids. 84: 125–134.
Sutthasupa, S., Padungkit, C., and Suriyong, S. 2021. Colorimetric ammonia (NH3) sensor based on an alginate-methylcellulose blend hydrogel and the potential opportunity for the development of a minced pork spoilage indicator. Food Chemistry. 362: 130151.
Tongdeesoontorn, W., Mauer, L.J., Wongruong, S., Sriburi, P., and Rachtanapun, P. 2011. Effect of carboxymethyl cellulose concentration on physical properties of biodegradable cassava starch-based films. Chemistry Central Journal. 5(1): 6.
Trouillas, P., Sancho-García, J.C., De Freitas, V., Gierschner, J., Otyepka, M., and Dangles, O. 2016. Stabilizing and modulating color by copigmentation: Insights from theory and experiment. Chemical Reviews. 116(9): 4937–4982.
Uddin, M.J., Cesano, F., Chowdhury, A.R., Trad, T., Cravanzola, S., Martra, G., Mino, L., Zecchina, A., and Scarano, D. 2020. Surface structure and phase composition of TiO2 P25 particles after thermal treatments and HF etching. Frontiers in Materials. 7: 192.
Vejdan, A., Ojagh, S.M., Adeli, A., and Abdollahi, M. 2016. Effect of TiO2 nanoparticles on the physico-mechanical and ultraviolet light barrier properties of fish gelatin/agar bilayer film. LWT-Food Science and Technology. 71: 88–95.
Vejdan, A., Ojagh, S.M., and Abdollahi, M. 2017. Effect of gelatin/agar bilayer film incorporated with TiO2 nanoparticles as a UV absorbent on fish oil photooxidation. International Journal of Food Science and Technology. 52: 1862–1868.
World Health Organization. 2018. Food safety. http://www.who.int/en/news-room/factsheets/detail/food-safety/. (Accessed 23 November 2018).
Yu, Z., Liao, Y., Teixeira da Silva, J.A., Yang, Z., and Duan, J. 2018. Differential accumulation of anthocyanins in Dendrobium officinale stems with red and green peels. International Journal of Molecular Sciences. 19(10): 2857.
Yuan, B., Jiang, B., Li, H., Xu, X., Li, F., McClements, D.J., and Cao, C. 2022. Interactions between TiO2 nanoparticles and plant proteins: Role of hydrogen bonding. Food Hydrocolloids. 124(Part B): 107302.
Zhang, B., He, F., Zhou, P.P., Liu, Y., and Duan, C.Q. 2016. The color expression of copigmentation between malvidin-3-O-glucoside and three phenolic aldehydes in model solutions: The effects of pH and molar ratio. Food Chemistry. 199: 220–228.
Zhang, J., Zhang, J., Huang, X., Shi, J., Liu, L., Song, W., Zhai, X., Xiao, J., Hashim, S.B.H., Li, Z., Zou, X., and Povey, M. 2023. A visual bi-layer sensor based on agar/TiO2/butterfly bean flower anthocyanin/κ-carrageenan with photostability for monitoring Penaeus chinensis freshness. International Journal of Biological Macromolecules. 235: 123706.
Zhang, J., Zou, X., Zhai, X., Huang, X., Jiang, C., and Holmes, M. 2019. Preparation of an intelligent pH film based on biodegradable polymers and roselle anthocyanins for monitoring pork freshness. Food Chemistry. 272: 306–312.
Zhang, K., Huang, T.-S., Yan, H., Hu, X., and Ren, T. 2020. Novel pH-sensitive films based on starch/polyvinyl alcohol and food anthocyanins as a visual indicator of shrimp deterioration. International Journal of Biological Macromolecules. 145: 768–776.
Zhang, X., Liu, Y., Yong, H., Qin, Y., Liu, J., and Liu, J. 2019. Development of multifunctional food packaging films based on chitosan, TiO2 nanoparticles and anthocyanin-rich black plum peel extract. Food Hydrocolloids. 94: 80–92.
Zhao, J., Wang, Y., and Liu, C. 2022. Film transparency and opacity measurements. Food Analytical Methods. 15: 2840–2846.
OPEN access freely available online
Natural and Life Sciences Communications
Chiang Mai University, Thailand. https://cmuj.cmu.ac.th
Ratchadaporn Jaimun1, Nattapong Kanha2, 3, and Jurmkwan Sangsuwan3, *
1 Faculty of Arts and Architecture, Rajamangala University of Technology Lanna, Chiang Mai, 50300, Thailand.
2 Office of Research Administration, Chiang Mai University, Chiang Mai, 50200, Thailand.
3 Faculty of Agro-Industry, Chiang Mai University, Chiang Mai, 50100, Thailand.
Corresponding author: Jurmkwan Sangsuwan, E-mail: jurmkwan.s@cmu.ac.th
Total Article Views
Editor: Sirasit Srinuanpan,
Chiang Mai University, Thailand
Article history:
Received: March 11, 2024;
Revised: May 13, 2024;
Accepted: May 17, 2024;
Online First: June 17, 2024