 ISSN: 2822-0838 Online

Optimising High-Pressure Processing (HPP) for Optimal Total Phenolic and Flavonoid Content in Kelulut (Stingless Bee) Honey
Muhammad Faiz Razali, Balkis A.Talip, Noranizan Mohd Adzahan, Alifdalino Sulaiman, Azeman Samiun, and Noor Akhmazillah Mohd Fauzi*Published Date : May 20, 2024
DOI : https://doi.org/10.12982/NLSC.2024.034
Journal Issues : Number 3, July-September 2024
Abstract High-pressure processing (HPP) has the potential to enhance the total phenolic and flavonoid content (TPC and TFC) in Kelulut honey (KH). However, KH’s inherent variability possesses challenges in optimising these phytochemicals. This study hence explores the optimisation of KH through HPP, focusing on TPC and TFC. The Face-centered Central Composite Design (FC-CCD), involving two factors with three levels each (pressure of 200, 400, and 600 MPa, and time of 5, 10, and 15 min), was applied to investigate two response variables (total phenolic and flavonoid content). The optimisation identified the optimal parameters as 200 MPa for 15 min, with a desirability of 0.986, indicating precise modeling. Compared to other pressures (400 and 600 MPa) at common processing time (15 minutes), 200 MPa recorded higher TPC and TFC with differences of 25.71% to 30.92% and 13.78% to 14.19%, respectively. A verification step revealed that HPP-KH at 200 MPa for 15 minutes yielded a TPC of 15.278 ± 0.525 mg GAE/100 g and a TFC of 38.274 ± 1.980 mg RE/100 g, indicating the precise accuracy of the quadratic modeling. However, this discovery contradicts the consensus that pressures above 500 MPa increase TPC and TFC. Consequently, it underscores the need for tailored high-pressure strategies in KH processing, offering essential insights for industry applications and further research endeavors.
Keywords: HPP, Kelulut honey, Optimisation, Phenolic, Flavonoid
Funding: This research was funded by FUNDAMENTAL RESEARCH GRANT SCHEME (FRGS), MINISTRY OF HIGHER EDUCATION, grant number K302 (ID 19019; FRGS/1/2020/TK0/UTHM/02/21).
Citation: Razali, M.F., Talip, B.A., Adzahan, N.M., Sulaiman, A., Samiun, A., and, Fauzi, N.A.M. 2024. Optimising high-pressure processing (HPP) for optimal total phenolic and flavonoid content in Kelulut (stingless bee) honey. Natural and Life Sciences Communications. 23(3): e2024034.
INTRODUCTION
High-pressure processing (HPP) is one of the innovative non-thermal technologies in food processing. HPP has proven successful in processing various food products. Examples include liquid products like goat milk (Razali et al., 2021), juices such as Mao Luang (Antidesma bunius Linn.) juice (Chaikam and Baipong, 2016), smoothies (Song et al., 2022), sauces like guacamole (Houška et al., 2022), ready-to-eat products (Inanoglu et al., 2022), and Manuka honey (Fauzi et al., 2014), among others, all of which have demonstrated positive outcomes with HPP. Hence, it shows that various food products are well suited to HPP. Among the varieties, honey is intriguing to process with HPP due to the existence of thermolabile compounds in its composition. Applying high pressure instead of apparent heat in HPP will help retain thermolabile compounds while retaining the nutrients, colour, and flavours (Penchalaraju and Shireesha, 2013). In addition, HPP also has the ability to inactive microorganisms (Considine et al., 2008) that ensure the safety of the end products. With these benefits, it is evident that HPP is an excellent alternative for processing honey.
Several past studies further support the suitability of HPP for honey processing. HP-processed Manuka honey(Fauzi and Farid, 2017; Fauzi et al., 2013; Fauzi et al., 2014) and HP-processed Kelulut honey (Razali et al., 2019a; Razali et al., 2019b), HP-processed Mexican multi-floral honey (Leyva-Danie et al.,2017) and HP-processed Longan flower honey (Chaikham and Prangthip, 2015) all demonstrated excellent outcomes with HPP. Among all the attributes evaluated, antioxidant activity (AA) and total phenolic content (TPC) notably improved upon HPP treatment. The improvement is hypothesised to be due to the degradation of pollen inside honey, which releases more phenolic compounds (Fauzi et al., 2013). However, more data are required to substantiate the ability of HPP to improve AA and TPC content. The reason is that honey is diverse in composition depending on multiple factors such as geographical origin, climate, and food sources (Khalil et al., 2011). This inherent diversity suggests that specific honey samples may not uniformly exhibit identical results despite the overall positive trend observed in the literature.
HPP-honey mainly attains the improvement observed in AA and TPC at 500 to 600 MPa. Manuka honey increased in DPPH activity and TPC at 600 MPa for 10 minutes (Fauzi et al., 2014; Fauzi and Farid, 2015). Leyva-Daniel et al. (2017) also demonstrated that Mexican multi-floral honey had increased TPC after holding for 2 minutes at 600 MPa. Meanwhile, Chaikham and Prangthip (2015) observed an increase in TPC and antioxidant activity for longan flower honey upon increasing pressure and holding time, particularly at 500 MPa for 20 minutes. Based on these similar observations, it is evident that pressure and time play a significant role in the end output. Hence, both parameters can be manipulated to produce honey with optimal antioxidants.
To better substantiate the potential of manipulating pressure and time to optimise honey’s attributes, this study aims to optimise the total phenolic and flavonoid content of Kelulut honey (KH) via HPP. Internationally known as stingless bee honey, KH is inherent to Malaysia. Mainly collected from Heteretriogoa Itama and Geniotrigona thoracica, the antioxidant of KH is higher than in Tualang honey (Ranneh et al., 2017). Primarily composed of fructose and glucose, KH also contains phenolic compounds, flavonoids, organic acids, amino acids (phenylalanine, alanine, tyrosine, valine, acetate, and trigonelline), enzymes, vitamins, minerals, proteins, and nearly zero hydroxymethylfurfural (HMF) (Mustafa et al., 2018). Among these components, phenolic compounds are particularly interesting because of their nutraceutical and therapeutic value. The honey’s total phenolic content (TPC) strongly correlates with antioxidant activity, as demonstrated by the correlation between different antioxidant assays and TPC. (Hazirah et al., 2019; Maringgal et al., 2019). This finding supports the claim that stingless bee honey is an essential source of antioxidants.
This study employs the face-centered Central Composite Design (FC-CCD) of response surface methodology (RSM). RSM is a well-established method that enables the analysis of multiple variables simultaneously, ranging from process optimisation, such as the extraction of bioactive compound (Thaisungnoen et al., 2024) and mucilage (Fortuna et al., 2024), to product formulation, like the optimisation of film composition (Saepang et al.,2023). These examples highlight the versatility of RSM in optimising processes and experimental design. Several past studies have shown the suitability of RSM in the optimisation of HPP. The utilization of RSM to optimise HPP was successfully demonstrated in studies conducted by Wang et al. (2021) for soybean protein isolates in yogurt, Diez-Sánchez (2020) for milkshakes using chokeberry pomace, and Luo et al. (2018) for candied green plums. In addition, RSM has also been successfully demonstrated to optimise process parameters and their relation to phytochemicals in honey. A study by Nayik, Dar, and Nanda (2016) managed to optimise the combination of temperature, time, and pH on antioxidant activity, TPC, and TFC of apple honey. Another study by Nayik and Nanda (2016) also substantiated the optimisation of thermal treatment and pH on Saffron honey’s antioxidant activity, further showcasing the reliability of RSM. Despite the well-established nature of RSM in optimisation studies, the application to the optimisation of HPP for KH introduces a novel dimension. This study investigates RSM’s proven efficacy while exploring unique intricacies and challenges inherent to optimising HPP for KH, thereby contributing fresh insights and innovative approaches to the field.
Table 1. Experimental design for optimisation.
|
Standard |
Run |
Space Type |
Factor 1: Pressure (MPa) |
Factor 2: Time (minutes) |
|
5 |
1 |
Axial |
200 |
10 |
|
1 |
2 |
Factorial |
200 |
5 |
|
4 |
3 |
Factorial |
600 |
15 |
|
6 |
4 |
Axial |
600 |
10 |
|
11 |
5 |
Center |
400 |
10 |
|
2 |
6 |
Factorial |
600 |
5 |
|
8 |
7 |
Axial |
400 |
15 |
|
10 |
8 |
Center |
400 |
10 |
|
3 |
9 |
Factorial |
200 |
15 |
|
12 |
10 |
Center |
400 |
10 |
|
9 |
11 |
Center |
400 |
10 |
|
7 |
12 |
Axial |
400 |
5 |
|
13 |
13 |
Center |
400 |
10 |
Determination of total phenolic content (TPC)
The determination of Total Phenolic Content (TPC) followed a modified method derived from Singleton et al. (1999). Two grams of honey were diluted in 20 mL of distilled water and filtered through Whatman No. 1 filter paper. Subsequently, 1 mL of 0.2 N Folin-Ciocalteu reagent was added to the filtered solution, mixed for 5 minutes, and then supplemented with 0.8 mL of 75 mg/L sodium carbonate. The mixture was incubated for 2 hours at room temperature, and the absorbance was measured at 760 nm against a methanol blank. Gallic acid (Sigma-Aldrich Chemie, Steinheim, Germany) served as the standard for generating the calibration curve within a concentration range of 5-100 mg/L, dissolved in a mixture of methanol and distilled water (1:1). The TPC was quantified in grams of gallic acid equivalents (GAE) per 100 g of honey. The experiment was conducted in triplicates.
Determination of total flavonoid content (TFC)
The determination of Total Flavonoid Content (TFC) followed the procedure outlined by Chua et al. (2013) with minor adjustments. A 2 mL honey solution (0.1 g/mL) was combined with 2 mL of 2% aluminum chloride (AlCl3). The formation of the flavonoid-aluminum complex occurred during a 10-minute incubation at 25°C. Subsequently, the complex was measured at 415 nm using a UV-visible spectrophotometer. Rutin (0–100 mg/L) served as the standard for the calibration curve, with TFC expressed as a gram of rutin equivalent (RE) per 100 grams of honey. The assay was conducted in triplicate.
RESULTS
Optimisation of high-pressure processing (HPP)
Response Surface Methodology (RSM) with a Face-centered Central Composite Design (FC-CCD) of two (2) variables (Pressure, A; Time, B) and two (2) responses (TPC and TFC) employed 13 runs. Table 2 presents the results obtained from the FC-CCD experiment, including the actual and predicted values. For the TPC, the highest values recorded were at run #9 with 13.93 mg GAE/100 g, while for the TFC, it recorded the highest values in run #1 (39.03 mg RE/100 g). Both values were obtained at the same pressure of 200 MPa at different times of 10 and 15 min. A quadratic model with a sequential P-value of 0.01 for TPC and 0.03 for TFC was determined to be the best fit with the predicted and adjusted R2 having less than 0.2 difference.
Table 2. FC-CCD Experimental run with the actual and predicted values of TPC and TFC of Kelulut honey.
|
Run |
Factor A (Pressure, MPa) |
Factor B (Time, minutes) |
Response 1 (TPC, mg GAE/100 g) |
Response 2 (TFC, mg RE/100 g) |
||
|
Actual |
Predicted |
Actual |
Predicted |
|||
|
1 |
200 |
10 |
13.87 |
13.53 |
39.03 |
38.50 |
|
2 |
200 |
5 |
12.83 |
13.12 |
38.99 |
39.17 |
|
3 |
600 |
15 |
10.20 |
10.14 |
33.47 |
33.76 |
|
4 |
600 |
10 |
10.67 |
10.54 |
34.38 |
33.95 |
|
5 |
400 |
10 |
10.76 |
10.77 |
33.46 |
32.67 |
|
6 |
600 |
5 |
10.78 |
10.98 |
34.96 |
35.09 |
|
7 |
400 |
15 |
10.76 |
10.78 |
33.33 |
32.70 |
|
8 |
400 |
10 |
11.17 |
10.77 |
35.09 |
32.67 |
|
9 |
200 |
15 |
13.93 |
13.97 |
38.42 |
38.76 |
|
10 |
400 |
10 |
11.30 |
10.77 |
29.36 |
32.67 |
|
11 |
400 |
10 |
10.12 |
10.77 |
30.19 |
32.67 |
|
12 |
400 |
5 |
11.26 |
10.78 |
33.90 |
33.57 |
|
13 |
400 |
10 |
10.01 |
10.77 |
34.29 |
32.67 |
To better understand the reliability of the quadratic model in describing our data, an analysis of variance (ANOVA) was computed for both responses (Table 3 and Table 4). The quadratic model was indeed significant for both TPC and TFC since both registered p-values were less than 0.05, with an F-value of 14.07 and 3.98, respectively. This signifies that the quadratic model can be used to predict the TPC and TFC. In addition, there was only a 0.16% (TPC) and 4.97% (TFC) chance that an F-value of this large could occur due to noise. Based on the ANOVA results, it was apparent that pressure played a more significant role than time, as evidenced by the significant model terms A and A2 (P-value <0.05). However, the interaction term AB was insignificant (P >0.05). In addition to the predicted R2 and adjusted R2 having a difference of less than 0.2, the model also registered an Adeq precision greater than four for both responses. Therefore, this model can be used to navigate the design space. The following equation was computed to establish the effect of different variable levels on TPC and TFC responses (Equations 1 and 2).
TPC = 10.77-150A+0.0024B-0.4216AB+1.27A2+0.0153B2 (1)
TFC = 32.67-2.27A-0.4357B-0.2288AB+3.56A2+0.4713B2 (2)
Table 3. ANOVA table for response surface quadratic model for total phenolic content (TPC).
|
Source |
Sum of Squares |
df |
Mean Square |
F-value |
P-value |
|
|
Model |
19.41 |
5 |
3.88 |
14.07 |
0.00 |
significant |
|
A-Pressure |
13.43 |
1 |
13.43 |
48.67 |
0.00 |
|
|
B-Time |
0.00 |
1 |
0.00 |
0.00 |
0.99 |
|
|
AB |
0.71 |
1 |
0.71 |
2.58 |
0.15 |
|
|
A² |
4.46 |
1 |
4.46 |
16.18 |
0.00 |
|
|
B² |
0.00 |
1 |
0.00 |
0.00 |
0.96 |
|
|
Residual |
1.93 |
7 |
0.27 |
|
|
|
|
Lack of Fit |
0.53 |
3 |
0.17 |
0.51 |
0.69 |
not significant |
|
Pure Error |
1.39 |
4 |
0.34 |
|
|
|
|
Cor Total |
21.34 |
12 |
|
|
|
|
Table 4. ANOVA table for response surface quadratic model for total flavonoid content (TFC)
|
Source |
Sum of Squares |
df |
Mean Square |
F-value |
P-value |
|
|
2 |
78.06 |
5 |
15.61 |
3.98 |
0.04 |
significant |
|
A-Pressure |
30.96 |
1 |
30.96 |
7.90 |
0.02 |
|
|
B-Time |
1.14 |
1 |
1.14 |
0.29 |
0.60 |
|
|
AB |
0.20 |
1 |
0.20 |
0.05 |
0.82 |
|
|
A² |
34.97 |
1 |
34.97 |
8.92 |
0.02 |
|
|
B² |
0.61 |
1 |
0.61 |
0.15 |
0.70 |
|
|
Residual |
27.44 |
7 |
3.92 |
|
|
|
|
Lack of Fit |
1.39 |
3 |
0.46 |
0.07 |
0.97 |
not significant |
|
Pure Error |
26.05 |
4 |
6.51 |
|
|
|
|
Cor Total |
105.51 |
12 |
|
|
|
|
Based on the regression equation of TPC (Equation 1), the linear coefficient of terms A (pressure) and B (time) registered negative and positive values, respectively. Term A’s negative value indicates that TPC will linearly decrease when pressure increases. In contrast, term B, having a value of 0.0024, suggests that there is a slight increase in TPC upon increasing time. For the combination effect (AB), the negative value recorded signified an antagonistic interaction of terms A and B. As both terms increase simultaneously, TPC will decrease. In contrast, the positive quadratic coefficients show the non-linear relationship of terms A and B, hinting at the possibilities of the optimal condition of pressure and time that maximise TPC. For TFC, the regression equation (Equation 2) revealed a similar linear coefficient as TPC in which terms A and B had negative values, implying that an increase in pressure and time will cause a linear decrease in TFC. The interaction term for TFC also hinted at an interaction effect, albeit less pronounced than TPC. The quadratic coefficient for TFC also indicates the possibility of an optimal condition as shown by the positive values (non-linear relationships).
To visualize the relationship between pressure and time in the HPP of KH, 3D response surface plots were generated for each response, as depicted in Figure 1 (a) and (b). As mentioned earlier, pressure A was a more significant (P <0.05) model term for both responses, a trend evident in the response surface plots, particularly for TPC. The curves in these plots adequately represent optimal values, remaining within the experimental limits. The pressure effect was particularly prominent in TPC, where a distinctive downward curve was observed with increasing pressure, and the apex on the curve signified the highest registered TPC. Consequently, this was the optimal HPP parameter for the optimum TPC (200 MPa for 15 min). For TFC, the curve was not as prominent as that of TPC. However, the pressure term A was still more significant (P <0.05) than the time. It can be observed that, with increasing pressure, a distinctive curve is formed, in contrast to the pattern observed with increasing time. Similar to the TPC, the optimum parameter for TFC can also be found at 200 MPa, as it forms the apex in the response surface curve.
Regarding the common processing time of 15 minutes, 400 and 600 MPa registered lower TPC than 200 MPa, with a staggering difference of 25.71% and 30.92%, respectively. The same pattern was also observed with TFC, with 200 MPa having higher values than the other two pressure levels. The differences between 200 MPa to 400 and 600 MPa were 14.19% and 13.78%, respectively. The observation at the common processing time further implies the antagonistic effect of higher pressure. In terms of the common pressure level of 200 MPa, prolonged time from 5 to 15 minutes seems to increase the TPC linearly. On the other hand, the effect of prolonged time on TFC was not apparent since the values registered were near one another with 10 minutes recording the highest value. These observations evidently strengthen the justification that the optimised parameter lies on the lower pressure (200 MPa) with 15 minutes being the optimal time in optimising both TPC and TFC.
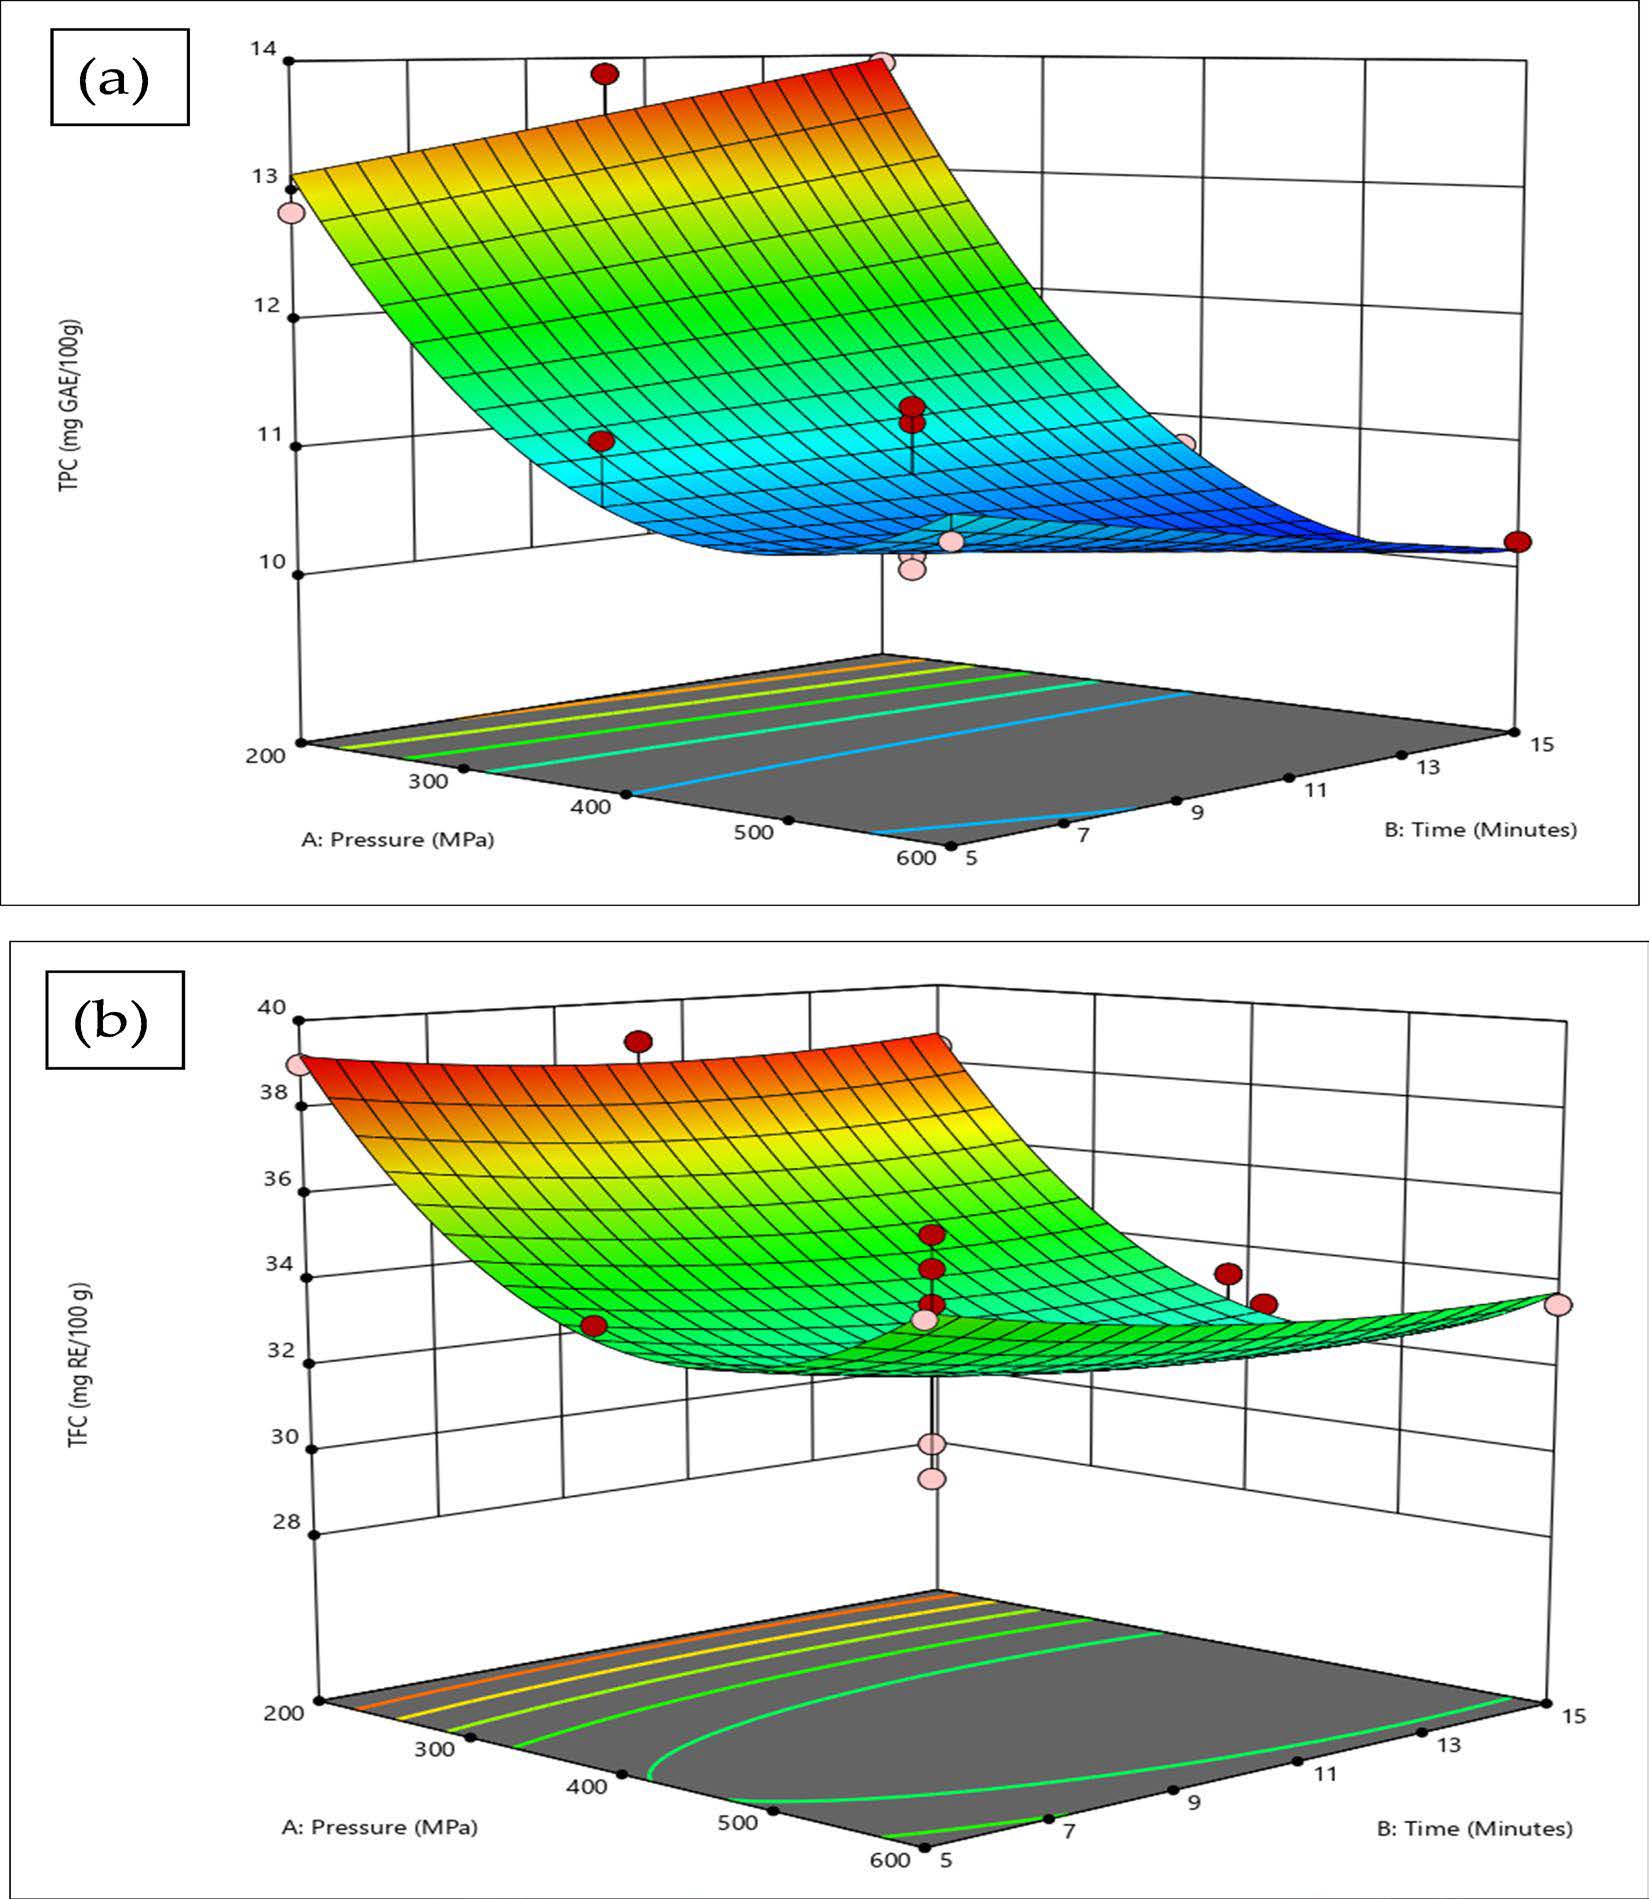
Figure 1 Response surface plots for (a) total phenolic content (TPC), (b) total flavonoid content.
DISCUSSION
The optimised result of 200 MPa/15 min deviated from the expected outcome, as several previous studies have consistently shown that increased pressure typically results in an elevation of TPC. For instance, Fauzi et al. (2013) showed that the TPC of Manuka honey increased by 47.16% at 600 MPa/10 min. Razali (2019a) also demonstrated a similar result: HPP-treated Sarawak honey registered an increase in TPC after processing at 600 MPa/10 min. To put more perspective, Levya-Daniel et al. (2017) also demonstrated that pressurization at 600 MPa from 0 to 15 min for Mexican honey caused a significant (P <0.05) increase of TPC by 5.4%, while after 15 min, TPC increased by 6.2%. The increase in total phenolic content in honey through HPP is attributed to the pressure-mediated degradation of pollen present in the honey mixture (Fauzi et al., 2013). This phenomenon is facilitated by pressure disrupting the cell wall, consequently releasing bound phenolics from the cellular compartments (Navarro-Baez et al., 2022). This effect has been well-documented in fruits and vegetables treated with HPP, and given the plant origin of pollen, a similar pressure-induced release is plausible. While biosynthesis pathways could contribute to the rise in phenolic content during HPP treatment of plant-derived foods, the lack of extensive research on the mechanisms involved necessitates further investigation (Navarro-Baez et al., 2022). However, in the case of honey, where the source is pollen, the mechanism remains virtually unknown, possibly due to the absence of intact cells. Another possible increment mechanism in TPC and TFC would be due to the impact of HPP on the non-covalent bond of polyphenols and protein as well as the association of flavonoids and polyphenols (Levya-Daneil et al., 2017). HPP potentially impacted these interactions, thus releasing some polyphenols. Nonetheless, additional research is imperative to shed light on these mechanisms for a more comprehensive understanding.
The contrasting observation in our finding was not an isolated incident since other food materials processed by HPP also demonstrated a decrease in TPC with increasing pressure. HHP at 500 and 600 MPa was shown significantly (P <0.05) to decrease the phenolic content of L. caerulea berry pulp (Liu et al., 2016). In addition, the Red Delicious apple cube showed that HPP decreased the phenolic compounds, especially in the AC-HPP and AVAC-HPP samples, respectively (Bambace et al., 2021). HPP decreased most phenolic compounds, especially chlorogenic and p-coumaroylquinic acids, in their AC-HPP and AVAC-HPP samples, respectively (Bambace et al., 2021). They assert that pressure-induced cell disruption not only releases bound compounds but also allows cytoplasmic Polyphenol Oxidase (PPO) to come in contact with the phenolic substrate, resulting in a greater oxidation reaction compared to the release of bound phenolics (Bambace et al., 2021). However, this theory does not apply to honey in general, as honey lacks polyphenol oxidase. In fact, honey acts as a noncompetitive inhibitor of PPO (Ates, Pekyardimci and Cokmus, 2001). Additionally, enzymatic activity in stingless bee honey is deficient; therefore, any enzyme-mediated process causing a decrement in phenolic content in Kelulut honey is improbable. Since the process was conducted at ambient temperature (kept at 22°C), it would not impose a significant impact that could alter the TPC and TFC. Therefore, the possible variables that could cause such observation would probably be pressure and the inherent properties of KH. In general, honey has a complex matrix of myriad compounds. During HPP, these compounds are bound to interact, potentially affecting the stability and bioavailability of phenolic compounds. Moreover, higher pressure could induce chemical reactions that render phenolic compounds to be conjugated, making it less available for chemical testing, like using the Folin-ciocaltue. A study on phenolic profile of cloudy hawthorn berry (Crataegus pinnatifida) juice by Lou and colleagues (2022) discussed that the decrement in individual phenolic acid (hydroxybenzoic acids of gallic acid, protocatechuic acid, vanillic acid, and hydroxycinnamic acids of caffeic acid, p-coumaric acid) post-HPP could be attributed to the processing-induced conversion. For instance, through transformation reaction, p-coumaric acid and caffeic acid transformed into chlorogenic acid with quinic acid (Rashmi and Negi, 2020). Hence, the changes in the concentration of the individual phenolic acid present could potentially affect the results of TPC and TFC. However, further studies are needed to elucidate the mechanisms behind the decrease in Total Phenolic Content (TPC) and Total Flavonoid Content (TFC) in Kelulut honey post-HPP.
Nonetheless, the optimisation model generated for KH’s HPP was adequate and reliable. A verification step was done where a total of 15 solutions was generated, and the first solution with a desirability of 0.986 was determined to be at 200 MPa, 15 minutes. The confirmation results registered a value of 15.2787 ± 0.525 mg GAE/100 g for TPC and 38.2741 ± 1.98005 mg RE/100 g (TFC), close to the predicted values. The desirability of 0.986 also indicates the accurate precision of the quadratic model. It can be concluded that the best optimisation condition for HPP that results in optimal TPC and TFC was at 200 MPa with 15 minutes of processing time. This optimised parameter offered valuable insight into the practical application of HPP for KH in the industry. A pressure of 200 MPa is plausible as it is within the moderate pressure range for HPP and is feasible in terms of its scalability for commercial KH processing. In addition, it causes less energy consumption and pressure built-up time than higher pressure (>500 MPa), which leads to lower operational costs.
Despite HPP being a relatively expensive technology, it carries moderate operating cost when ratio-ed per kilogram of product output (Martin, 2016). A kilogram of retail-ready product can be around €0.21 and €0.80 (Martin,2016). A further reduction in capital and operating costs is projected as the demand for HPP equipment grows (Hernando Sáiz et al., 2008). Regarding energy performance, HPP carries lower consumption (640 kJ/L) than conventional thermal treatment (910 kJ/L) at 45% boiler efficiency (Atuonwu and Tassou, 2018). Theoretical modelling by several studies implied that HPP’s energy performance improves with scale and vessel fill ratio (Atuonwu and Tassou, 2018). Hence, this optimised parameter would seamlessly integrate into any existing HPP protocol as it is still within the capabilities of commercial HPP equipment. With the goal of maximising TPC and TFC, the determined parameter of 200 MPa/15 min can be considered practical and sustainable, catering to the crucial issues of quality preservation, technical feasibility, efficient energy, and cost consumption.
CONCLUSION
In conclusion, this study managed to optimise the TPC and TFC via HPP. Contrary to the common consensus, 200 MPa/15 minutes was deduced as the optimal condition for HPP of KH. The discrepancy was potentially contributed by the inherent attributes of KH that reacted to the enhanced biochemical reaction during the HPP (especially at 500 MPa and above). Certain phenolic compounds underwent a processing-induced transformation that rendered them conjugated, reducing viability. The generated quadratic model accurately predicted optimal conditions at 200 MPa for 15 minutes, leading to maximum TPC and TFC. Compared to thermal processing parameters commonly practiced conventionally (65 – 70 °C, 10 minutes), the optimised HPP parameters were relatively similar, but it offers more advantages at preserving thermolabile compounds. The finding in a way provides an avenue for the production of high-quality KH with preserved bioactive compounds. Moreover, a pressure as low as 200 MPa contributes to efficient energy consumption, operational cost, environmental impact, and thus, a more efficient industrial practice. Some limitations that would arise from this determined optimal parameter would be regulatory compliance and food safety concerns, as a pressure of 200 MPa might not be sufficient to demolish microorganisms. However, KH has natural antibacterial properties and attributes that are inconducive for microbes to sustain life. It is also vital to note that while the optimised parameter deduced from this study is applicable for the particular KH used, a slight deviation in outcome is possible as influenced by the natural variation in its inherent properties that are heavily influenced by its origin. Nevertheless, the results contribute to the growing body of evidence supporting the efficacy of HPP for preserving the bioactive properties of honey and other natural food products. This unique finding emphasizes the need for tailored approaches in KH processing under high-pressure conditions, providing valuable insights for both the industry and research communities.
ACKNOWLEDGEMENTS
The first author expresses gratitude to the Ministry of Higher Education of Malaysia for the Fundamental Research Grant Scheme (FRGS) K302 (ID 19019; FRGS/1/2020/TK0/UTHM/02/21). Appreciation is also extended to the personnel of the Department of Chemical Engineering Technology, Faculty of Engineering Technology, for their valuable technical assistance.
AUTHOR CONTRIBUTIONS
Muhammad Faiz Razali: Conceptualization, methodology, formal analysis, investigation, data curation, writing—original draft preparation, writing—review and editing. Noor Akhmazillah Fauzi: Conceptualization, Methodology, validation, resources, writing—review and editing, supervision, project administration, funding acquisition. Balkis A. Talip.: Resources, supervision, and Writing-review. Noranizan Mohd Adzahan: Resources, supervision, and Writing-review. Alifdalino Sulaiman: writing—review, editing and supervision. Azeman Samiun: Resources.
CONFLICT OF INTEREST
The authors declare that they hold no competing interests.
REFERENCES
Ates, S., Pekyardimci, S., and Cokmus, C. 2001. Partial characterization of a peptide from honey that inhibits mushroom polyphenol oxidase. Journal of Food Biochemistry. 25: 127-137.
Atuonwu, J. C., and Tassou, S. A. 2018. Model-based energy performance analysis of high pressure processing systems. Innovative Food Science & Emerging Technologies. 47: 214-224.
Bambace, M. F., del Rosario Moreira, M., Sánchez‐Moreno, C., and De Ancos, B. 2021. Effects of combined application of high‐pressure processing and active coatings on phenolic compounds and microbiological and physicochemical quality of apple cubes. Journal of the Science of Food and Agriculture. 101: 4256-4265.
Chaikham, P., and Prangthip, P. 2015. Alteration of antioxidative properties of longan flower-honey after high pressure, ultra-sonic and thermal processing. Food Bioscience. 10:1-7.
Chaikham, P., and Baipong, S. 2016. Comparative effects of high hydrostatic pressure and thermal processing on physicochemical properties and bioactive components of Mao Luang (Antidesma bunius Linn.) juice. Chiang Mai Journal of Science. 43: 851-862.
Chua, L. S., Rahaman, N. L. A., Adnan, N. A., and Eddie Tan, T. T. 2013. Antioxidant activity of three honey samples in relation with their biochemical components. Journal of Analytical Methods in Chemistry. 2013: 313798.
Considine, K. M., Kelly, A. L., Fitzgerald, G. F., Hill, C., and Sleator, R. D. 2008. High-pressure processing–effects on microbial food safety and food quality. FEMS Microbiology Letters. 281:1-9.
Diez-Sánchez, E., Martínez, A., Rodrigo, D., Quiles, A., and Hernando, I. 2020. Optimizing high pressure processing parameters to produce milkshakes using chokeberry pomace. Foods. 9: 405.
Fauzi, N. A., Farid, M. M., and Silva, F. V. 2014. High-pressure processing of manuka honey: Improvement of antioxidant activity, preservation of colour and flow behaviour. Food and Bioprocess Technology. 7: 2299-2307.
Fauzi, N. A., and Farid, M. M. 2017. High pressure processed Manuka honey: Change in nutritional and rheological properties over 1‐year storage. Journal of Food Processing and Preservation. 41: e13085.
Fauzi, N.A., Farid, M. M., and Silva, F. V. M. 2013. High pressure processing (HPP) of honey for the improvement of nutritional value. Innovative Food Science & Emerging Technologies. 20: 59-63.
Fauzi, N. A., and Farid, M. M. 2015. High‐pressure processing of Manuka honey: brown pigment formation, improvement of antibacterial activity and hydroxymethylfurfural content. International Journal of Food Science & Technology. 50: 178-185.
Fortuna, D., Darmawati, E., Sunarti, T.C., Mardjan, S.S., Widayanti, S.M., Yuliana, N.D., and Purwanti, N. 2024. Response surface methodology for optimization of mucilage extraction from Dioscorea alata tuber. Natural and Life Sciences Communications. 23(2): e2024019.
Hazirah, H., Yasmin, A. M., and Norwahidah, A. 2019. Antioxidant properties of stingless bee honey and its effect on the viability of lymphoblastoid cell line. Medicine and Health. 14, 91-105.
Hernando Saiz, A., Tarrago Mingo, S., Purroy Balda, F. P., and Tonello Samson, C. 2008. Advances in design for successful commercial high pressure food processing. Food Australia. 60: 154-156.
Houška, M., Silva, F. V. M., Evelyn, Buckow, R., Terefe, N. S., and Tonello, C. 2022. High pressure processing applications in plant foods. Foods. 11: 223.
Inanoglu, S., Barbosa-Cánovas, G. V., Sablani, S. S., Zhu, M. J., Keener, L., and Tang, J. 2022. High-pressure pasteurization of low-acid chilled ready-to-eat food. Comprehensive Reviews in Food Science and Food Safety. 21: 4939–4970.
Khalil, M. I., Alam, N., Moniruzzaman, M., Sulaiman, S. A., and Gan, S. H. 2011. Phenolic acid composition and antioxidant properties of Malaysian honeys. Journal of Food Science. 76: 921-928.
Leyva-Daniel, D. E., Escobedo-Avellaneda, Z., Villalobos-Castillejos, F., Alamilla-Beltrán, L., and Welti-Chanes, J. 2017. Effect of high hydrostatic pressure applied to a Mexican honey to increase its microbiological and functional quality. Food and Bioproducts Processing. 102: 299-306.
Liu, S., Xu, Q., Li, X., Wang, Y., Zhu, J., Ning, C., Chang, X. and Meng, X. 2016. Effects of high hydrostatic pressure on physicochemical properties, enzymes activity, and antioxidant capacities of anthocyanins extracts of wild Lonicera caerulea berry. Innovative Food Science and Emerging Technologies. 36: 48-58.
Luo, W., Tappi, S., Wang, C., Yu, Y., Zhu, S., and Rocculi, P. 2018. Study and optimisation of high hydrostatic pressure (HHP) to improve mass transfer and quality characteristics of candied green plums (Prunus mume). Journal of Food Processing and Preservation. 42: e13769.
Lou, X., Xiong, J., Tian, H., Yu, H., Chen, C., Huang, J., Yuan, H., Hanna, M., Yuan, L. and Xu, H. 2022. Effect of high-pressure processing on the bioaccessibility of phenolic compounds from cloudy hawthorn berry (Crataegus pinnatifida) juice. Journal of Food Composition and Analysis. 110: 104540.
Maringgal, B., Hashim, N., Tawakkal, I. S. M. A., Mohamed, M. T. M., and Shukor, N. I. A. 2019. Phytochemical compositions and antioxidant activities of Malaysian stingless bee honey. Pertanika Journal of Science and Technology. 27: 15-28.
Martin, J. L. 2016. Technical and economic feasibility of high-pressure processing on charcuterie foods. Cahiers de l'IFIP. 3: 25-43.
Mustafa, M. Z., Yaacob, N. S., and Sulaiman, S. A. 2018. Reinventing the honey industry: Opportunities of the stingless bee. The Malaysian Journal of Medical Sciences. 25(4): 1-5.
Navarro-Baez, J. E., Martínez, L. M., Welti-Chanes, J., Buitimea-Cantúa, G. V., and Escobedo-Avellaneda, Z. 2022. High hydrostatic pressure to increase the biosynthesis and extraction of phenolic compounds in food: A review. Molecules. 27: 1502.
Nayik, G. A., and Nanda, V. 2016. Effect of thermal treatment and pH on antioxidant activity of saffron honey using response surface methodology. Journal of Food Measurement and Characterization. 10: 64-70.
Nayik, G. A., Dar, B. N., and Nanda, V. 2016. Optimization of the process parameters to establish the quality attributes of DPPH radical scavenging activity, total phenolic content, and total flavonoid content of apple (Malus domestica) honey using response surface methodology. International Journal of Food Properties. 19(8): 1738-1748.
Penchalaraju, M., and Shireesha, B. 2013. Preservation of foods by high-pressure processing-a review. Indian Scientific Journal of Research and Technology. 1: 30-38.
Rashmi, H.B., Negi, P.S. 2020. Phenolic acids from vegetables: A review on processing stability and health benefits. Food Research International. 136: 109298.
Razali, M. F., Narayanan, S., Md. Hazmi, N. A., Abdul Karim Shah, N. N., Mustapa Kamal, S. M., Mohd Fauzi, N. A., and Sulaiman, A. 2021. Minimal processing for goat milk preservation: Effect of high‐pressure processing on its quality. Journal of Food Processing and Preservation. 45: e15590.
Razali, M. F., Mohd Fauzi, N. A., Sulaiman, A., Talip, B. A., and Rahman, A. A. 2019a. Effect of high‐pressure processing on prebiotic potential of stingless bee (Kelulut) honey: Tested upon Lactobacillus acidophilus and Lactobacillus brevis. Journal of Food Processing and Preservation. 43: e13946.
Razali, M. F., Fauzi, N. A. M., Sulaiman, A., and Rahman, N. A. A. 2019b. Effect of high-pressure processing (hpp) on antioxidant, diastase activity and colour for Kelulut (stingless bee) honey. Jurnal Teknologi. 81: 91-98.
Ranneh, Y., Ali, F., Zarei, M., Akim, A. M., Abd Hamid, H., and Khazaai, H. 2018. Malaysian stingless bee and Tualang honeys: A comparative characterization of total antioxidant capacity and phenolic profile using liquid chromatography-mass spectrometry. LWT. 89: 1-9.
Saepang, K., Pitaksuteepong, T., Buranrat, B., and Boontha, S. 2024. Optimization of HPMC-based oral fast dissolving film of cetirizine dihydrochloride. Natural and Life Sciences Communications. 23(1): e2024007.
Singleton, V. L., Orthofer, R., and Lamuela-Raventós, R. M. 1999. Analysis of total phenols and other oxidation substrates and antioxidants by means of Folin-Ciocalteu reagent. Methods in Enzymology. 299: 152-178.
Song, Q., Li, R., Song, X., Clausen, M. P., Orlien, V., and Giacalone, D. 2022. The effect of high-pressure processing on sensory quality and consumer acceptability of fruit juices and smoothies: A review. Food Research International. 157: 111250.
Thaisungnoen, K., Umar, M., Singh, M., and Anal, A. K. 2024. Ultrasonic-assisted extraction of bioactive extract from Napier grass (Pennisetum purpureum), evaluation of its bioactivity, antimutagenicity and cytotoxicity. Natural and Life Sciences Communications. 23(1): e2024014.
Wang, C., Yin, H., Zhao, Y., Zheng, Y., Xu, X., and Yue, J. 2021. Optimisation of high hydrostatic pressure treatments on soybean protein isolate to improve its functionality and evaluation of its application in yogurt. Foods. 10: 667.
OPEN access freely available online
Natural and Life Sciences Communications
Chiang Mai University, Thailand. https://cmuj.cmu.ac.th
Muhammad Faiz Razali1, Balkis A.Talip2, Noranizan Mohd Adzahan3, Alifdalino Sulaiman4, Azeman Samiun5, and Noor Akhmazillah Mohd Fauzi1, *
1 Department of Chemical Engineering Technology, Faculty of Engineering Technology, Universiti Tun Hussein Onn Malaysia (UTHM), Pagoh Education Hub, KM1, Jalan Panchor, 86400, Panchor Muar, Johor, Malaysia.
2 Faculty of Applied Sciences and Technology, Universiti Tun Hussein Onn Malaysia, Pagoh Higher Education Hub, KM 1, Jalan Panchor, 84600, Panchor Muar, Johor.
3 Faculty of Food Science and Technology, Universiti Putra Malaysia, Serdang, Malaysia.
4 Department of Process and Food Engineering, Faculty of Engineering, Universiti Putra Malaysia, Serdang, Malaysia.
5 D’Butik Semanis Madu Enterprise, No. 49, Kampung Telosan, 16800 Pasir Putih, Kelantan.
Corresponding author: Noor Akhmazillah Mohd Fauzi, E-mail: akhma@uthm.edu.my
Total Article Views
Editor: Sirasit Srinuanpan,
Chiang Mai University, Thailand
Article history:
Received: February 22, 2024;
Revised: April 28, 2024;
Accepted: May 3, 2024;
Online First: May 20, 2024