 ISSN: 2822-0838 Online

Impact of Overjet Severity and Skeletal Divergence on the Perioral Soft Tissue Area
Kulnipa Punyanirun and Chairat Charoemratrote*Published Date : May 16, 2024
DOI : https://doi.org/10.12982/NLSC.2024.032
Journal Issues : Number 3, July-September 2024
Abstract Overjet (OJ) and skeletal divergence affect the perioral soft tissue. However, no previous study has investigated the combined effects on perioral soft tissue, which includes the upper lip (UL), lower lip (LL), and chin projection. We explored the impact of OJ severity and skeletal divergence on the perioral soft tissue. Lateral cephalograms of 133 untreated skeletal Class II adult patients were allocated into three categories according to the degree of skeletal divergence: hypodivergence (Hypo), normodivergence (Normo), and hyperdivergence (Hyper). Furthermore, OJ was classified as normal OJ (NOJ), moderately excessive OJ (MEOJ), and severely excessive OJ (SEOJ). A matrix of skeletal divergence and OJ variables produced the following groups: NOJ-Hypo, MEOJ-Hypo, SEOJ-Hypo, NOJ-Normo, MEOJ-Normo, SEOJ-Normo, NOJ-Hyper, MEOJ-Hyper, and SEOJ-Hyper. The skeletal, dental, and soft tissue parameters were measured. Statistical analyses showed that increased hyperdivergence and OJ severity corresponded with a more retruded mandibular perioral soft tissue (MPST), except for the Pog’ in the SEOJ-Hypo group, which was insignificantly more prominent than the MEOJ-Hypo group. Unlike the LL, the UL was similar among the groups. Multiple regression indicated that greater OJ and skeletal divergence significantly influenced MPST retrusion and increased vermilion lower lip thickness (VLLT) while independently affecting deeper mentolabial sulcus depth (MSD) and a more obtuse lip-chin-throat angle (P < 0.05). The effect of OJ was most significant at the LL and gradually decreased down to the chin; conversely, divergence increased downwards. The SEOJ-Hyper group displayed the greatest retruded MPST, thickest VLLT, and deepest MSD, which highlighted the combined effect of OJ and divergence.
Keywords: Excessive overjet, Skeletal divergence, Mandibular perioral soft tissue, Skeletal Class II
Funding: This study was funded by the Graduate School of Faculty of Dentistry, Prince of Songkla University.
Citation: Punyanirun, K. and Charoemratrote, C. 2024. Impact of overjet severity and skeletal divergence on the perioral soft tissue area. Natural and Life Sciences Communications. 23(3): e2024032.
INTRODUCTION
Lip protrusion is frequently considered a primary concern in orthodontic treatment, particularly among patients with bimaxillary protrusion and Class II division 1 malocclusion. These patients typically exhibit pronounced upper lip (UL) and lower lip (LL) protrusion that negatively affect their facial profile. There is evidence that excessive overjet (EOJ) impacts the facial soft tissue, particularly in the lower facial height area (Krooks, 2018). Studies have shown that protruded LL positioning >2 mm beyond the H-line is associated with protrusive incisors and EOJ (Holdaway, 1983). Although a significant relationship between large OJ and the facial profile has been noted (Bittner and Pancherz, 1990), the results are inconsistent. The facial characteristics only had a moderate correlation to severe positive OJ. Furthermore, soft tissue profile measurements provided a limited prediction of the OJ variability (Kanavakis et al., 2019).
Skeletal divergence is another factor that influences the lower facial height soft tissue (Lee et al., 2015). Patients with hyperdivergent skeletal patterns typically have less chin prominence (Perović et al., 2022). These individuals often have thinner soft tissues at specific facial points, including Pg’ (Kumar et al., 2022), Me’ (Macari and Hanna, 2014), Gn’ (Macari and Hanna, 2014), upper lip thickness (Kumar et al., 2022), and lower lip thickness (Kumar et al., 2022). However, the thickness of the soft tissue at Pg’ appeared to vary insignificantly in different skeletal divergent patterns (Macari and Hanna, 2014). Class II patients with hyperdivergence tend to have the thickest basic lower lip thickness (BLLT) and lower lip length, possibly as a compensatory mechanism for the steep mandibular plane (Lee et al., 2015). Nevertheless, most of the previous investigations focused on the thickness of the chin area, but not so much on the sagittal projection of the structures.
While the relationships between OJ, skeletal divergence, and facial profiles have been explored, studies on this topic have yielded mixed results. Some research found a link between the severity of OJ and a hyperdivergent pattern in growing patients, which suggested that vertical facial dimensions could influence lip protrusion. However, they did not explore the soft tissue parameters (Saltaji et al., 2011). In contrast, other studies found no significant correlation, which suggests that other factors might be more crucial in determining lip protrusion (Bhateja et al., 2015). Most previous research focused on hard tissue measurements with limited data on soft tissue characteristics in these patients. Our study aimed to fill this gap by examining the combined impact of various degrees of OJ severity and skeletal divergence on the perioral soft tissue area.
MATERIALS AND METHODS
The G*Power program version 3.1 was used to calculate the sample size based on a prior study (Lee et al., 2015) that investigated perioral soft tissue in Class II division 1 patients with different skeletal divergence. The mean and standard deviation (SD) values of the LL to the H-line, which represented LL protrusion in their study, were used to calculate the minimum number of participants required to observe a significant difference (α = 0.05, β = 0.2). The calculation indicated that a minimum of 126 patients were needed. The minimum number was increased by 10% to allow for any radiographs that met the exclusion criteria. The research protocol received approval from the ethics committee of the Faculty of Dentistry at Prince of Songkla University (EC6408-057). Informed consent was obtained during the visits where treatment plans were discussed. Lateral cephalometric radiographs of all patients were taken at the Faculty of Dentistry at Prince of Songkla University between 2015 and 2017. The selection criteria were skeletal Class II malocclusion (ANB ≥5, OJ ≥2 mm), age ≥18 years at the time of the radiograph, and a cervical vertebral maturation stage ≥5 to limit the samples to non-growing patients (McNamara and Franchi, 2018; Upalananda et al., 2024). Patients with no craniofacial abnormalities and no history of head or neck surgery were included. Radiographs excluded from the study had indistinct landmarks or significant restorations on the incisors. Ultimately, 133 radiographs met the criteria and were incorporated into the study.
Radiographs were sorted based on the initial OJ of the patients: normal OJ (NOJ) that ranged 2-4 mm, moderately excessive OJ (MEOJ) between >4 and 6 mm, and severely excessive OJ (SEOJ) exceeding 6 mm (Saltaji et al., 2011). Skeletal divergence (Nuntasukkasame et al., 2012) was categorized as hypodivergence (Hypo, mandibular plane angle [MPA] ≤21°), normodivergence (Normo, MPA >21-30°), and hyperdivergence (Hyper, MPA >30°). Therefore, nine groups were designated as follows: NOJ-Hypo, MEOJ-Hypo, SEOJ-Hypo, NOJ-Normo, MEOJ-Normo, SEOJ-Normo, NOJ-Hyper, MEOJ-Hyper, and SEOJ-Hyper (Figure 1). The lateral cephalograms were digitized and analyzed using Dolphin Imaging software version 11.9 and ImageJ (Schneider et al., 2012) by the primary investigator (KP) who was calibrated with an expert (CC). The skeletal, dental, and soft tissue parameters were evaluated. The soft tissue landmarks and reference planes are shown in Figure 2. Ls-SnTVP, Li-SnTVP, Si-SnTVP, and Pg’-SnTVP were measured as the distance from the landmarks to SnTVP parallel to SnTVP. The lip thickness measurements (Lee et al., 2015) were as follows: basic upper lip thickness (BULT), vermilion upper lip thickness (VULT), basic lower lip thickness (BLLT), and vermilion lower lip thickness (VLLT).
The study calculated the intraclass correlation coefficient (ICC) by reanalyzing 30 randomly selected lateral cephalograms one month after their initial assessment. Dahlberg’s formula was utilized to ascertain the measurement errors. The mean and SD values were employed to depict each subject's cephalometric data. Shapiro-Wilk tests were carried out to assess the normality of the data followed by the selection of non-parametric methods for statistical analysis. The Kruskal-Wallis test was applied to compare parameters across different groups. Spearman's rho was used to indicate correlations between the parameters, and multiple linear regression was examined. These statistical evaluations were performed using the Statistical Package for the Social Sciences version 26 (IBM Corp., Armonk, NY, USA). The level of significance was set at P < 0.05.
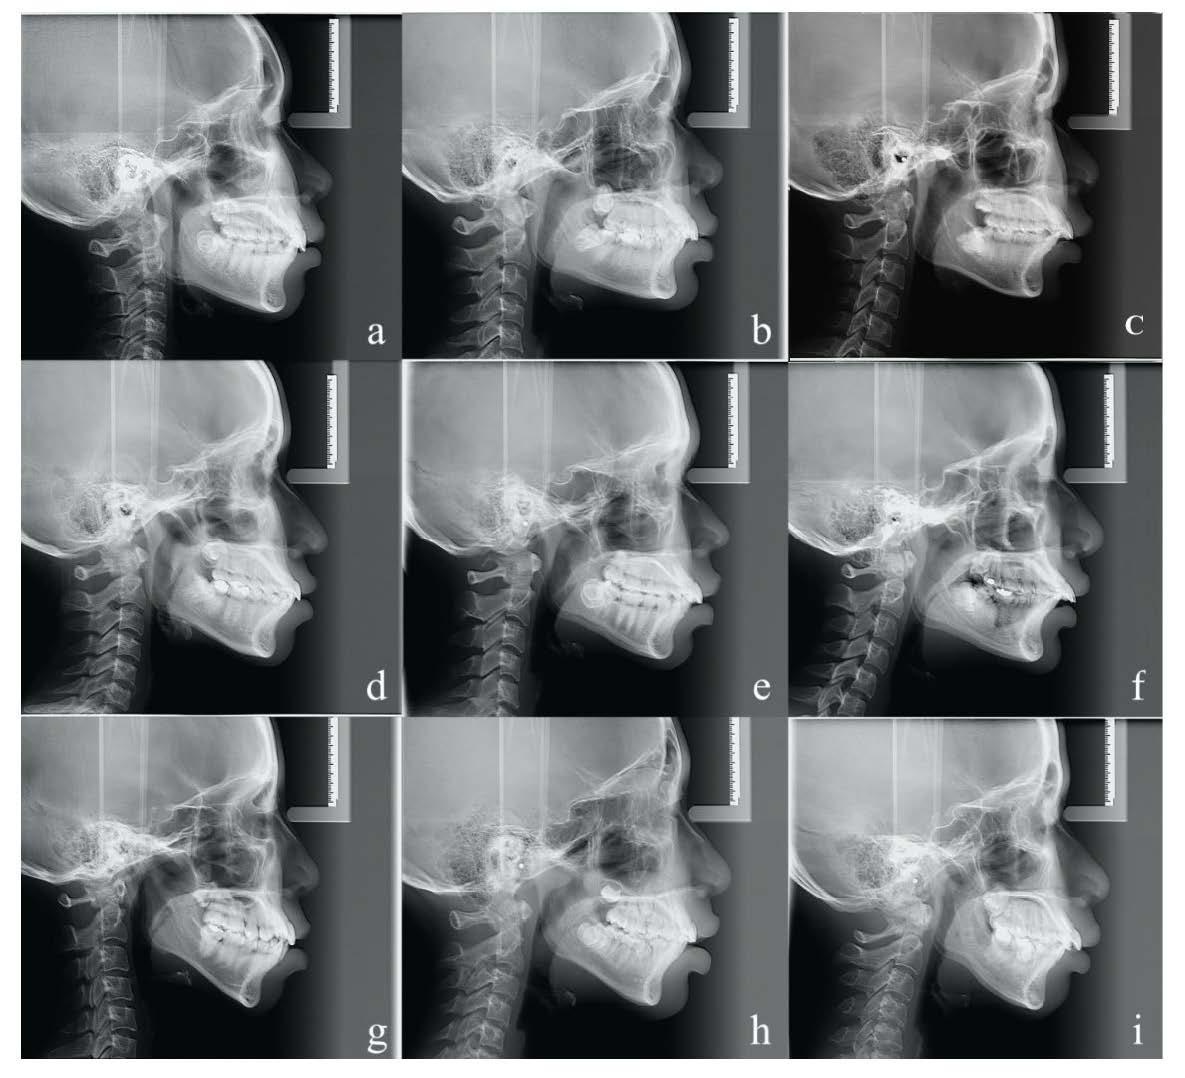
Figure 1. Examples of lateral cephalometric radiographs from each group. (a) Normal overjet with hypodivergence (NOJ-Hypo). (b) Moderately excessive overjet with hypodivergence (MEOJ-Hypo). (c) Severely excessive overjet with hypodivergence (SEOJ-Hypo). (d) Normal overjet with normodivergence (NOJ-Normo). (e) Moderately excessive overjet with normodivergence (MEOJ-Normo). (f) Severely excessive overjet with normodivergence (SEOJ-Normo). (g) Normal overjet with hyperdivergence (NOJ-Hyper). (h) Moderately excessive overjet with hyperdivergence (MEOJ-Hyper). (i) Severely excessive overjet with hyperdivergence (SEOJ-Hyper).
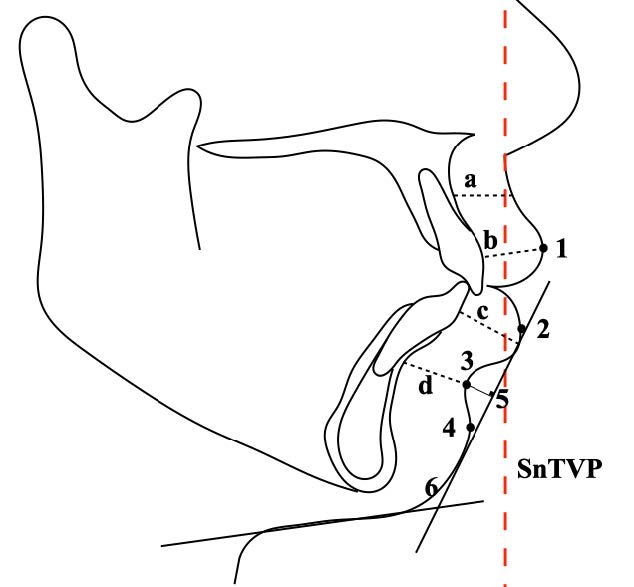
Figure 2. Soft tissue landmarks, parameters, and reference planes. Landmarks: (1) Labrale superior (Ls) the most anterior point on the convexity of the upper lip. (2) Labrale inferior (Li) the most anterior point on the convexity of the lower lip. (3) Sulcus inferior (Si) the most concave point located between Li and soft tissue pogonion. (4) Soft tissue pogonion (Pg’) the most anterior point on the soft tissue chin. Measurements: (5) Mentolabial sulcus depth (MSD, mm) the perpendicular distance from the deepest curvature between the soft tissue area of Li to Pg’ to the Li-Pg’ line. (6) Lip-chin-throat-angle (LCTA). (a) Basic upper lip thickness (BULT) (mm). (b) Vermillion upper lip thickness (VULT) (mm). (c) Basic lower lip thickness (BLLT) (mm). (d) Vermillion lower lip thickness (VLLT) (mm) (Lee et al., 2015). SnTVP is the Sn-true vertical plane that is parallel to the anterior surface of the lateral cephalometric radiograph, constructed through the subnasale.
RESULTS
Patient characteristics
Table 1 summarizes the demographics of the study population. A comparison of the parameters among the groups is shown in Table 2. The mean ICC for all variables was found to be 0.89 and the values ranged from 0.86 to 0.92, which suggested good to excellent reliability. The measurement errors calculated using Dahlberg's formula for linear and angular measurements were 0.25 mm and 0.81 degrees, respectively.
MPA and OJ were significantly different among the groups because these two variables were used to classify the subjects. However, all other skeletal parameters were similar in all groups. The soft tissue of the UL area was similar in all groups. The mandibular perioral soft tissue (MPST) showed significant differences between the groups (Table 2).
Table 1. Demographic data of groups with normal OJ (NOJ), moderately excessive OJ (MEOJ), and severely excessive OJ (SEOJ) and skeletal hypodivergence (Hypo), normodivergence (Normo), and hyperdivergence (Hyper).
|
Hypo (n = 38) |
Normo (n = 57) |
Hyper (n = 38) |
||||||||||||||||||
|
Subject’s |
NOJ |
MEOJ |
SEOJ |
NOJ |
MEOJ |
SEOJ |
NOJ |
MEOJ |
SEOJ |
|||||||||||
|
n (%) |
13 (10%) |
12 (9%) |
13 (10%) |
28 (21%) |
11 (8.27%) |
18 (13.53%) |
15 (11.28%) |
12 (9%) |
11 (8.27%) |
|
||||||||||
|
Mean age ± SD |
22.33 ± 1.53 |
23.25 ± 0.96 |
23.60 ± 1.82 |
23.31 ± 4.25 |
23.83 ± 4.67 |
21.50 ± 3.00 |
23.67 ± 1.53 |
21.50 ± 4.95 |
23.67 ± 3.88 |
|
||||||||||
|
Sex Female Male |
10 3 |
7 5 |
10 3 |
18 10 |
9 2 |
15 3 |
13 2 |
9 3 |
9 3 |
|
||||||||||
SD, standard deviation.
OJ severity with the same skeletal divergence
Overbite (OB) tended to be deeper as the upper incisors (UIs) were more proclined and protruded, and the MPST was more backward as the OJ increased in all divergence categories with significant differences observed among some OJ subgroups.
In the Hypo group, the OJ, UI-NA (°), and UI-NA (mm) were significantly higher in the SEOJ-Hypo group compared to the NOJ-Hypo group. Additionally, OB was significantly deeper in the MEOJ-Hypo and SEOJ-Hypo groups than in the NOJ-Hypo group. Also, the UIs in the SEOJ-Hypo group were significantly more proclined and protruded than in the NOJ-Hypo group (P < 0.05). Perioral soft tissue measurements were similar across all degrees of OJ severity in the Hypo group. However, a trend was noted towards a more retruded MPST as OJ increased, which was evidenced by decreasing values in linear measurements such as Li-SnTVP, Si-SnTVP, and mentolabial sulcus depth (MSD). In particular, the SEOJ-Hypo group displayed a more pronounced forward chin position than the MEOJ-Hypo group.
In the Normo group, a similar pattern emerged with OJ and OB being significantly greater in the SEOJ-Normo group compared to the NOJ-Normo group. In the SEOJ-Normo group, the UI-NA (°) exhibited a significant proclination compared to the NOJ-Normo group. Furthermore, the SEOJ-Normo group exhibited a significantly more posterior positioning of Li-SnTVP than the NOJ-Normo group (P < 0.05).
Within the Hyper category, the significant difference was in OJ and Pg’-SnTVP, in which the OJ was greater and the Pg’-SnTVP was more posterior in the SEOJ-Hyper group compared to the NOJ-Hyper group (P < 0.05). Meanwhile, the increasing OJ in the Hyper category was accompanied by a progressive, although not statistically significant, increase in the VLLT
(Table 2).
Skeletal divergence with the same OJ severity
As divergence tended to increase toward hyperdivergence, the LI showed more protrusion, and the MPST became more retruded. In the NOJ classification, dental parameters were largely consistent, except for the LI-NB (mm). Here, the NOJ-Hyper group showed significantly more protrusion than the NOJ-Hypo group. Additionally, the LCTA was significantly more obtuse in the NOJ-Hyper group than in the NOJ-Hypo group. Soft tissue parameters also varied with Si-SnTVP and Pg’-SnTVP being more retruded in the NOJ-Hyper group than in the NOJ-Hypo group, with a significant difference observed in the Pg’-SnTVP values (P < 0.05).
Table 2. Results of skeletal, dental, and soft tissue parameters among groups with normal OJ (NOJ), moderately excessive OJ (MEOJ), and severely excessive OJ (SEOJ) and skeletal hypodivergence (Hypo), normodivergence (Normo), and hyperdivergence (Hyper).
|
Parameters |
Hypo (n = 38) |
Normo (n = 57) |
Hyper (n = 38) |
||||||
|
NOJ (n = 13) |
MEOJ (n = 12) |
SEOJ (n = 13) |
NOJ (n = 28) |
MEOJ (n = 11) |
SEOJ (n = 18) |
NOJ (n = 15) |
MEOJ (n = 12) |
SEOJ (n = 11) |
|
|
Skeletal parameter |
|||||||||
|
SNA (°) |
86.57 ± |
85.08 ± |
84.32 ± |
85.25 ± |
85.88 ± |
86.04 ± |
84.20 ± |
83.03 ± |
85.38 ± |
|
SNB (°) |
80.92 ± |
79.08 ± |
78.47 ± |
79.04 ± |
79.51 ± |
79.07 ± |
77.67 ± |
77.46 ± |
78.25 ± |
|
ANB (°) |
5.65 ± |
5.66 ± |
5.86 ± |
6.21 ± |
6.37 ± |
6.93 ± |
6.53 ± |
5.57 ± |
7.13 ± |
|
MPA (°)* |
18.75 ± |
19.42 ± |
18.77 ± |
26.60 ± |
25.77 ± |
26.34 ± |
33.08 ± |
35.13 ± |
34.52 ± |
|
Dental parameter |
|||||||||
|
OJ (mm)* |
2.91 ± |
5.56 ± |
7.70 ± |
2.88 ± |
5.10 ± |
8.02 ± |
2.60 ± |
5.25 ± |
8.28 ± 1.21b |
|
OB (mm)* |
1.98 ± |
3.73 ± |
3.97 ± |
1.66 ± |
2.27 ± 2.09abcd |
3.08 ± |
1.93 ± |
2.47 ± 2.04abcd |
2.73 ± 2.35abcd |
|
UI-NA (°)* |
25.55 ± |
30.32 ± |
34.76 ± |
24.55 ± |
30.11 ± |
31.42 ± 9.53bc |
25.00 ± |
30.00 ± |
28.59 ± 9.36ab |
|
UI-NA (mm)* |
5.59 ± |
7.94 ± |
9.25 ± |
5.57 ± |
8.20 ± |
7.91 ± |
6.67 ± |
7.54 ± |
9.08 ± 3.39bc |
|
LI-NB (°)* |
36.24 ± |
35.29 ± |
31.53 ± |
38.21 ± |
36.32 ± |
33.91 ± |
38.30 ± |
35.78 ± |
38.00 ± |
|
LI-NB (mm)* |
8.55 ± |
9.26 ± |
7.50 ± |
10.71 ± 2.12abc |
11.30 ± |
9.14 ± |
12.17 ± 2.05ab |
9.65 ± |
11.04 ± 1.47abc |
|
Soft tissue parameter |
|||||||||
|
FCA (°) |
11.14 ± |
12.97 ± |
12.87 ± |
12.57 ± |
12.79 ± |
14.89 ± |
14.86 ± |
12.79 ± 5.77 |
17.81 ± |
|
NLA (°) |
92.21 ± |
90.27 ± |
86.47 ± |
88.47 ± |
83.65 ± |
87.42 ± |
93.43 ± |
92.97 ± |
86.82 ± |
|
LCTA (°)* |
111.89 ± 6.57ac |
117.96 ± 6.31abc |
111.72 ± 4.99ac |
117.18 ± 5.42abc |
120.46 ± |
115.09 ± 6.30ac |
123.10 ± |
120.18 ± 5.79abc |
120.07 ± 6.76abc |
|
BULT (mm) |
11.42 ± |
12.75 ±
|
12.17 ± |
11.36 ± |
12.00 ± |
11.64 ± |
11.73 ± |
12.58 ± |
13.14 ± |
|
VULT (mm) |
11.46 ± |
12.00 ± |
10.75 ± |
11.46 ± |
11.86 ± |
10.64 ± 1.57 |
11.40 ± |
11.96 ± |
11.09 ± |
|
BLLT (mm) |
11.08 ± |
11.25 ± |
10.75 ± |
10.86 ± 1.11 |
11.18 ± 1.40 |
10.78 ± |
10.87 ± |
11.50 ± |
12.00 ± |
|
VLLT (mm)* |
12.69 ± |
15.17 ± 3.01ab |
15.17 ± |
13.18 ± |
15.46 ± |
15.17 ± |
14.00 ± 1.81ab |
15.17 ± |
16.59 ± |
|
Ls-SnTVP (mm) |
6.04 ± |
6.38 ± |
6.25 ± |
6.61 ± |
6.82 ± |
6.44 ± |
6.37 ± |
5.92 ± |
6.23 ± |
|
Li-SnTVP (mm)* |
3.42 ± |
3.04 ± |
1.83 ± |
3.50 ± |
3.91 ± |
1.00 ± |
2.90 ± |
1.17 ± |
0.00 ± 3.26b |
|
Si-SnTVP (mm)* |
-5.15 ± |
-7.63 ± |
-7.92 ± 3.90abc |
-6.71 ± |
-7.27 ± 3.95abc |
-9.53 ± |
-8.73 ± 2.49abc |
-10.33 ± 2.99b |
-12.00 ± 2.73b |
|
Pg’-SnTVP (mm)* |
-4.38 ± |
-7.50 ± 2.94 abcd |
-5.96 ± 3.58acd |
-6.45 ± |
-6.82 ± |
-8.17 ± 2.97abcd |
-9.40 ± 3.14bd |
-10.58 ± 3.92bd |
-12.46 ± 3.93b |
|
MSD (mm)* |
-4.73 ± |
-5.96 ± 1.39abcd |
-6.17 ± |
-5.14 ± |
-6.32 ± |
-6.62 ± |
-5.07 ± 1.44abd |
-6.00 ± 1.15abcd |
-7.00 ± 1.00cd |
Note: Results are shown as mean ± standard deviation. *Asterisk indicates parameters with significant difference. The values with different superscript letters in a row are statistically significantly different (P < 0.05). Comparison among groups were carried out with Kruskal-Wallis test.
OJ, overjet; OB, overbite; UI, upper incisor; LI, lower incisor; SnTVP, subnasale true vertical plane; FCA, facial contour angle; NLA, nasolabial angle; LCTA, lip-chin-throat angle; BULT, Basic upper lip thickness; VULT, Vermilion upper lip thickness; BLLT, Basic lower lip thickness; VLLT, Vermilion lower lip thickness; Ss, sulcus superior; Ls, labrale superius; Li, labrale inferius; Si, sulcus inferior; Pg’, soft tissue pogonion; MSD, Mentolabial sulcus depth.
In contrast, the MEOJ classification did not exhibit significant differences, with both dental and soft tissue parameters appearing similar across the subgroups. The MPST in the MEOJ classification was not more backward with the trend to divergence. However, MPST exhibited an insignificantly more forward position of Li-SnTVP, Si-SnTVP, and Pg’-SnTVP and also a deeper MSD in the MEOJ-Normo group than the MEOJ-Hypo group.
The pattern observed in the NOJ classification was repeated in the SEOJ classification. All dental parameters were similar except for the LI-NB (mm), where the SEOJ-Hyper group demonstrated significantly more protrusion than the SEOJ-Hypo group. The Pg’-SnTVP in the SEOJ-Hyper group was significantly more retruded than in the SEOJ-Hypo group (P < 0.05) (Table 2).
Comparison across different OJ severities and skeletal divergences
The UIs in the SEOJ-Hypo group were significantly more proclined than in both the NOJ-Normo and NOJ-Hyper groups. Further analysis revealed that the UI-NA (mm) in the SEOJ-Hyper and SEOJ-Hypo groups were significantly more protruded than the NOJ-Normo groups (P < 0.05).
When examining the LI-NB (°) and LI-NB (mm), the NOJ-Normo group showed a significantly greater proclination and protrusion than the SEOJ-Hypo group. Furthermore, the NOJ-Hyper and MEOJ-Normo groups were significantly more protruded compared to the SEOJ-Hypo group. The LIs in the NOJ-Hyper group were also more protruded than in the SEOJ-Normo group. Significant differences in the LCTA were observed in similar pairs. The LCTA in the NOJ-Hyper group was significantly more obtuse than in the SEOJ-Hypo and SEOJ-Normo groups (P < 0.05).
Many Hyper subgroups showed significantly more backward MPST positions compared to other divergences. Li-SnTVP in the SEOJ-Hyper group was positioned significantly more backward than in the NOJ-Normo group. Si-SnTVP in the SEOJ-Hyper and MEOJ-Hyper groups were significantly more backward than in the NOJ-Normo and NOJ-Hypo groups, while the SEOJ-Normo group was also more backward than the NOJ-Hypo group. Pg’-SnTVP in the SEOJ-Hyper group was significantly more backward than in the NOJ-Normo and NOJ-Hypo groups. The MEOJ-Hyper group was also more retruded than the NOJ-Normo group (P < 0.05).
The MSD in the SEOJ-Hyper group was significantly deeper than in the NOJ-Normo and NOJ-Hypo groups. The SEOJ-Normo group also presented a greater MSD compared to the NOJ-Hypo group. Finally, the VLLT in the SEOJ-Hyper group was significantly thicker than the NOJ-Hypo and NOJ-Normo groups (P < 0.05) (Table 2).
Correlation and multiple linear regression
No correlation between OJ and MPA was detected (P = 0.529). Meanwhile, OJ was significantly positively correlated with VLLT (P < 0.001), and MPA was significantly positively correlated with VLLT (P < 0.05) and LCTA (P < 0.001). OJ was significantly negatively correlated with Li-SnTVP, Si-SnTVP, Pg’-SnTVP, and MSD, and MPA with Si-SnTVP and Pg’-SnTVP, which indicated that increases in OJ and MPA have a linear relationship with the more backward position of the MPST parameters (P < 0.001) (Table 3).
Multiple linear regression of each significant MPST parameter as a dependent variable with OJ and MPA as independent variables (predictors) was analyzed (Table 4). The strength and direction of the relationship between the soft tissue parameters and the independent variables were interpreted through the standardized coefficient beta (β) of each variable examined. For each one standard deviation increase in the predictor variable, the outcome variable changes by β standard deviations.
Both OJ and MPA significantly influenced the prediction of MPST. The influence of OJ on MPST parameters diminished from the LL towards the chin. Conversely, the influence of MPA increased in this region. The prediction of MSD was solely affected by the OJ (P < 0.001). In contrast, the LCTA was influenced only by the MPA (P < 0.001). Lastly, the VLLT was impacted by both OJ (P < 0.001) and MPA (P < 0.05) with OJ having a more pronounced effect.
Table 3. Correlation coefficients between overjet, mandibular plane angle, and mandibular soft tissue landmarks.
|
|
OJ (mm) |
MPA (°) |
Li-SnTVP (mm) |
Si-SnTVP (mm) |
Pg’-SnTVP (mm) |
MSD (mm) |
VLLT (mm) |
LCTA (°) |
|
OJ (mm) |
1.000 |
-0.055 |
-0.379*** |
-0.379*** |
-0.232*** |
-0.440*** |
0.423 *** |
-0.117 |
|
MPA (°) |
-0.055 |
1.000 |
-0.133 |
-0.352*** |
-0.427*** |
-0.125 |
0.185* |
0.410*** |
Note: Asterisk indicates parameters with significant difference (*P < 0.05, ***P < 0.001). Spearman’s rho was utilized.
OJ, overjet; MPA, mandibular plane angle; SnTVP, subnasale true vertical plane; Li, labrale inferius; Si, sulcus inferior; Pg’, soft tissue pogonion; MSD, mentolabial sulcus depth; VLLT, vermilion lower lip thickness; LCTA, lip-chin-throat angle.
Table 4. Multiple linear regression analysis and standardized coefficient beta of significant mandibular soft tissue variables.
|
Dependent variable |
Adjusted R2 |
Predictor |
Standardized coefficient beta |
Significance |
|
Li-SnTVP (mm) |
0.174 |
OJ |
-0.407 |
0.000*** |
|
MPA |
-0.157 |
0.049* |
||
|
Si-SnTVP (mm) |
0.280 |
OJ |
-0.394 |
0.000*** |
|
MPA |
-0.381 |
0.000*** |
||
|
Pg’-SnTVP (mm) |
0.262 |
OJ |
-0.246 |
0.001** |
|
MPA |
-0.470 |
0.000*** |
||
|
MSD (mm)
|
0.224
|
OJ |
-0.469 |
0.000*** |
|
MPA |
-0.143 |
0.064 |
||
|
VLLT (mm)
|
0.208
|
OJ |
0.441 |
0.000*** |
|
MPA |
0.175 |
0.025* |
||
|
LCTA (°) |
0.190 |
OJ |
-0.106 |
0.178 |
|
MPA |
0.433 |
0.000*** |
Note: Asterisk indicates parameters with significant difference (*P < 0.05, **P < 0.01, ***P < 0.001).
OJ, overjet; MPA, mandibular plane angle; SnTVP, subnasale true vertical plane; Li, labrale inferius; Si, sulcus inferior; Pg’, soft tissue pogonion; MSD, mentolabial sulcus depth; VLLT, vermilion lower lip thickness; LCTA, lip-chin-throat angle.
DISCUSSION
Our results showed that both OJ and skeletal divergence played a part in modifying the MPST. However, each parameter responded to the effect to a different extent. Despite the fact that significant differences in the values of deg and mm of the UIs were detected between some groups, the UL showed similar characteristics.
Effect of OJ severity
OJ showed the most substantial impact on the MSD by showing a correlation exclusively with OJ and not with MPA in which we found that the MSD in subjects with various divergences did not significantly differ. On the other hand, the increase in OJ severity deepened the MSD accordingly (Table 2). An increased OJ may alter LL morphology, potentially leading to a deeper MSD (Sarver, 2020). This alteration could result in an everted LL, thereby increasing VLLT measurements, which was also correlated with OJ. However, this effect gradually decreases from the LL to the chin, possibly because the teeth have less influence on the projection of the chin area.
Effect of skeletal divergence
The MPA significantly influenced the LCTA. A tendency toward hyperdivergence also increases with LI proclination, which could lead to an obtuse LCTA. The LCTA significantly differed between the NOJ-Hyper group and the other two groups of NOJ-Hypo and SEOJ-Hypo. The difference was possibly due to the inclination and position of the LIs that were more proclined and protruded in the NOJ-Hyper group, while the LIs were more retroclined and retruded in the NOJ-Hypo and SEOJ-Hypo groups. Interestingly, SOJ-Hypo had a retroclined LI, while the NOJ-Hypo group had LIs almost as proclined as the NOJ-Hyper group but exhibited similar LCTA. The severity of OJ in increasing the VLLT could explain the increase in LCTA in the SEOJ-Hypo group with more retroclined LIs.
Combined effects
Both OJ and MPA influenced a more retruded MPST. As the OJ increases, a general trend of the MPST moving backward was observed. However, in the SEOJ-Hypo group the soft tissue Pg’ was more pronounced than in the other groups, which contrasted with the other parameters that tended to be more backward. The effect of OJ on the VLLT and MSD might indirectly contribute to the protrusion of the Pg’. We found a similar pattern regarding skeletal divergence in the Li-SnTVP and Si-SnTVP sagittal position in the NOJ and SEOJ groups, which had the greatest protrusion in the Hypo subgroups and progressively became more retruded as the MPA increased. The greatest retrusion was in the SEOJ-Hyper group. This follows the mandibular changes reported during growth, which showed that individuals who became more hyperdivergent also became more retrognathic (Buschang and Martins, 1998).
Apart from the retrognathism, the SEOJ-Hyper group showed the thickest VLLT and deepest MSD among all groups. According to the correlation and multiple regression analyses, the SEOJ-Hyper group represents the extremes affecting the VLLT and MSD that were significantly influenced by both MPA and OJ and OJ alone, respectively. Apart from the effect of OJ on the LL, the increase in VLLT could be explained by a similar compensatory mechanism, as reported in skeletal Class II patients, to have a significantly thicker Pg’ than other divergences (Nanda and Ghosh, 1995). The more backward rotation of the mandible in hyperdivergent patients might adapt similarly to mask the condition and maintain a more normal lip appearance.
The degree of impact that OJ and MPA may have on the MPST may be interpreted through correlation and multiple regression analyses. The effect of OJ was most significant at the LL and gradually decreased to the chin. Conversely, the effect of divergence was most significant at the chin and then reduced upwards. The perioral soft tissue appearance results from the degrees to which both factors affect different soft tissue landmarks. Within the scope of our study, it is suggested that retraction of LI should be carefully considered as correction of OJ might affect the LL more than the UL. Retraction of UI alone may already improve the LL; therefore, over-retraction of LI in the hope of improving LL appearance may be unnecessary. A tendency towards a hyperdivergent facial morphology could result in worsening the LL feature. Correction of hyperdivergence in patients should at least not increase the divergence in order to maintain or improve the MPST. The clinical application would be more explicitly demonstrated by a study that compared these subjects before and after treatment. A study similar to Jamilian et al. (Jamilian et al., 2008) should be conducted to understand the soft tissue changes in these groups of patients.
A limitation of this study lies in recruiting a large and diverse sample set because the specific facial morphology patterns pertinent to our research are uncommon in our institution. Consequently, a multi-center research study may be necessary to investigate these aspects more comprehensively in a broader population. Furthermore, a previous study reported that sex can affect soft tissue thickness (Guan et al., 2019). Since most of the samples in this study were female, the number of male subjects was too small to compare soft tissue thickness based sex. A study that compares soft tissue thickness between male and female subjects could be beneficial in identifying the effects.
CONCLUSION
The perioral soft tissue of the UL was not affected by either OJ or skeletal divergence, while the MPST was affected by both factors but to various extents. An increase in OJ influenced a deeper MSD, more retruded MPST, and thicker VLLT, while an increase in MPA has a significant impact on a more obtuse LCTA, more retruded MPST, and thicker VLLT.
ACKNOWLEDGEMENTS
This work was supported by the Graduate School of Faculty of Dentistry, Prince of Songkla University. We thank Glenn K. Shingledecker for providing help with the language and proofreading the article.
AUTHOR CONTRIBUTIONS
Kulnipa Punyanirun contributed to the conceptualization, methodology, investigation, formal analysis, writing - original draft, writing - review & editing, visualization, project administration, and funding acquisition; Chairat Charoemratrote contributed to the conceptualization, methodology, writing - review & editing, supervision, project administration, and funding acquisition.
CONFLICT OF INTEREST
The authors declare no conflict of interest.
REFERENCES
Bhateja, NitaKumari, Mubassar Fida, and Attiya Shaikh. 2015. Overjet as a predictor of vertical facial morphology in orthodontic patients with Class II division 1 malocclusion. Journal of Orthodontic Research.
Bittner, C., and H. Pancherz. 1990. Facial morphology and malocclusions. American Journal of Orthodontics and Dentofacial Orthopedics. 97: 308-315.
Buschang, P. H., and J. Martins. 1998. Childhood and adolescent changes of skeletal relationships. The Angle Orthodontist, 68: 199-206.
Guan, Yu-Xin, Li Xin, Peng-Fei Tian, Hee-Moon Kyung, Tae-Geon Kwon, Li Bing, and Xiu-Ping Wu. 2019. Effect of soft tissue thickness on the morphology of lip in orthodontic treatment. International Journal of Morphology. 37: 1245-1251.
Holdaway, Reed A. 1983. A soft-tissue cephalometric analysis and its use in orthodontic treatment planning. Part I. American Journal of Orthodontics. 84: 1-28.
Jamilian, Abdolreza, Dariush Gholami, Mitra Toliat, and Shima Safaeian. 2008. Changes in facial profile during orthodontic treatment with extraction of four first premolars. Orthodontic Waves. 67: 157-161.
Kanavakis, G., L. Krooks, R. Lähdesmäki, and P. Pirttiniemi. 2019. Influence of overjet and overbite on soft tissue profile in mature adults: A cross-sectional population study. American Journal of Orthodontics and Dentofacial Orthopedics. 155: 57-63.e3.
Krooks, L., Pirttiniemi, P., Lähdesmäki, R., and Raustia, A. 2018. Malocclusions in relation to facial soft tissue characteristics, facial aesthetics and temporomandibular disorders in the Northern Finland Birth Cohort 1966. Oulun yliopisto.
Kumar, A. A., P. Parthiban, S. S. Kumar, G. Divakar, S. S. Sekar, and M. R. Silambu. 2022. Assessment and evaluation of soft tissue measurements between various mandibular divergences in the south indian population: A Cephalometric Study. Journal of Pharmacy & Bioallied Sciences. 14: S152-s155.
Lee, Y. J., J. T. Park, and J. Y. Cha. 2015. Perioral soft tissue evaluation of skeletal Class II Division 1: A lateral cephalometric study. American Journal of Orthodontics and Dentofacial Orthopedics. 148: 405-13.
Macari, A. T., and A. E. Hanna. 2014. Comparisons of soft tissue chin thickness in adult patients with various mandibular divergence patterns. The Angle Orthodontist. 84: 708-714.
McNamara, J. A., Jr., and L. Franchi. 2018. The cervical vertebral maturation method: A user's guide. The Angle Orthodontist. 88: 133-143.
Nanda, R. S., and J. Ghosh. 1995. Facial soft tissue harmony and growth in orthodontic treatment. Seminars in Orthodontics. 1: 67-81.
Nuntasukkasame, A., S. Suntornlohanakul, and C. Charoemratrote. 2012. Natural head position: The role in lateral cephalometric analysis. The Online Journal of Thai Association of Orthodontists. 2: 6.
Perović, T. M., Blažej, M., and Jovanović, I. 2022. The influence of mandibular divergence on facial soft tissue thickness in class I patients: A cephalometric study. Folia Morphologica. 81: 472-480.
Saltaji, Humam, Carlos Flores-Mir, Paul Major, and Mohamed Youssef. 2011. The relationship between vertical facial morphology and overjet in untreated Class II subjects. The Angle Orthodontist. 82: 432-440.
Sarver, David M. 2020. Dentofacial esthetics: From macro to micro Quintessence Publishing Co, Inc.
Schneider, Caroline A., Wayne S. Rasband, and Kevin W. Eliceiri. 2012. NIH Image to ImageJ: 25 years of image analysis. Nature Methods. 9: 671-675.
Upalananda, W., Kanjanaprapas, A., and Thongudomporn, U. 2024. Skeletal growth status agreement in a group of thai children and adolescents: A comparative analysis of fishman's skeletal maturation and baccetti's cervical vertebral maturation indices. Natural and Life Sciences Communications. 23: e2024025.
OPEN access freely available online
Natural and Life Sciences Communications
Chiang Mai University, Thailand. https://cmuj.cmu.ac.th
Kulnipa Punyanirun and Chairat Charoemratrote*
Department of Preventive Dentistry, Faculty of Dentistry, Prince of Songkla University, Songkhla 90110, Thailand.
Corresponding author: Chairat Charoemratrote, E-mail: metalbracket@outlook.co.th
Total Article Views
Editor: Anak Iamaroon,
Chiang Mai University, Thailand
Article history:
Received: April 1, 2024;
Revised: April 24, 2024;
Accepted: April 25, 2024;
Online First: May 16, 2024