 ISSN: 2822-0838 Online

Optimization of Rice Flour, Corn Starch and Modified Tapioca Starch to Produce Gluten Free Cookies
Parichart Sresatan, Pisit Dhamvithee, Sawaminee Nualkaekul, Chatrapa Hudthagosol, and Promluck Sanporkha*Published Date : March 7, 2024
DOI : https://doi.org/10.12982/NLSC.2024.024
Journal Issues : Number 2, April-June 2024
Abstract This research aimed to optimize the ratio of low protein flour for baking gluten-free cookies. Rice flour (50-90%), corn starch (5-30%) and modified tapioca starch (5-20%) were studied using a mixture design. The physical properties and sensory evaluation by 50 consumers were investigated. The results showed that 3 factors significantly affected the textural and sensory properties of the gluten-free cookies (P ≤0.05). The regression and analysis results for textural and sensory properties also showed that increasing the rice flour content increased the hardness, and increasing the corn starch content affected the crispness and spread ratio of the gluten-free cookies. It can be concluded that the optimal ratio of gluten-free flour was 90% rice flour, 5% corn starch and 5% modified tapioca starch as a substitute for wheat flour in cookies when using physical quality as the criterion.
Keywords: Rice flour, Corn starch, Modified tapioca starch, Gluten-free cookies
Funding: The authors are grateful for the research funding provided by Research and Researcher for Industries (RRI) year 2017 and S. Thai Huad (2002) Co., Ltd.
Citation: Sresatan, P., Dhamvithee, P., Nualkaekul, S., Hudthagosol, C., and Sanporkha, P. 2024. Optimization of rice flour, corn starch and modified tapioca starch to produce gluten free cookies. Natural and Life Sciences Communications. 23(2): e2024024.
INTRODUCTION
The gluten-free baked goods market was estimated to be worth USD 1.64 billion in 2021 and is expected to grow at a compound annual growth rate (CAGR) of 10.8% from 2022 to 2030 (Grand View Research, 2022). The cookie market is projected to reach USD 44.01 billion in 2025, with a CAGR of 5.3% (Grand View Research, 2022). The popularity and widespread consumption of cookies by people of all ages worldwide have led to the recognition that they are an excellent product for using composite flour types. There are various options for managing problems related to human nutrition with crackers, biscuits and cookies (Khairuddin and Lasekan, 2021; Goubgou et al., 2021). Crackers, biscuits and cookies are ready-to-eat snacks with a long shelf life, varied forms and pleasant flavors (Zouari et al., 2016; Goubgou et al., 2021). However, some crackers, biscuits and cookies are incorporated into dietary approaches aimed at addressing many persistent and nutrition-associated ailments, including malignancies, diabetes, obesity, cardiovascular disorders, and nutrient deficits (Khairuddin and Lasekan, 2021; Goubgou et al., 2021). Nephrologists worldwide have encouraged patients to adopt protein restriction and increase their consumption of low protein foods. Similarly, innovations and trends in protein-free or gluten-free bakery products are driven by the health consciousness of patients. Patients often seek functional and nutritious products to enhance their diets. Cookies are ready-to-eat snacks with a long shelf life (Zouari et al., 2016).
Cookies are a type of baked goods that typically use wheat flour or a combination of wheat flour with other types of flour as the main ingredient. Wheat flour contains gluten, which provides the dough its characteristic viscous and elastic properties. In gluten-free baking, various hydrocolloids are combined with native and modified starches to replicate the water-binding and structural properties of gluten-containing products (Koidis, 2016). Hydrocolloid is commonly utilized as a functional ingredient in the food business. In addition to the apparent advantages of taste, texture, mouth feel, moisture control, and water mobility, they enhance total product quality and stability by withstanding the challenges of processing, distribution, and final preparation (Kaur et al., 2015). Modified tapioca starches are hydrocolloid that is derived from the cassava root. The limited number of residual materials reduced amylose content compared to other starches containing amylose, and the high molecular weight of amylose and amylopectin distinguish tapioca starch from other starches (Pei-Ling et al., 2010). The applications of modified starch in cookies. Adding modified starch to cookies helps them digestible slow (Abbas et al., 2012). Modified tapioca starch (MTS) was gluten-free and non-allergenic, making them suitable for people with gluten sensitivity or allergies. Regulatory bodies, such as the US FDA, also recognize modified tapioca starches as safe. An interesting alternative for manufacturers is the development of gluten-free bakery products using locally available raw materials in Thailand, such as rice flour (RF), corn starch (CS) and tapioca flour; thus, reducing the need for imported wheat flour. The focus of gluten-free food development trends is to improve the appearance and texture to resemble conventional products. Commercial gluten-free products often exhibit quality issues such as low volume, undesirable color, crumb disintegration and inferior nutritional value compared with their wheat counterparts. Therefore, replacing gluten poses a technological challenge (Tsatsaragkou et al., 2015).
Gluten-free cookies have been made using flour derived from cereals such as rice, corn, sorghum, millet, legumes, pseudocereals and their combinations (Xu et al., 2020). RF is commonly combined with other flour or starch types, such as CS flour and potato starch/flour, to enhance the production of gluten-free bakery products including cookies, which are recommended for individuals with celiac disease (Montes et al., 2015; Šarić et al., 2019). RF, along with tapioca flour is gluten-free and offers advantages such as mild flavor, colorlessness, hypoallergenic properties, low salt content and easy digestibility of carbohydrates. These characteristics make RF an ideal choice for creating gluten-free products (Marcoa and Rosell, 2008). It has also been observed that gluten-free food products generally have lower protein content compared with their nongluten-free counterparts (Wu et al., 2015). Cookies made from low protein or gluten-free flour/starch can provide nutritional value while maintaining product quality comparable with cookies made from all-purpose wheat flour, presenting a challenge in product development.
The objective of this research was to determine the optimal ratio of RF, CS and modified tapioca starch as a substitute for all-purpose wheat flour to produce gluten-free cookies. The study aimed to evaluate the physical properties and sensory acceptance of consumers to select a prototype recipe for gluten-free all-purpose flour for cookie production. The findings from this research can serve as a guideline for future studies on producing low protein all-purpose flour in bakery products, particularly for patients with CKD. These patients require protein restriction but still need to obtain sufficient energy from their diet to meet their physical needs. Therefore, the research aimed to optimize the ratio of low protein flour for baking gluten-free cookies while maintaining acceptable quality and sensory characteristics.
MATERIAL AND METHODS
Materials
RF was purchased from Thai Wah Food Products Public Co., Ltd, while CS was purchased from Thai Flour Industry Co., Ltd. Modified tapioca starch (MTS) or KREATION®D8 was purchased from Siam Modified Starch Co., Ltd. It was modified by chemically modifying native starch under certain conditions. MTS is modified to allow the starch to function properly under common conditions during processing or storage, such as high heat, high shear, low pH, freeze and cooling. MTS is used as a thickening agent, stabilizer, or an emulsifier. The RF, CS and MTS were packed in polyethylene bags and stored at room temperature (28 ± 5°C) until analysis and use in making the all-purpose gluten-free flour for cookies. All-purpose wheat flour, unsalted butter, icing sugar, eggs, skim milk powder, sodium bicarbonate and vanilla were purchased from local markets in Bangkok, Thailand.
Physicochemical composition, technological parameters and color of flour/starch
The moisture, protein, fat, ash, and crude fiber contents of all-purpose wheat flour, RF, CS and MTS were determined using AOAC methods (2019). Carbohydrate content was calculated using their differences (100 - %moisture - %protein - %fat - %ash - %crude fiber).
Pasting properties were measured using the Rapid Visco Analyzer (RVA) Model-4500, manufactured by Newport Scientific, Australia. An aluminum cylinder was filled with 3.0 g of sample flour or starch (at a sample resolution of 14%) and 25.0 ml of distilled water for viscosity measurement. The mixing blade was stirred and rotated about 10 times to ensure the sample did not agglomerate. The mixture was then placed in the RVA using the standard 1 profile. Peak viscosity (maximum viscosity), trough viscosity, and final viscosity were reported, and breakdown and setback values were calculated using the following equation below.
Breakdown = Peak viscosity – Trough
Setback = Final viscosity – Trough and reported in Rapid Visco Unit (RVU)
Thermal properties of flour or starch were analyzed using a differential scanning calorimeter (DSC-7, Perkin Elmer, USA) following the method described by Kim et al., 1995. For the starch samples, a solution was prepared with a concentration of 30% (w/w) by dry weight of starch, using distilled water as a solvent. The mixtures were made in the stainless pan by weighing 12 mg of dried starch (30% proportion), adding 70% deionized water, sealing it and leaving it at room temperature overnight. The sample was heated at a rate of 10°C/min from 0 to 120°C, using an empty stainless DSC pan as a reference. The following values were reported: onset temperature (To), peak temperature (Tp) and enthalpy (ΔH).
An amylose quantification kit (Bangkok, Thailand) was used to determine the apparent amylose content (AAC) of rice flour and flour according to the International Organization for Standardization ISO 6647-2: 2020.
Experimental design
The extreme vertices mixture design was employed to assess the impact of RF (X1), CS (X2) and MTS (X3) on the physicochemical and sensory attributes of gluten-free cookies. To identify the optimal combinations that would yield an acceptable product and estimate the most favored product with the highest sensory score, an estimated ridge analysis was conducted. The proportions of each component were expressed as fractions of the mixture, ensuring that the sum of X1, X2 and X3 equaled 100%.
∑Xi = X1 + X2 + X3 = 100
The three factors considered in this study were RF, CS and MTS, which are the processing components. Table 1 presents the levels and experimental design totaling nine combinations. The minimum and maximum levels for RF were determined based on the objective of using it in a proportion of more than 50%. On the other hand, the proportions of CS and MTS have been established in the literature.
An irregular experimental design consisting of nine points (Figure 1) was generated. This design included four vertices, four points in the middle of each edge and a repeated center point. The proportions of the different flours in the formulation resulting from the experimental design varied within the range of 50 to 90 for RF, 5 to 30 for CS and 5 to 20 for MTS, based on a traditional recipe. All formulas of mixed flour had lower protein content when compared with all-purpose wheat flour. Therefore, this all mixed flour called the low-protein all-purpose flour.
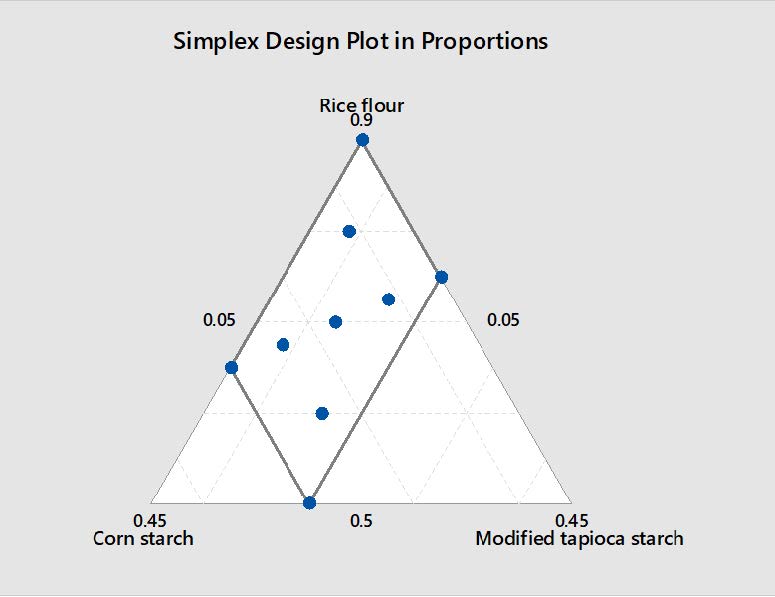
Figure 1. 9 Point augment extreme vertices mixture design for the effects of rice flour (X1), corn starch (X2), and modified tapioca starch (X3).
Cookie formulation and manufacturing
The recipe for the control cookies was modified from the cooking bible bakery cookbook (Luangsakul and Nualkaekul, 2017). Cookies made with all-purpose wheat flour (control) and with a combination of gluten-free flours using the following ingredients: flour (40.38%), unsalted butter (33.65%), icing sugar (16.15%), egg (5.12%), skim milk powder (3.36%), sodium bicarbonate (0.67%) and vanilla (0.67%). Using an electric kitchen mixer (Electrolux EHSM3417, Thailand) set to speed 3, unsalted butter and icing sugar were creamed for ten minutes. After adding the egg and vanilla, the mixture was continued at speed 2 for 2 minutes. Skim milk powder, sodium bicarbonate and flour mixes were all added and combined at speed 1 for one minute. Cookies dough was allowed to rest at 0 to 5°C for 10 minutes. Three batches of each formulation were prepared and one hundred cookies were obtained from each batch (10 pieces of cookies per treatment). Manual rolling was used to create a sheet of dough that was 5 mm thick. Cookies were made with dough that was cut into circles (25 mm inside diameter) and the weight of the cookies before baking was approximately 8 grams/piece. The cookies were placed on a baking sheet lined with parchment paper, and baked at 150°C for 10 ± 1 minutes. Before data were analyzed, baked cookies were taken out of the oven, allowed to cool to room temperature for an hour, then packaged in sealed orientated polypropylene bags and kept at room temperature for 24 hours.
Physical and textural characteristics of control and experimental gluten-free cookies
Moisture content was determined using the AOAC (2012) method. The gluten-free cookies were crushed into a fine powder before the moisture content analysis.
The surface color of the gluten-free cookies was measured using a colorimeter with an optical sensor, specifically using the CIE L*, a* and b* color scheme. The color measurements were conducted using the ColorFlex EZ instrument manufactured by Hunter Associates Laboratory Inc. in VA, USA, as described by Elleuch et al., (2014).
Diameter, thickness and spread ratio of both the gluten-free cookies and control cookies were analyzed using vernier calipers from Mitiyoto Co. in Tokyo, Japan. The diameter was measured after each cookie was turned 90 degrees, and the ultimate diameter was determined by averaging the two measurements and dividing it by six. The thickness of the cookies was determined by stacking six cookies one on top of the other and restacking them six times. The spread ratio was calculated by dividing the diameter of the cookies by their height, as explained by Zoulias et al., (2000).
The hardness of the cookies was measured using a texture analyzer (TA1 Texture Analyzer) equipped with a 1000 (N) load cell and a sharp blade cutting probe. The blade traveled a distance of 30 mm, and each cookie was centered on its base during the test. The testing speeds were set at 3 mm/s before the test, 1 mm/s during the test and 5 mm/s after the test. The hardness and crispness of the cookies were assessed by measuring the peak braking force using a crisp fracture jig, as described by Zouari et al., (2016). Three cookies were used for each sample to measure hardness and crispness.
Sensory evaluation of control and experimental gluten-free cookies
The sensory evaluation of the cookies was conducted one day after their preparation. The evaluation involved 50 panelists, consisting of 8 men and 42 women, aged from 18 to 35 years, who were habitual consumed cookie, which approaching numbers as proposed by Mancebo et al., (2016) for habitual cookie consumers. This research was conducted under approval for human with a COA. No. of MUPH 2017-124. The panelists were undergraduate and graduate students from the Department of Nutrition, Faculty of Public Health, Mahidol University. The sensory evaluation included scoring the samples based on their color, aroma, taste, crispiness and overall liking. A nine-point hedonic scale was used for the evaluation, where a score of 9 represented “excellent” and a score of 1 indicated “very poor.” To ensure unbiased evaluations, each sample was labeled with a unique three-digit code assigned randomly. The samples were then served to the panelists individually, one at a time. Before testing each sample, panelists cleaned their palates with water. The sensory evaluation took place at the Faculty of Public Health, Mahidol University, in a controlled environment. The evaluation area was lit by daylight fluorescent bulbs, air-conditioned and free from cooking odor and noise. These measures were taken to provide an optimal sensory testing environment.
Optimization
The desired goals for each of the physical and sensory properties were chosen. The physical and sensory characteristics were designed to be identical to the control. Compared Pasting and thermal property results of low protein all-purpose flours and all-purpose wheat flour were compared.
Statistical analysis
An analysis of variance (ANOVA) one-way linear model was used as the basis for the statistical analysis, which was carried out using the statistical program SPSS Software for Windows, Version 18.0 (SPSS Inc., IL, USA). Data are provided as means +SD. Duncan’s multiple range test (DMRT) was then used to compare these data at a 95% significance level.
RESULTS
Chemical composition, thermal characteristics and color of flour/starch
The chemical composition of RF, CS, MTS and all-purpose wheat flour significantly differed (P <0.05) as shown in Table 1. These values indicate the percentage of protein present in each flour type. MTS has no detectable protein content, while CS has a protein content of 0.27%. RF has a higher protein content of 7.00%, and all-purpose wheat flour has the highest protein content of 11.76% among the mentioned flours. Fat contents of RF, all-purpose wheat flour, MTS and CS were 0.99%, 0.77%, 0.35% and 0.21%, respectively. Carbohydrate contents of RF, all-purpose wheat flour, MTS and CS were 78.74%, 74.22%, 86.70% and 86.12% respectively. The amylose contents of CS, RF, MTS and all-purpose wheat flour (control) were 32.07%, 24.39%, 23.68% and 22.73%, respectively.
Table 1. Chemical compositions of rice flour, corn starch, modified tapioca starch and all-purpose wheat flour.
|
Flour type |
Chemical composition (%) |
|
|||||
|
Moisture |
Protein |
Fat |
Ash |
Crude fiber |
Carbohydrate |
Amylose |
|
|
Rice flour |
11.86 ± 0.10bc |
7.00 ± 0.08b |
0.91 ± 0.08a |
0.19 ± 0..01b |
1.30 ± 0.04b |
78.74 ± 0.09c |
24.39 ± 0.01b |
|
Corn starch |
12.15 ± 0.02a |
0.27 ± 0.03c |
0.21 ± 0.01d |
0.07 ± 0.01c |
1.18 ± 0.04c |
86.12 ± 0.02b |
32.07 ± 0.02a |
|
Modified tapioca starch |
11.78 ± 0.02c |
0.00 ± 0.00d |
0.35 ± 0.02c |
0.08 ± 0.01c |
1.09 ± 0.01d |
86.70 ± 0.02a |
23.68 ± 0.01b |
|
All-purpose wheat flour |
11.95 + 0.01b |
11.76 + 0.10a |
0.77 + 0.09b |
0.50 + 0.03d |
1.80 + 0.02a |
73.22 + 0.17d |
22.73 ± 0.02c |
All-purpose wheat flour and low protein all-purpose flour are presented in Table 2. The To and Tp represent the temperature range for gelatinization formation. When studying the thermal properties of starch using DSC, it was observed that starch with high amylose content exhibited the highest temperatures, while the ΔH of gelatinization decreased. From the experimental results, the ΔH of all-purpose wheat flour (7.53 J/g) was lower than that of RF (11.04 J/g), low protein all-purpose flour (11.63 J/g), MTS (14.40 J/g), and CS (14.87 J/g). This corresponds to the trend observed in CS with high amylose content, where the ΔH was the lowest. The maximum To was recorded for CS (66.79°C), followed by RF (62.78°C), low protein all-purpose flour (60.24°C), all-purpose wheat flour (57.59°C), and MTS (54.66°C).
Table 2. Thermal characteristics of rice flour, corn starch, modified tapioca starch and all-purpose wheat flour and low protein all-purpose flour types.
|
Flour type |
Onset tempA (To, °C) |
Peak tempB (Tp, °C) |
Conclusion tempC (Tc, °C) |
EnthalpyD (∆H, J/g.) |
|
Rice flour |
62.78 ± 0.19b |
68.42 ± 0.59b |
77.02 ± 0.61a |
11.04 ± 0.75b |
|
Corn starch |
66.79 ± 0.42a |
70.34 ± 0.47a |
76.34 ± 0.18a |
14.87 ± 0.78a |
|
Modified tapioca starch |
54.66 ± 0.08e |
58.59 ± 0.12d |
70.38 ± 0.18b |
14.40 ± 0.30a |
|
All-purpose wheat flour |
57.59 ± 0.05d |
63.59 ± 0.12c |
70.69 ± 0.40b |
7.53 ± 0.11c |
|
Low protein all-purpose flourG |
60.24 ± 0.94c |
68.45 ± 0.25b |
77.20 ± 0.69a |
11.63 ± 0.54b |
Note: AThe onset temperature (To) refers to the initial temperature in a thermal change.
BPeak temperature (Tp) is the maximum temperature at which a thermal change occurs.
CConclusion temperature (Tc) is the final temperature of the thermal transformation.
DEnthalpy (∆H) is the difference between the conclusion temperature and peak temperature.
GLow protein all-purpose flour was the mixed flour between RF, CS and MTS with ratio of 90: 5: 5. (The best mixed flour for making cookies from extreme vertices mixture design)
The pasting characteristics of various flour and starch types were analyzed and the results are presented in Table 3. The pasting temperature, peak viscosity, lowest viscosity, breakdown, final viscosity and setback values were determined for RF, CS, MTS, all-purpose wheat flour and low protein all-purpose flour. The pasting temperature, indicating the temperature at which the viscosity change occurs during starch cooking, ranged from 63.53 to 90.85°C. RF had the highest pasting temperature (90.85°C), followed by all-purpose wheat flour (88.75°C), low protein all-purpose flour (87.63°C), CS (78.25°C), and MTS (63.53°C). The pasting temperatures of all these flour/starch types significantly differed (P ≤0.05). The peak viscosity, representing the starch's ability to bind with water and the force required for mixing, varied among the samples. MTS had the highest peak viscosity (412.00 RVU), followed by CS (221.00 RVU), low protein all-purpose flour (198.75 RVU), RF (172.50 RVU) and all-purpose wheat flour (111.00 RVU). The lowest viscosity (trough) indicates the lowest level achieved during heating and mixing. All-purpose wheat flour had the lowest trough viscosity (72.50 RVU), indicating less resistance to heat. After the dough cooled down, the viscosity increased until it reached the final viscosity. This increase in viscosity is due to the rearrangement of amylose and amylopectin molecules, a process called retrogradation. Retrogradation leads to a starch powder with higher viscosity, more stability, an opaque gel texture and the ability to hold water without absorbing more. The breakdown, measuring the difference between the maximum and minimum viscosity, was highest for MTS (216.50 RVU), indicating its ability to withstand temperature and agitation. CS (67.00 RVU), all-purpose wheat flour (39.00 RVU), RF (19.00 RVU) and low protein all-purpose flour (17.65 RVU) followed in descending order. The final viscosity indicates the appearance of starch as a paste or gel after retrogradation.The setback value, which is related to the texture characteristics of the product, is influenced by amylose recovery. RF had the highest setback value (168.50 RVU), indicating a strong gel and easy retrogradation. Low protein all-purpose flour (103.15 RVU), MTS (83.50 RVU), all-purpose wheat flour (73.50 RVU), and CS (71.50 RVU) followed in descending order. The setback of CS did not significantly differ (P >0.05) from all-purpose wheat flour when compared. Overall, the study found significant differences in pasting characteristics among the different flour and starch types analyzed, including variations in pasting temperature, peak viscosity, lowest viscosity, breakdown, final viscosity and setback values. These findings provide insights into the properties and potential applications of these ingredients in food products.
Table 3. Pasting characteristics of rice flour, corn starch, modified tapioca starch and all-purpose wheat flour, and low protein all-purpose flour.
|
Flour type |
Peak time (minutes) |
Pasting temperatureA (°C) |
Pasting property (RVU) |
||||
|
Peak viscosityB |
TroughC |
BreakdownD
|
Final viscosityE |
Set backF
|
|||
|
Rice flour |
6.53 ± 0.00b |
90.85 ± 0.57a |
172.50 ± 2.12d |
152.50 ± 0.00c |
19.00 ± 0.00b |
321.00 ± 2.83a |
168.50 ± 0.71a |
|
Corn starch |
5.37 ± 0.05d |
78.25 ± 0.14d |
221.00 ± 2.83b |
154.00 ± 2.83c |
67.00 ± 2.83b |
225.00 ± 2.83c |
71.50 ± 2.12d |
|
Modified tapioca starch |
3.00 ± 0.00e |
63.53 ± 0.11e |
412.00 ±2.83a |
195.50 ± 3.54a |
216.50 ± 0.71a |
279.50 ± 0.71b |
83.50 ± 3.54c |
|
All-purpose wheat flour |
5.87 ± 0.00c |
88.75 ± 0.00b |
111.00 ± 0.00e |
72.00 ± 0.00d |
39.00 ± 0.00b |
146.00 ± 0.00d |
73.50 ± 0.71d |
|
Low protein all-purpose flourG |
6.8 ± 0.00a |
87.63 ± 1.00c |
198.75 ± 0.78c |
181.15 ± 0.92b |
17.65 ± 0.07b |
284.30 ± 1.14b |
103.15 ± 2.33b |
Note: a-e Means with the same column with different letters significantly differ (P ≤0.05).
APasting temperature refers to the temperature at which the viscosity begins to increase.
BPeak Viscosity refers to the highest viscosity.
CTrough refers to the minimum viscosity.
EFinal Viscosity refers to the final viscosity.
FSetback refers to the value recovery.
DBreakdown refers to the difference between the maximum and the lowest viscosity.
GLow protein all-purpose flour was the mixed flour between RF, CS and MTS with ratio of 90: 5: 5. (The best mixed flour for making cookies from extreme vertices mixture design)
Physical and textural characteristics of control and experimental gluten-free cookies
Table 4 presents the physical characteristics of gluten-free cookies. The objective of the study was to identify the appropriate ratios of RF, CS and MTS for creating an all-purpose flour substitute in nine different cookie recipes, along with a control recipe. The color of the cookies was measured, and the results indicated a significant difference among the formulas using different ratios of RF, CS, MTS and the control formula (P <0.05). (Figure 2.)Additionally, the increase in drying temperatures caused the decrease of BC in dried RDFP. However, the BC of HAD-RDFP was not significantly different from that of VD-RDFP at the same drying temperatures (P > 0.05). (Figure 2.)
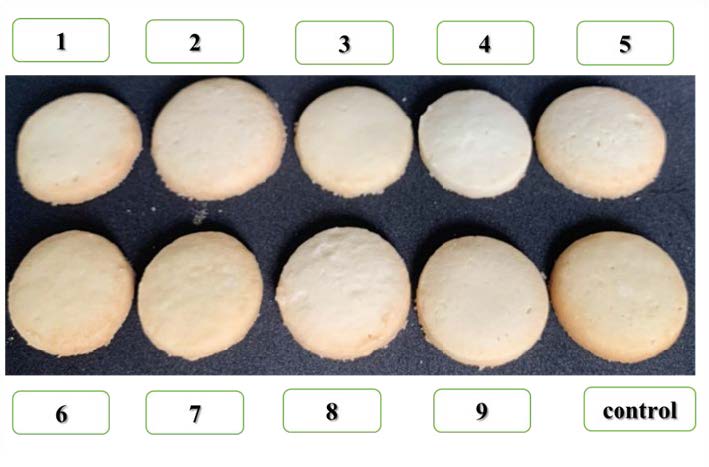
Figure 2. Appearance of gluten-free cookies made from varying ratios of RF, CS and MTS substitution: 1) 50RF-30CS-20MTS; 2) 60RF-23.75CS-16.25MTS; 3) 65RF-30CS-5MTS; 4) 67.50RF-23.75CS-8.75MTS; 5) 70RF-17.50CS-12.50MTS; 6) 72.50RF-11.25CS-16.25MTS; 7) 75RF-5CS-20MTS; 8) 80RF-11.25CS-8.75MTS; 9) 90RF-5CS-5MTS; Control: All-purpose WF.
The physical quality of the cookie products, specifically the moisture content, was measured. The results showed significant differences (P <0.05) between the recipes with different proportions of RF, CS and MTS compared with the control formula. However, the recipe with a proportion of 80 RF: 11.25 CS: 8.75 MTS did not show a significant difference from the control formula (P <0.05). The moisture content of the cookies made with the control formula and the 8th formula had the least moisture content, measuring 2.07 and 2.10%, respectively. This finding aligns with the desired crispiness of the cookies in the control formula. The formula using the ratio of RF, CS, MTS and the control formula exhibited significant differences (P <0.05). The proportion of RF, CS, MTS and control formula significantly differed (P <0.05). Cookies made from RF revealed a disadvantage, that is, it spread too much. The crumbly and brittle could be explained from crispness that measured from texture profile analysis. As a result, the gluten free cookies had lower hardness and crispness with greater moisture would not be brittle and crumbly. Cookies made from the controlled formulation of all-purpose flour had the lowest cookie spread rate compared with other formulations. No significant difference was found in the formula using the ratio of, 90 RF: 5 CS: 5 MTS and the control formula (P <0.05) (Table4).
Table 4. Effects of low protein all-purpose flour on the physical properties of gluten-free cookies.
|
Mix (RF-CS-MTS)* |
Physical property (%) |
Color value |
|||||||
|
RF |
CS |
MTS |
Hardness (N) |
Crispness (mm) |
Moisture |
Spread ratio |
L* |
a* |
b* |
|
50 |
30 |
20 |
8.31 ± 0.69e |
31.16 ± 11.61b |
2.37 ± 0.29cde |
6.94 ± 0.25abc |
81.75 ± 0.49a |
2.09 ± 0.16c |
22.33±0.47c |
|
60 |
23.75 |
16.25 |
9.78 ± 0.14cd |
32.01 ± 0.32b |
2.92 ± 0.19a |
7.27 ± 0.21a |
79.24 ± 0.73bcd |
3.28 ± 1.06a |
26.01 ± 1.94ab |
|
65 |
30 |
5 |
9.30 ± 0.18de |
32.26 ± 2.80ab |
2.25 ± 0.21de |
6.91 ± 0.43abcd |
80.01 ± 0.27b |
3.07 ± 0.24ab |
25.02 ± 1.10b |
|
67.50 |
23.75 |
8.75 |
9.89 ± 0.25cd |
32.55 ± 0.98ab |
2.48 ± 0.13bcd |
6.52 ± 0.27cd |
78.76 ± 0.38cd |
2.86 ± 0.12abc |
25.12 ± 0.03b |
|
70 |
17.50 |
12.50 |
9.92 ± 0.31cd |
31.15 ± 1.49b |
2.18 ± 0.20de |
6.73 ± 0.18bcd |
80.32 ± 0.19b |
2.44 ± 0.35bc |
24.75 ± 1.23b |
|
72.50 |
11.25 |
16.25 |
10.27 ± 0.85bcd |
30.21 ± 1.59b |
2.61 ± 0.14abc |
6.73 ± 0.39bcd |
79.82 ± 0.55bc |
2.78 ± 0.27abc |
25.62 ± 0.80ab |
|
75 |
5 |
20 |
10.79 ± 0.68abc |
31.10 ± 2.60b |
2.72 ± 0.29ab |
7.19 ± 0.38ab |
77.50 ± 0.50f |
3.25 ± 0.39ab |
27.13 ± 0.28a |
|
80 |
11.25 |
8.75 |
11.71 ± 1.45a |
31.31 ± 2.34b |
2.10 ± 0.07e |
6.41 ± 0.18d |
79.25 ± 1.34bcd |
2.72 ± 0.23abc |
24.19 ± 1.11b |
|
90 |
5 |
5 |
10.63 ± 1.16abcd |
32.97 ± 9.08ab |
2.74 ± 0.09ab |
5.32 ± 0.11e |
78.61 ± 0.42de |
2.98 ± 0.09ab |
25.48 ± 0.26ab |
|
Control |
11.38 ± 0.34ab |
41.39 ± 2.25a |
2.07 ± 0.05e |
5.29 ± 0.10e |
77.61 ± 0.50bcd |
2.07 ± 0.05e |
27.01 ± 0.96a |
||
Note: *Mix (RF-CS-MTS): Mixture of rice flour, corn starch and modified tapioca starch,
Control mean an all-purpose wheat flour formula
a, b, c, d, e Means within different superscripts in a column are significant difference at P ≤0.05
Sensory properties of control and experimental gluten-free cookies
The average scores of sensory attributes, in terms of color, aroma, taste, crispness and overall liking for gluten-free cookies, at different levels, are depicted in Table 4.
Table 5. Average scores of five sensory attributes of gluten-free cookies.
|
Mix (RF-CS-MTS) |
Attribute |
||||||
|
RF |
CS |
MTS |
Color |
Aroma |
Taste |
Crispness |
Overall liking |
|
50 |
30 |
20 |
5.30 ± 1.07b |
5.90 ± 1.33e |
5.90 ± 1.62e |
6.30 ± 1.41b |
6.50 ± 0.99c |
|
60 |
23.75 |
16.25 |
6.30 ± 1.12b |
6.70 ± 1.19bcd |
6.70 ± 1.53bcd |
6.30 ± 1.27b |
6.80 ± 0.89bc |
|
65 |
30 |
5 |
6.30 ± 1.29b |
6.50 ± 1.20bcd |
6.50 ± 1.72bcd |
6.10 ± 1.07b |
7.00 ± 0.86b |
|
67.50 |
23.75 |
8.75 |
6.20 ± 1.53b |
6.90 ± 1.22abc |
6.90 ± 1.60abc |
6.20 ± 1.27b |
6.90 ± 0.97b |
|
70 |
17.50 |
12.50 |
6.70 ± 1.31b |
6.90 ± 1.22ab |
6.90 ± 1.81ab |
6.40 ± 1.16b |
7.00 ± 0.83b |
|
72.50 |
11.25 |
16.25 |
6.50 ± 1.29b |
6.60 ± 1.21bcd |
6.60 ± 1.65bcd |
6.10 ± 1.53b |
7.10 ± 0.94b |
|
75 |
5 |
20 |
6.60 ± 1.32b |
6.20 ± 1.41de |
6.20 ± 1.86de |
6.50 ± 1.20b |
6.00 ± 0.83b |
|
80 |
11.25 |
8.75 |
6.40 ± 1.13b |
6.40 ± 1.18cde |
6.40 ± 1.61cde |
6.20 ± 1.32b |
6.90 ± 0.83b |
|
90 |
5 |
5 |
6.60 ± 1.01b |
6.50 ± 1.20bcd |
6.50 ± 1.70bcd |
6.60 ± 0.83b |
6.70 ± 0.91bc |
|
Control |
7.90 ± 1.09a |
7.40 ± 1.34a |
7.40 ± 1.62a |
7.70 ± 0.97a |
8.10 ± 0.68a |
||
Note: a, b, c, d means within different superscripts in a column are significant differences at P ≤ 0.05, Control mean an all-purpose wheat flour formula
n = 50, Mix (RF-CS-MTS): Mixture of rice flour, corn starch and modified tapioca starch
The sensory evaluation of the cookies revealed significant differences (P >0.05) in the following attributes: color, aroma, taste, crispness and overall liking. Based on the results, the panelists indicated that the gluten-free cookies made with the control formula received the highest average scores of overall liking, color, flavor, taste and crispness which were 8.1, 7.9, 7.4, 7.4 and 7.7, respectively. The second highest scores were obtained from the formula using a ratio of 72.50 RF: 11.25 CS: 16.25 MTS, with scores of 6.5, 6.6, 6.6, 6.1 and 7.1, respectively.
DISCUSSION
Chemical composition, thermal characteristic and color of flour/starch
The protein content of RF was found to be 7.00%. This value was lower than the results reported by Sarabhai et al., (2015) (7.60%), Dilek and Bilgiçi, (2021) (7.21%) and Ammar et al., (2022) confirming the higher protein content of RF. However, Giuberti et al., (2018) reported fairly similar protein content of RF (6.93%). From the experimental results, all-purpose wheat flour had almost twice as much protein as RF. This was consistent with the objective of the research which was to develop low protein flour. Thus, RF was selected as the main ingredient in developing low protein flour. RF lacks gluten protein and has a poor ability to form networks, protein in CS, hydrocolloids in MTS and combinations can be added to the batter to enhance the quality of the final product. The alternatives to gluten can improve the quality of gluten-free cookies. In the food sector, hydrocolloids or gums are frequently employed as functional additives. Withstanding the pressures of processing, distribution and final preparation, they also improve the overall product quality and stability in addition to the obvious benefits of taste, texture, mouth feel, moisture control and water mobility (Xue and Ngadi, 2009).
The pasting properties of flour/starch and gluten-free flour combinations were determined. Low protein all-purpose flour had a slightly lower pasting temperature than all-purpose flour. This is because low-protein all-purpose flour had a ratio of RF up to 90% (Table 3). When comparing RF with all-purpose wheat flour, the temperature at which the viscosity changed (pasting temperature) differed slightly. However, the viscosity properties of a RF with all-purpose wheat flour differed greatly. Regarding the peak viscosity, which is the value indicating the ability of starch to bind with water and the force required when stirring or mixing in food, RF exhibited a higher peak viscosity than wheat flour. This was consistent with the research of Preecha et al., (2000) who studied the use of RF as a substitute for wheat flour in cakes and cookies. RF revealed a higher peak viscosity than all-purpose wheat flour. Then RF must be heated to a higher level than all-purpose wheat flour in order for the starch granules to absorb water, swell and begin to increased in viscosity. This might be because RF had a lower protein content than all-purpose wheat flour (Table 1), thus absorbing less water (Hung et al., 2007). When the starch granules were fully swollen, the solution of low-protein all-purpose flour had the maximum viscosity which was higher than that of all-purpose wheat flour. It was shown that low-protein all-purpose flour swells better than all-purpose wheat flour. When the starch solution was further heated with continuous stirring. This caused the viscosity of the starch solution to decrease. This was probably because the internal structure of the starch granules were broken. The breakdown viscosity values of low-protein all-purpose flour were similar to all-purpose wheat flour. Then low-protein all-purpose flour had stability to heat and mixing similar to that of all-purpose wheat flour. When the temperature was reduced, amylose was paired with hydrogen bonds and form between molecular chains. This caused the structural boundary to be retrogradation. Amylopectin was retrograde lower than amylose because of its branch. Flour with a high amylose content was much retrograde faster than flour with high amylopectin. The low protein all-purpose flour showed higher amylose content (between 23.68% to 32.07%) than all-purpose wheat flour (22.73%) (Table 1). These was found that the set back and final viscosity of the low protein all-purpose flour was higher than the all-purpose wheat. The retrogradation rate of the flour was directly affected the textural quality of the food. Especially during the storage time, the product that made from high retrograded flour was drier and more crumbly than the product that made from the low retrograded flour. Thus, the cookie that make from the low protein all-purpose flour will have low retrogradation rate when compared with the cookie with all-purpose wheat flour this is because of lower amylose content of low protein all-purpose flour. Therefore, the cookie with low protein all-purpose flour will drier and more crumbly than cookie with all-purpose wheat flour during storage. From this experiment, it can be predicted that the hardness and crispness of the cookie with low protein all-purpose flour will increase during the storage time.
Thermal properties of flour include: Gelatinization start temperature (To), maximum gelatinization temperature (Tp), gelatinization end temperature (Tc), and gelatinization heat value (∆H) shown in Table 2. The highest onset temperature was 66.79°C which was the value of CS, while the MTS held the lowest value of 54.66°C. The highest peak temperature was 70.34°C, the value of CS, while the lowest value was 58.59°C of MTS. As the conclusion temperature, the lowest value was 70.38°C for the MTS, while the highest value was 77.20°C for the low protein all-purpose. Consistent with the results of all the hydroxypropylated starches had lower gelatinization parameters (To, Tp, Tc) than their unmodified and control starches, but hydroxypropylation increased swelling power and solubility. After hydroxypropylation, the hardness and adhesiveness of all the starch gels decreased (Liu et al., 1999). According to Lan et al. (2015), with a higher onset temperature, the crystallites are more stable, and additional energy is needed to form gel. It means that the flour is more difficult to gelatinize. Hence, the CS is the most difficult flour to gelatinize and the MTS can gelatinize easier than other flours. The thermal properties of low protein all-purpose was similar to RF. When comparing low-protein all-purpose flour with all-purpose wheat flour, it was found that To, Tp, Tc values of low-protein all-purpose flour were higher than all-purpose wheat flour. The ∆H value indicates the strength of the internal structure of the flour granules. The amylose content has been found to be directly correlated with ∆H. RF showed higher amylose content than all-purpose wheat flour. Therefore, the cookies with low protein all-purpose flour formula (90RF: 5CS: 5MTS) contained the highest content of RF resulted in increasing hardness of the cookies similar to the cookies made from all-purpose wheat flour (control formula).
Physical and textural properties of control and experimental gluten-free cookies
The chemical composition of wheat flour and blended flour differed, and the chemical compositions of cookies also differed. In addition, the blended flour is gluten-free making the ingredients not stick together. As a results, cookies are crumbly and not hygroscopic, lowering the moisture content more than the control formula (Gallagher et al., 2004). However, when adding more RF, cookies showed an increased amount of protein making them more cohesive and able to retain more water in the structure. Therefore, the moisture content was higher.
The whiteness index of wheat flour is low, probably due to the gluten content that affects the color of the flour. Flour types containing large amounts of gluten tend to be brown and flour with a small amount of gluten is white (Jammek and Naivikul, 2009). Cookies made from wheat flour and RF produced Maillard reaction which is a reaction between proteins or amino acids and sugars under high temperature conditions. This causes a change in color especially on the surface of the cookie. The color of the cookies produced after baking was light yellow with a slightly brownish hue (Charoenphun and Kwanhian, 2019). Fong-in et al., (2020) was discovered that Nile tilapia bone powder (NTBP) contains substantial amounts of protein (10.55%) and carbohydrates (86.37%). These components serve as the fundamental constituents for non-enzymatic browning reactions, such as the Maillard reaction and caramelization, which occur during the baking of cashew nut cookies. The surface color of all-purpose wheat flour cookies was golden brown and cookies with a mixed flour of RF, CS and MTS showed brownish-white color. It showed a tendency to make the color of some cookie formulas lighter than that of the control formula. Because baking time and temperature were controlled equally for all baking recipes as a control variable, some cookie formulas were lighter brown than that of the control formula. This was consistent with the result of Sarabhai et al., (2015) who found that the crumb color of wheat flour cookies was creamy white whereas RF cookies showed a yellowish white crumb shade.
The preparation of gluten-free cookies used the application of different flour blends; as a result, the hardness, crispness and taste differed from traditional cookies made with all-purpose wheat flour. However, gluten-free flour produced cookies with different physicochemical characteristics compared with cookies made from wheat flour, depending on the cereal origin and the milling process (Mancebo et al., 2015). In particular, a high spread ratio is known as a very positive attribute for cookies demonstrating their quality. The spread ratio is influenced by the expansion of the dough caused by leavening and gravitational flow, according to Gurjal et al., (2003). Viscosity is the main factor affecting dough flow; the higher the viscosity, the smaller the spread ratio. Fong-in et al., (2020) also demonstrated that increasing the addition of Nile tilapia bone powder (NTBP) to the cashew nut cookie dough led to a reduction in hydration levels, a slightly thicker dough, subsequently resulted in increasing spread rate during the production of cashew nut cookies. In general, flours with a high protein content had a negative impact on the spread ratio of cookies because they retained more water in the dough system, increasing viscosity. However, the cookie dimension was affected by the different proportions of flour and starch. The spread ratio increased when protein content increased in the formula (Mancebo et al., 2016). Despite this, the resultant dimension for cookies with a higher level of RF studied (90%) was not representative, just like incorporating protein; the spread ratio was not affected by flour addition, exception for those cookies with the highest RF content. The lower dough expansion during the baking process was promoted by adding protein. This was also observed by Kaldy et al., (1993) and Miller and Hoseney, (1997) in cookies made from wheat flour. It could be related to the protein effect on apparent glass transition temperature determining the cookie set time (Pareyt and Delcour, 2008). Another explanation of the protein effect on dough expansion could be the higher dough viscosity confirmed by other authors. Grain hardness, flour particle size, levels of damaged starch, starch type, amount of soluble and insoluble, presence of nonstarch polysaccharides and type of flour lipids (polar versus nonpolar lipid fractions), along with possible interactions, may all play a functional role on dough rheological parameters and cookie characteristics (Fustier et al., 2008; Pareyt and Delcour, 2008).
The texture, a crucial element in determining a cookie's quality, was another physical aspect assessed. The composition of the flour and the interactions between the ingredients affect how hard cookies turn out is common knowledge (Fustier et al., 2008). In line with Giuberti et al., (2018), the high hardness values found in cookies made with alfalfa seed flour as opposed to RF control may be related to the amount of protein present in the batter; this occurs because proteins and starch have a strong affinity for one another, leading to the formation of harder structures (Wani et al., 2012). Starch water causes a condition known as gelatinization. The starch molecule undergoes modifications when cooked. The hydrogen bonds between the molecules of starch in the starch granule are broken by heat. The starch granule's polymer chains of amylose and amylopectin relax and mix with the surrounding water. The viscosity of the starch liquid becomes more viscous as the starch granules inflated. The chemical makeup and structural characteristics of each variety of starch affect the temperature at which it starts to gelatinize (Srirot and Piyajomkwan, 2007). Wheat flour contains gluten, making the cookie dough appear sticky and malleable when formed. Gluten can hold onto carbon dioxide, maintaining the product's form and providing a pleasing appearance (Rattanapanon, 2010). The gluten-free flour blends of RF, CS and MTS decrease cohesiveness of the cookie product when compared with all-purpose wheat flour. However, when the ratio of RF increased, the protein content of the cookies increased resulting in increased cohesiveness of the cookie batter. This was in line with Srijan’s (2008) studies, who investigated substituting RF and cassava flour for wheat flour in tempura. It demonstrated that using cassava flour reduced product crispiness and expansion, while RF improved the texture and crispness. The more RF was added, the harder the composition became. The quantity and kind of bonds inside the starch molecule at the molecular level affect the strength and properties of the net structure within the starch granule. Shape, composition, net distribution within the starch, amylose/amylopectin ratio, molecular weight, molecular dispersion, number of branches, branch arrangement and length in amylopectin are only a few of the many variables that determine the number of linkages (Srirot and Piyajomkwan, 2007). This was in line with Preecha et al.’s (2000) research, which investigated the use of RF as a substitute for wheat flour in cakes and cookies manufactured from jasmine 105, Kor 23 and yellow Prathew 123 RF using the water milling method. The quality of the flour at 140 mesh was comparable to that of all-purpose flour in cookies. Wheat-flour cookies were a little bit softer than rice-flour cookies.
Sensory evaluation of control and experimental gluten-free cookies
The overall liking score tended to increase with an increase in RF content compared with the formulas that only used RF, CS and MTS. This was consistent with the research of Preecha et al., (2000) who studied the use of RF as a replacement for WF in cakes and cookies, and found that some brands of RF in the market can be used to make cookies. A survey of 195 people found that RF cookies were fairly well tolerated.
Optimize the ratio of low protein flour for gluten-free cookies
This research aimed to develop low protein flour for use in gluten-free cookies for patients with CKD. Therefore, the developed starch was compared with that of wheat flour to be used and suit gluten-free cookies. A suitable low protein flour recipe for making gluten-free cookies for patients with CKD has been found to include: 90% RF: 5% CS: 5% MTS. Wheat flour has an important function for the product, namely, helping to form the product structure and maintaining the product shape after baking. Wheat flour is the main ingredient used in making all kinds of bakery products.
CONCLUSION
The mixture of RF, CS and MTS can be used in gluten-free cookie formulations to produce cookies with acceptable baking properties. The response surface design was successfully applied to optimize the gluten-free cookie formulation and process conditions. The optimized formulation consists of 90% RF, 5% CS and 5% MTS as a substitute for all-purpose wheat flour in cookies while maintaining similar physical quality to the control. All of the physical properties of the mixture chosen as the best one were not significantly different to the control formular but the other RF formulas had some physical properties that significantly different from the control formula. This formulation resulted in cookies with increased hardness due to higher RF content and the inclusion of CS affected the crispness and spread ratio of the gluten-free cookies. In the present study, the protein content of low protein all-purpose flour of formula 90RF: 5CS: 5MTS was lower (6.25 g/100 g) compared to that of the all-purpose wheat flour (11.76 g/100 g). The protein content of the developed formula was reduced by 47% from the control formula. Low protein or non-protein starch is recommended for chronic kidney disease patients who need to limit or reduce protein intake. Therefore, the developed starch is a good choice for patients with chronic kidney disease and those interested in healthy starch products. Furthermore, the optimized cookies were well-received by the panelists. Overall, the findings indicate that the mixture of RF, CS and MTS is a viable alternative for producing gluten-free cookies with acceptable baking properties. Future studies should focus on investigating the nutritional aspects of these selected cookies in greater depth.
ACKNOWLEDGEMENTS
The authors are grateful for the research funding provided by Research and Researcher for Industries (RRI) year 2017 [grant numbers MSD60I0019] and S. Thai Huad (2002) Co., Ltd.
AUTHOR CONTRIBUTIONS
Parichart Sresatan conducted all of the experiments and wrote the manuscript. Pisit Dhamvithee performed the statistical analysis. Sawaminee Nualkaekul helps teach and guide the cookie process. Chatrapa Hudthagosol provides nutritional advice appropriate for chronic kidney disease. Promluck Sanporkha designed data visualization and wrote the manuscript. All authors have read and approved the final manuscript.
CONFLICT OF INTEREST
The authors declare that they have no competing interests.
REFERENCES
Abbas K.A., Khalil S.K., and Hussin A.S.M. 2012. Modified starches and their usages in selected food products: A review study. Journal of Agricultural Science. 2: 90-100.
Ammar, I.B., Sebii, H., Aloui, T., Attia, H., Hadrich, B., and Felfoul, I. 2022. Optimization of a novel, gluten-free bread's formulation based on chickpea, carob and rice flours using response surface design. Heliyon. 8(12): e12164.
AOAC. 2012. Official Method of Analysis: Association of Analytical Chemists. 19th ed. Association of Official Analytical Chemists (AOAC), Gaithersburg Maryland.
AOAC. 2019. Official methods of analysis: association of official analytical chemists. 21st ed. Association of Official Analytical Chemists (AOAC), Washington D.C.
Charoenphun N, and Kwanhian W. 2019. Production of gluten free cookies supplemented with durian rind flour. Science and Technology RMUTT Journal. 9(2):23-38.
Dilek, N.M., and Bilgiçli, N. 2021. Effect of taro [Colocasia esculenta (L.) Schott] flour and different shortening ratio on physical and chemical properties of gluten‐free cookie. Journal of Food Processing and Preservation. 45(11): e15894.
Elleuch, M., Bedigian, D., Maazoun, B., Besbes, S., Blecker, C., and Attia, H. 2014. Improving halva quality with dietary fibres of sesame seed coats and date pulp, enriched with emulsifier. Food Chemistry. 145: 765–771.
Fong-in, S., Phosri, P., Suttiprapa, S., Pimpangan, T., and Utama-ang, N. 2020. Effect of substitution of wheat flour with nile tilapia bone powder on the quality characteristics of cashew nut cookies. Chiang Mai University Journal of Natural Sciences. 19(4): 997-1011.
Fustier, P., Castaigne, F., Turgeon, S.L., and Biliaderis, C.G. 2008. Flour constituent interactions and their influence on dough rheology and quality of semi-sweet biscuits: A mixture design approach with reconstituted blends of gluten, water-solubles and starch fractions. Journal of Cereal Science. 48: 144-158.
Gallagher, E., Gormley, T.R., and Arendt, E.K. 2004. Recent advances in the formulation of gluten-free cereal-based products. Trends in Food Science and Technology. 15: 143-152.
Giuberti, G., Rocchetti, G., Sigolo, S., Fortunati, P., Lucini, L., and Gallo, A. 2018. Exploitation of alfalfa seed (Medicago sativa L.) flour into gluten-free rice cookies: Nutritional, antioxidant and quality characteristics. Food chemistry. 239: 679–687.
Goubgou M., Songré-Ouattara L.T., Bationo F., Lingani-Sawadogo H., Traoré1 Y. and Savadogo A. 2021. Biscuits: a systematic review and meta-analysis of improving the nutritional quality and health benefits. Food Production, Processing and Nutrition. 3: 26.
Grand View Research. 2022. Cookies market size, share & trends analysis report by product (bar, molded, rolled, drop), by distribution channel (offline, online), by region (North America, APAC, MEA, Europe, CSA), and segment forecasts, 2019 - 2025. Market Research. [accessed 2023 June 1]. https://www.grandviewresearch.com/industry-analysis/cookies- market
Grand View Research. 2022. Gluten-free bakery market size, share & trends analysis report by product (biscuits & cookies, bread, cakes), by distribution channel (online, supermarkets & hypermarkets), by region, and segment forecasts, 2022 - 2030. Market Research. [accessed 2023 June 1]. https://www.marketresearch.com/Grand-View-Research-v4060/Gluten-free-Bakery-Size-Share-32234695/
Gujral H.S., Guardiola I., Carbonell J.V. and Rosell C.M. 2003. Effect of cyclodextrinase on dough rheology and bread quality from rice flour. Journal of Agricultural and Food Chemistry. 51:3814–3818.
Hung, V.P., Maeda, T. and Morita N. 2007. Dough and bread qualities of flours with whole waxy wheat flour substitution. Food Research International. 40: 273-279.
Jammek J., and Naivikul O. 2009. Basic baking science and technology. 10th ed. Kasetsart University press, Bangkok. (in Thai).
Kaldy, M.S., Kereliuk, G., and Kozub, G.C. 1993. Influence of gluten components and flour lipids on soft white wheat quality. Cereal Chemistry. 70: 77-80.
Kaur, M., Sandhu, K.S., Arora, A., and Sharma, A. (2015). Gluten free biscuits prepared from buckwheat flour by incorporation of various gums: Physicochemical and sensory properties. LWT – Food Science and Technology, 62(1): 628–632.
Khairuddin M.A.N. and Lasekan O. 2021. Gluten-free cereal products and beverages: A review of their Health benefits in the last five years. Foods. 10: 2523.
Kim, Y.S., Wiesenborn, D.P., Orr, P.H., and Grant, L.A. 1995. Screening potato starch for novel properties using differential scanning calorimetry. Journal of Food Science. 60: 1060-106.
Koidis, A. 2016. 10 - Developing food products for consumers on a gluten-free diet. p. 201-214. In: Osborn, S. and Morley, W. (ed). Developing food products for consumers with specific dietary needs. Woodhead Publishing, place unknown.
Lan X., Li Y., Xie S., and Wang Z. 2015. Ultrastructure of underutilized tuber starches and its relation to physicochemical properties. Food Chemistry. 188: 632-640.
Liu H., Ramsden L., and Corke H. 1999. Physical properties and enzymatic digestibility of hydroxypropylated ae, wx, and normal maize starch. Carbohydrate Polymers. 40: 175-182.
Luangsakul N., and Nualkaekul S. 2017. Cooking bible: bakery. 4th ed. Amarin printing and publishing public company limited, Bangkok. (in Thai)
Mancebo C.M., Picón J., and Gómez M. 2015. Effect of flour properties on the quality characteristics of gluten free sugar-snap cookies. LWT-Food Science and Technology. 64: 264-269.
Mancebo C.M., Rodriguez P., and Gómez M. 2016. Assessing rice flour-starch-protein mixtures to produce gluten free sugar-snap cookies. LWT-Food Science and Technology. 67: 127-132.
Marcoa, C., and Rosell, C. M. 2008. Effect of different protein isolates and transglutaminase on rice flour properties. Journal of Food Engineering. 84(1): 132-139.
Montes, S. D. S., Rodrigues, L. M., Cardoso, R. D. C. V., Camilloto, G. P., Cruz, R. S. 2015. Tapioca and rice flour cookies: Technological, nutritional and sensory properties. Science and Agrotechnology. 39: 514-522.
Miller R.A., and Hoseney R.C. 1997. Factors in hard wheat flour responsible for reduced cookies spread. Cereal Chemistry. 74: 330-336.
Pareyt, B., and Delcour, J. A. 2008. The role of wheat flour constituents, sugar, and fat in low moisture cereal based products: A review on sugar-snap cookies. Critical Reviews in Food Science and Nutrition. 48(9): 824-839.
Pei-Ling, L., Xiao-Song1, H. and Qun S. 2010. Effect of high hydrostatic pressure on starches: A review. Starch/Starke. 62: 615–628.
Phuphechr, P., Suwonsichon, S. and Limanond, B. (2009). Chemical and physical characteristics of Sinin rice flour and qualities of Sinin rice flour substituted bread dough, Bangkok-Thailand. P 20-27. Proceedings of 47th Kasetsart University Annual Conference: Agro-Industry. Bangkok, 17-20 March 2009. The Thailand Research Fund, Bangkok (Thailand). (in Thai)
Preecha R., Wongpiyachon S., and Kongseree N. 2000. Rice and rice products research program. p.553-607. Product development from wheat-rice composite flour for cake and cookies. Kasetsart University, Bangkok (Thailand). (in Thai)
Rattanapanon N. 2010. Food Chemistry. Odeon Store Publisher, Bangkok. (in Thai)
Sarabhai, S., Indrani, D., Vijaykrishnaraj, M., Milind, Arun Kumar, V., and Prabhasankar, P. 2015. Effect of protein concentrates, emulsifiers on textural and sensory characteristics of gluten free cookies and its immunochemical validation. Journal of Food Science and Technology. 52: 3763-3772.
Šarić, B., Dapčević‐Hadnađev, T., Hadnađev, M., Sakač, M., Mandić, A., Mišan, A., and Škrobot, D. 2019. Fiber concentrates from raspberry and blueberry pomace in gluten‐free cookie formulation: effect on dough rheology and cookie baking properties. Journal of texture studies. 50(2): 124-130.
Srijan L. 2008. Substitution of wheat flour by rice flour in tempura mixes. RMUTI Journal. 1(1): 70-80. (in Thai).
Srirot D. N. and Piyajomkwan K. 2007. Technology of flour. Kasetsart University, Bangkok. (in Thai).
Tsatsaragkou, K., Papantoniou, M., and Mandala, I. 2015. Rheological, physical, and sensory attributes of gluten‐free rice cakes containing resistant starch. Journal of Food Science. 80(2): 341-348.
Wani, A. A., Sogi, D. S., Singh, P., Sharma, P., and Pangal, A. 2012. Dough-handling and cookie-making properties of wheat flour–watermelon protein isolate blends. Food and Bioprocess Technology. 5: 1612-1621.
Wu, J. H., Neal, B., Trevena, H., Crino, M., Stuart-Smith, W., Faulkner-Hogg, K., and Dunford, E. 2015. Are gluten-free foods healthier than non-gluten-free foods? an evaluation of supermarket products in Australia. British Journal of Nutrition. 114(3):448-454.
Xu, J., Zhang, Y., Wang, W., and Li, Y. 2020. Advanced properties of gluten-free cookies, cakes, and crackers: A review. Trends in Food Science and Technology. 103: 200-213.
Xue, J., and Ngadi, M. 2009. Effects of methylcellulose, xanthan gum and carboxymethylcellulose on thermal properties of batter systems formulated with different flour combinations. Food Hydrocolloids. 23(2): 286-295.
Zouari, R., Besbes, S., Ellouze-Chaabouni, S., and Ghribi-Aydi, D. 2016. Cookies from composite wheat–sesame peels flours: Dough quality and effect of Bacillus subtilis SPB1 biosurfactant addition. Food Chemistry. 194: 758-769.
Zoulias, E. I., Piknis, S., and Oreopoulou, V. 2000. Effect of sugar replacement by polyols and acesulfame‐K on properties of low‐fat cookies. Journal of the Science of Food and Agriculture. 80(14): 2049-2056.
OPEN access freely available online
Natural and Life Sciences Communications
Chiang Mai University, Thailand. https://cmuj.cmu.ac.th
Parichart Sresatan1, Pisit Dhamvithee2, Sawaminee Nualkaekul3, Chatrapa Hudthagosol1, and Promluck Sanporkha1, *
1 Department of Nutrition, Faculty of Public Health, Mahidol University, Bangkok 10400 Thailand.
2 Division of Food Science and Nutrition, Faculty of Agricultural Product Innovation and Technology, Srinakharinwirot University, Nakhon Nayok 26120 Thailand.
3 Department of Food Science and Technology, Faculty of Food Industry, King Mongkut’s Institute of Technology Ladkrabang, Bangkok 10520 Thailand.
Corresponding author: Promluck Sanporkha, E-mail: promluck.san@mahidol.ac.th
Total Article Views
Editor: Sirasit Srinuanpan,
Chiang Mai University, Thailand
Article history:
Received: October 17, 2023;
Revised: February 28, 2024;
Accepted: February 29, 2024;
Online First: March 7, 2024