 ISSN: 2822-0838 Online

Silicon Concentration and Expression of Silicon Transport Genes in Two Thai Rice Varieties. Benjamaporn Wangkaew, Chanakan Thebault Prom-u-thai, Sansanee Jamjod, Benjavan Rerkasem, and Tonapha Pusadee*
Published Date : 2019-08-23
DOI : https://doi.org/10.12982/CMUJNS.2019.0025
Journal Issues :
Number 3 , July-September 2019
ABSTRACT
Silicon (Si) is a beneficial element that contributes to increasing the resistance of plants to diseases, pests and lodging, and rice productivity. The objectives of the present study were to explore the relationship between Si con- centration and the expression of Si transport genes in different tissues of SPR1 and PTT1 rice varieties. The rice was grown aerobically in sand culture in pots arranged in completely randomized design with 3 independent replications. Variation in Si concentration among growth stages and plant tissues in both rice varieties were detected. The Si concentration in SPR1 was higher than PTT1 in some plant parts up to flowering, but significantly higher in all tissues by maturity, including in the husk which accounts for almost all of the Si in the grain. The consistently higher expression of the genes Lsi1 and Lsi2, detectable only in the roots, was in agreement with higher Si concentration in SPR1 than PTT1 in all tissues at maturity. SPR1 had higher expression of Lsi6 than PTT1 at booting stage, but the difference between varieties was less distinct at flower- ing stage. Either a varietal difference in the passive Si transport by transpiration or changes in the level of expression of the gene in the period from flowering to maturity or both are suggested by discrepancies between expression of the Lsi6 gene at flowering and the Si concentrations at maturity of the two rice varieties.
Keywords: Rice, Silicon, Uptake, Transportation, Gene expression, Lsi1, Lsi2, Lsi6
INTRODUCTION
Silicon (Si) is a beneficial element in the production of some crops (Broadley et al., 2012), as it helps to protect plants from various biotic and abiotic stresses, enhances resistance to diseases, insect pests, drought stresses and reduc- es lodging (Richmond and Sussman, 2003; Ma and Yamaji, 2015; Hajipour and Jabbarzadeh, 2016). Different plant species have the ability to accumulate Si from 0.1% to 10.0% in dry weight (Epstein, 1999; Ma, 2004; Hodson et al., 2005; Ma et al., 2011). Rice is a crop species in the Poaceae family that is able to accumulate Si up to 10% of its shoot dry weight, but with genotypic variation in the Si accu- mulation attributed to differences in the roots Si uptake ability (Ma et al., 2007).
Plants take up Si by its roots in the form of monosilicic acid (Si(OH)4), which is then translocated passively through the xylem (Ma et al., 2006; Ma et al., 2011) to the shoot by transpiration (Mitani et al., 2005; Ma and Yamaji, 2006), and finally deposited in the cell wall of leaves, stem and hulls of the rice seed. Three genes involving Si uptake and transportation have been identified. The genes Lsi1 and Lsi2 are reportedly expressed in the roots, on the plasma membrane of both exodermis and endodermis, where the casparian strips are located (Ma et al., 2006; Ma et al., 2011), with the Lsi1 involving in the Si influx transporter and Lsi2 in the Si efflux transporter (Ma et al., 2007). The Lsi6 gene has been report- ed to operate at the region of node-1 below the panicle and connected to the flag leaf. The Lsi6 has been found to be involved in the transfer of silicic acid across the parenchyma cell-bridge and its translocation to the panicle for development of the grain (Yamaji and Ma, 2009; Ma et al., 2011). The objectives of this study are to explore the relationship between Si concentration and expression of the Si transport genes in SPR1 and PTT1 rice, two of Thailand’s modern mega-varieties. The study was focusing on the expression of Si transport genes (Lsi1, Lsi2 and Lsi6) in comparison between the varieties, growth stage and plant parts. There- fore, the optimum concentration of Si at 1 M was evenly applied into both rice varieties. The information obtained from this study will further the understand- ing of the control of Si accumulation in rice, which could eventually be useful in manipulation of Si accumulation in different rice tissues in breeding programs.
MATERIALS AND METHODS
Plant growth
The experiment, conducted in sand culture in the greenhouse at the Division of Agronomy, Faculty of Agriculture, Chiang Mai University, in- volved 2 rice varieties, Suphan buri 1 (SPR1) and Pathum thani 1 (PTT1). The seed was sown after soaking in water overnight, seedlings grown for 2 weeks were transferred into pots (28 cm in diameter, 30 cm in height) containing washed river quartz sand watered twice daily with one liter of nutrient solution containing 1 M of Si, the pH adjusted to 5.5 ± 0.05 (Yoshida et al., 1976) (Figure 1). One experimental unit consisted of 10 pots each containing one plant, arranged in Completely Randomized Design (CRD) with 3 replications.
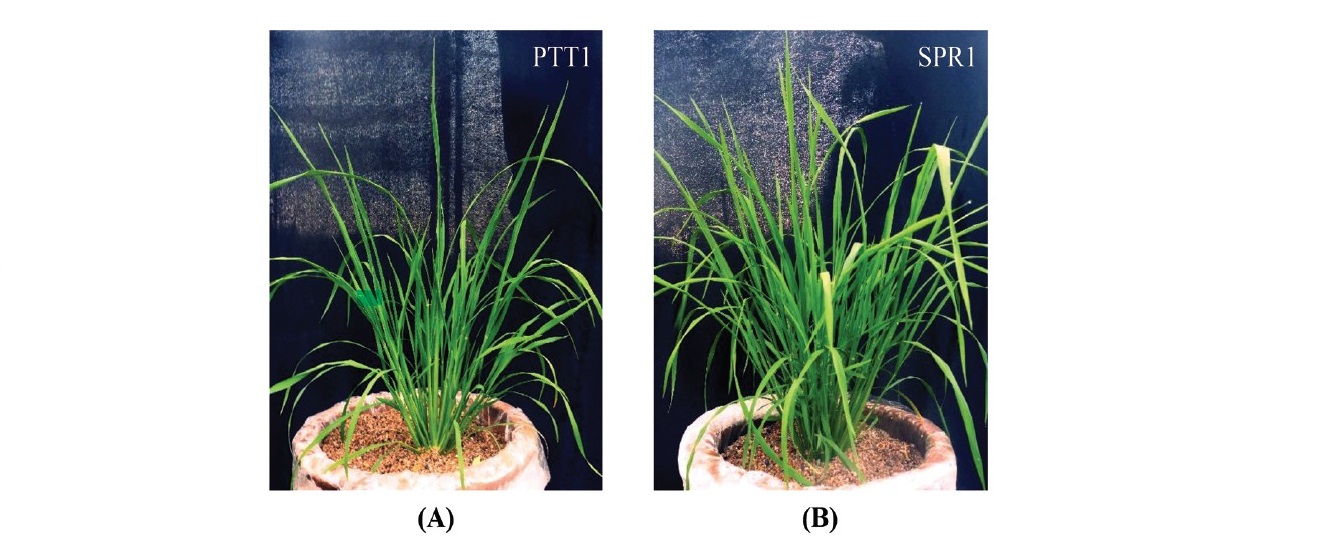
Figure 1. Phenotypes of (A) Pathum thani 1 (PTT1) and (B) Suphan buri 1 (SPR1) varieties at tillering stage grown in sand culture watered twice daily with one liter of nutrient solution (Yoshida et al., 1976) containing 1 M of Si.
Evaluation of Si concentration
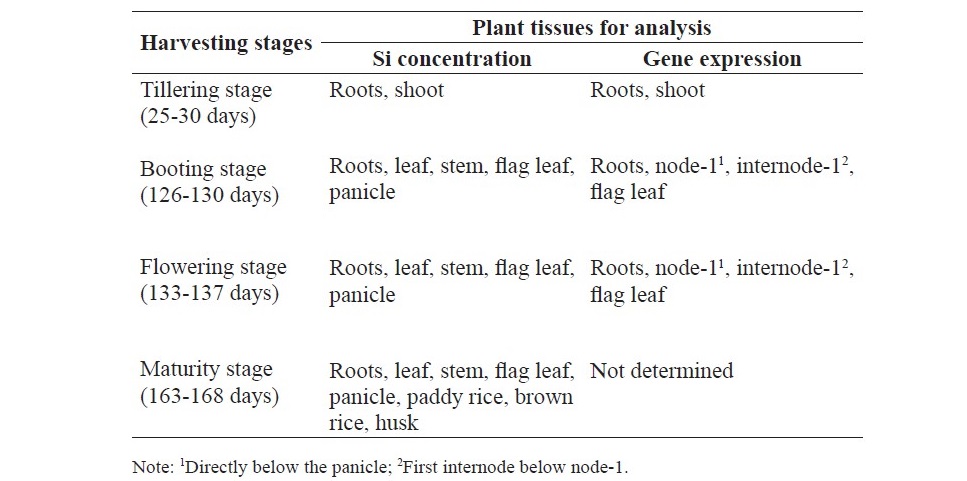
Plant parts were collected for Si analysis at 4 growth stages (Table 1). The samples were rinsed several times in distilled water excess water removed with tissue paper and dried at 70 °C for 7 days. The dried samples were ground into a fine powder and dried in oven at 60 °C for 2 days. The analysis for Si concentration was conducted by using a spec- trophotometer at 650 nm after digestion in 50% NaOH (Dai et al. 2005).
Gene expression of Lsi1, Lsi2 and Lsi6
RNA extraction. Plant samples were collected for gene expression analysis at 3 stages in the 2 rice varieties (Table 1). The fresh tissues were ground in liquid nitrogen. RNA was extracted using PureLinkTM RNA Mini Kit (Invitrogen, Thermo Fisher Scientific). Extracted RNA samples were ver- ified for quantity and quality by using nanodrop spectrophotometer and 1.5% agarose gel electrophoresis. The total RNA was treated with DNaseI with the following condition; 1 µg of total RNA, 2 µl of 10x reaction buffer, 1 µl of DNase1, and 9-15 µl of DEPC – treated water (total volume 20 µl), incu- bate the reaction at 37 °C for 30 min., add 1 µl of 50 mM EDTA and incu- bate at 65 °C for 10 min. Total RNA isolated from different tissues were diluted to 100 ng/μl concentrations and used for the qRT-PCR experiments.
cDNA synthesis. The cDNA was synthesized from 1 μg of total RNA using a RevertAid first strand cDNA synthesis Kit (Thermo scientific). PCR was carried out using 1 µg of total RNA (DNase I-treated), 1 µl of Oligo (dT)18, 2 µl of 10mM dNTP mix, 6 µl of 5x RT buffer, 1 µl of RiboLock RNase Inhibitor (20 U/µl), 1 ul of RevertAid RT (200 U/ µl) and 1-5 µl of DEPC - treated water (total volume 30 µl) and RevertAid first strand cDNA synthesis Kit (Thermo scientific), incubate the reaction at 42 °C for 60 min and terminate the reaction by incubating at 70 °C for 5 min., store at -20 °C. The cDNA were verified for quantity and qual- ity by using nanodrop spectrophotometer and 1.5% agarose gel electrophoresis
Table 1. Harvesting stages and plant tissues used for evaluating Si concentra- tion and gene expression in SPR1 and PTT1.
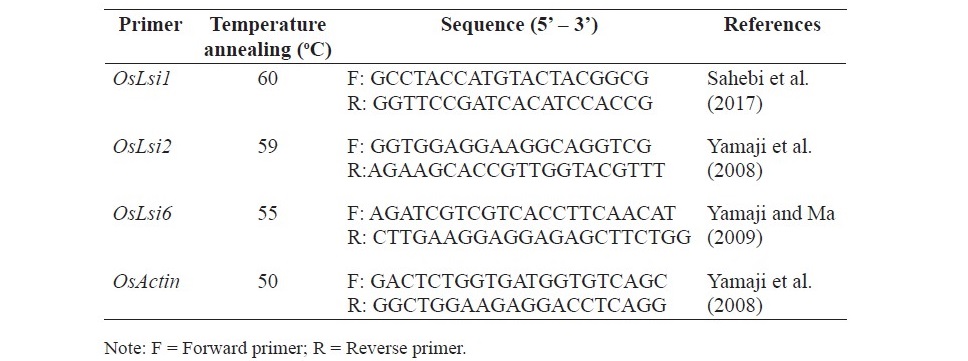
Gene expression by semi-quantitative RT-PCR analysis. Gene expres- sion levels of OsLsi1, OsLsi2 and OsLsi6 were analyzed by semi-quantitative RT-PCR using gene specific primers of OsLsi1, OsLsi2, OsLsi6 and OsActin1 (housekeeping gene) (Table 2). PCR were performed in triplicate for amplifi- cation of cDNA templates with OsLsi1, OsLsi2, OsLsi6 and OsActin with the following reaction; 2 µl of 1:20 diluted cDNA of total RNA 1 µg, 14 µl of water (ddH2O), 4 µl of 5x MyTaq Reaction Buffer, 0.2 µl of forward and reverse primer, 0.1 µl of 5 unit MyTaqTM HS DNA Polymerase (Bioline, UK), and 0.6 µl of DMSO (total volume 20 µl). The PCR condition was performed by denaturing at 95 °C for 2 min. followed by 33 cycles at 95 °C for 30 sec, primer anneal- ing for 30 sec (depends on the suitability of each primer), extension at 72 °C for 30 sec and final extension at 72 °C for 5 min. The related transcript quan- tification was performed using relative intensity to reference gene (Actin).
Table 2. Primer used for study gene expression of OsLsi1, OsLsi2, OsLsi6 and OsActin gene.
Data analysis
Statistical analyses of the data were performed by using the Statistica 9 software (analytical software SX, version 9, Tallahassee, FL, USA). The analysis of variance (ANOVA) was used to detect the differences between the treatments, and the least significant difference (LSD) at P < 0.05 was used to compare the means. The significance of the correlation coefficients was analyzed by Pearson correlations at P < 0.05.
Gene expression levels were analyzed by relative intensity to reference gene (Actin) using ImageJ software version 1.50i (Wayne Rasband National Institutes of Health, USA. The relative intensity of gene expression was subjected to statistical analysis using Statistica 9 software (analytical software SX, version 9, Tallahassee, FL, USA).

RESULTS
From tillering to flowering, SPR1 was clearly differentiated from PTT1 by the significantly higher root Si concentration, however, by maturity significantly higher Si was found in SPR1 than in PTT1 in all tissues including the brown rice which contained very little Si (Figure 2). At tillering stage, the roots of both SPR1 and PTT1 had higher Si concentration than shoot (Figure 2A). Si concentration in the roots in SPR1 was twice as high as in PTT1 (P < 0.01), but no significant difference was detected in the shoot. At booting stage, Si concentration in the roots, leaf, stem and panicle tissues were significantly different between tissues (P < 0.01) and generally higher in SPR1 (Figure 2B). Si concentrations highest in the roots (2.40-6.08% dry weight) and lowest in the stem (0.29-0.41%). When comparing between the rice varieties, Si concentration in SPR1 was higher than in PTT1 in most of the tissues, with the largest difference in the roots, less in the leaf, stem and panicle, there was little difference between varieties in their flag leaf Si up to flowering. At flowering stage, there was significant difference in Si concentration among rice tissues including root, leaf, stem, flag leaf and panicle. The Si concentrations were highest found in the roots (3.78-5.11%), while the lowest was in the stem (0.36-0.48%) (Figure 2C), the same as at the booting stage. Between the rice varieties, SPR1 had higher Si concentration than PTT1 in the roots (5.11% vs 3.78%) and leaf tissues (1.83% vs 1.54%). However, there was no significant difference between the varieties in their stem, flag leaf and panicle Si. At maturity, significant difference of Si concentration was found be- tween rice varieties and stages. Si concentration in all plant tissues of SPR1 were higher than PTT1 including root, leaf, stem, flag leaf, panicle, paddy rice, brown rice and husk. The highest Si concentration was found in the root tissue, 5.73% in SPR1 and 4.91% in PTT1, followed by the husk with 5.14% in SPR1 and 3.43% in PTT1 (Figure 2D). The Si concentration in the flag leaf, which were not significantly different between the varieties at booting and flowering, were clearly differentiated at maturity, with the concentration in SPR1 being more than twice that in PTT1. Very little Si was found in brown rice, although the Si concentration in SPR1 (0.03%) was significantly higher than in PTT1 (0.01%).
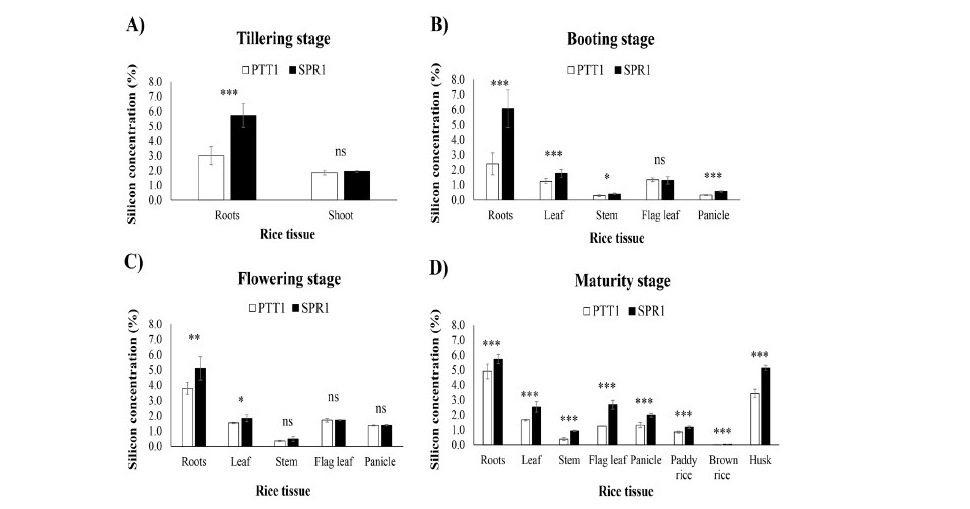
Figure 2. Silicon concentration in plant tissues of the rice varieties SPR1 (Suphan Buri 1) and PTT1 (Pathum Thani 1) at 4 different growth stages: (A) tillering, (B) booting, (C) flowering and (D) maturity.
Note: *, ** and *** indicate significant difference between varieties at P < 0.05, P < 0.01 and P < 0.001, respectively; ns indicates no significant difference.
Expression of Lsi1, Lsi2 and Lsi6 gene
The expression of Lsi1 and Lsi2 were detected only in the roots tissue not in the shoot including node, internode and flag leaf of tillering, booting and flowering stages (Figure 3A and 2B). The expression level of both Lsi1 and Lsi2 was higher in SPR1 than PTT1 of all stage. The expression levels of Lsi6 varied among tissues, stages growth and the rice varieties, except in the roots where the expression of Lsi6 was not detected at any stage. The expression of Lsi6 was not detected in neither root nor shoot tissues at tillering stage but detected at boot- ing and flowering stages (Figure 3C). At booting stage, the highest expression level of Lsi6 was in the node, more strongly in SPR1 than in PTT1, and in the internode and panicle in SPR1 but not in PTT1. At flowering stage, the high- est expression level of Lsi6 was found in node tissues of SPR1 and PTT1 rice, although the difference between the varieties was much less than at booting. In the internode, the expression of Lsi6 was higher in PTT1 than SPR1. The expression of Lsi6 was not detected in the flag leaf of both varieties at flowering.
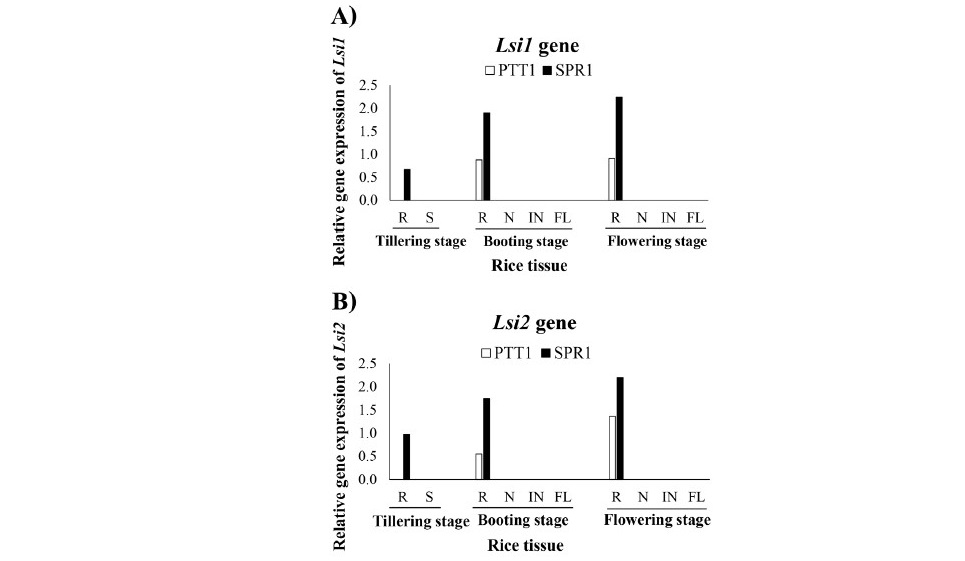

Figure 3. Relative gene expression of Si transport genes Lsi1 (A), Lsi2 (B) and Lsi6 (C) in the roots (R), shoot (S), node (N), internode (IN), and flag leaf (FL) of the rice varieties SPR1 (Suphan Buri 1) and PTT1 (Pathum Thani 1) at tillering, booting and flowering stages by semi-quantitative RT-PCR analysis.
Correlation between Si concentration and relative gene expression
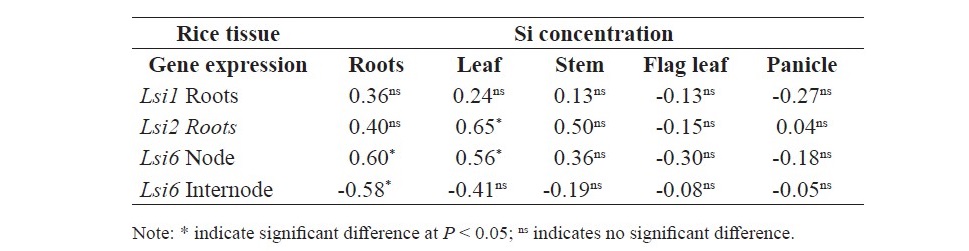
At tillering stage, there were positive correlation between Si concentration in the roots and relative gene expression of of Lsi1 and Lsi2 in roots (r = 0.73** and r = 0.74**, respectively) but not correlated with the Si concentration in shoot (Table 3). At Booting stage, there were positive correlation between Si concentration in roots and relative gene expression of Lsi1 in roots (r = 0.71**), Lsi2 in roots (r = 0.65*), Lsi6 in node (r = 0.58*), Lsi6 in internode (r = 0.79**), and Lsi6 in flag leaf (r = 0.86***) (Table 4). In addition, there were positive correlation between Si concentration in leaf and relative gene expression of Lsi1 in roots (r = 0.72**), Lsi6 in node (r = 0.78**), Lsi6 in internode (r = 0.63*), and Lsi6 in flag leaf (r = 0.65*). Furthermore, the result showed that Si concen- tration in panicle displayed positive correlation with relative gene expression of Lsi1 in roots (r = 0.69**), Lsi6 in node (r = 0.58*), Lsi6 in internode (r = 0.92***), and Lsi6 in flag leaf (r = 0.95***). However, there was no correla- tion between Si concentration in Stem and flag leaf with any gene expression. At flowering stage, there were positive correlation between Si concentration in root and relative gene expression of Lsi6 in node (r = 0.60*), Si concentration in leaf and Lsi2 in root (r = 0.65*), and Lsi6 in node (r = 0.56*) (Table 5).
Table 3. Correlation between Si concentration and relative gene expression of plant tissue in SPR1 and PTT1 at tillering stage.
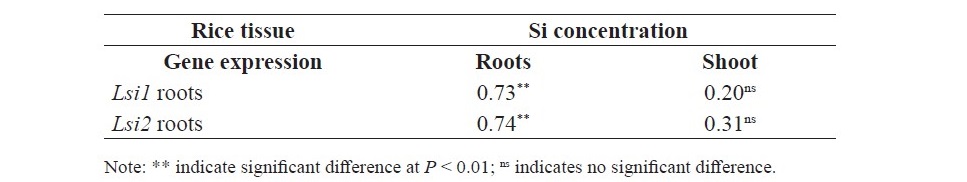
Table 4. Correlation between Si concentration and relative gene expression of Lsi1, Lsi2 and Lsi6 in SPR1 and PTT1 at booting stage.
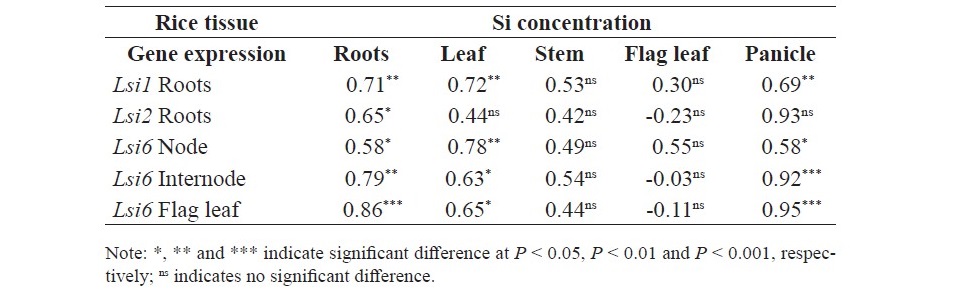
Table 5. Correlation between Si concentration and relative gene expression of plant tissue in SPR1 and PTT1 at flowering stage.
DISCUSSION
The present study illustrated Si concentration and gene expression of Lsi1, Lsi2 and Lsi6 in various tissues at four growth stages in SPR1 and PTT1 rice varieties. The results showed that the highest Si concentration was found in root tissue of all growth stages in both rice varieties at vegetative and reproduc- tive stage. This is in contrast to earlier observations of japonica rice in which Si concentration was high in transpiratory organs (husk and leaf blade), but low in absorptive organs (roots) (Yoshida et al., 1962a; Yoshida et al., 1962b). Ma et al. (1989) who also studied japonica rice reported that the highest Si contents was found in leaf blades. The result might be due to differences in experimentation, including the rice varieties and/or the fact that present study was conducted with rice planting grown aerobically in sand culture whereas those by Ma et al. (1989); Yoshida et al. (1962a) and Yoshida et al. (1962b) were conducted in solution cul- ture. A possible contamination of root Si from the sand (SiO2) needs to be resolved. The Si concentration in plant tissue increase with the growth stage suggested that accumulated in plant tissues with the increasing of the growth from tillering to maturity. However, Si in the paddy rice (i.e. the rice seed) accumulated much more in the husk and very little in the brown rice which is the endosperm enclosed in pericarp. The results are consistent with findings of Yoshida et al. (1962b).
The higher Si concentration found in the tissues of SPR1 than PTT1 ex- emplified differential ability to take up and accumulate Si between rice varieties. The ability to take up and accumulate Si depends on physiological and morpho- logical traits that influence acquisition of the element from the soil and its trans- portation to the various tissues and organs, including the passive transport in the transpiration stream (Mitani and Ma, 2005; Ma et al., 2007). Si uptake from the soil depends on the density and distribution of root structure characteristic of each plant species and Si concentration in the soil (Takahashi et al., 1990; Deren, 2001; Ma et al., 2011). Plants with higher root density and deeper distribution into the soil would be able to extract more nutrient. It has been previously report- ed that Si accumulation is a mechanism for plants such as rice to withstand biotic and abiotic stresses (Ma and Yamaji, 2006), from enhancing resistance to patho- gens and insect pests, strengthening stems against lodging, strengthening and improving rigidity of cell walls, improving light-interception, decreasing tran- spiration rate and increasing fertility of grains, to increasing rice productivity (Balasta et al., 1989; Hossain et al., 1999; Ma et al., 2006; Van Soest, 2006; Ma et al., 2007; Ma et al., 2011), all of which contributing to higher grain yield. The variety SPR1 is described as having shorter and stronger stem, more resistance to several fungal diseases and insect pests, with up to 20% higher yield potential than the variety PTT1 (Rice Department, 2018). It remains to be explored wheth- er the ability to accumulate more Si is directly associated with higher yield.
The expression levels of the Si transport genes Lsi1 and Lsi2 are con-sistent with the Si concentration in rice tissues and growth stages, and higher in the variety SPR1 than in PTT1. The expression of Lsi1 and Lsi2 were detected only in the root tissue in all growth stages, the positive correlation between Si concentration in root and relative gene expression of Lsi1 and Lsi2 in root and the implication that these two genes are involved in Si uptake in the rice roots, are in agreement with previous reports. The study by Ma et al. (2008) that Lsi1 and Lsi2 were detected in the roots and highly expressed in the exodermis and endodermis cells. Later, Ma et al. (2011) found that Lsi1 was expressed in the distal side while, Lsi2 was expressed in the proximal side on the exodermis and endodermis cells in the lateral root, which have important function of uptake and accumulation of Si in roots. Ma and Yamaji (2015) confirmed the function of Lsi1 and Lsi2 on silicon uptake in rice by knocking out Lsi1 and Lsi2 genes resulted in significant decrease in Si uptake in the rice roots. The function of Lis1 and Lsi2 together indicated the efficiency of Si uptake in rice root. More- over, the immunostaining showed that Lsi1 functions as influx transporter while Lsi2 functions an efflux transporter, Si is transported passively from external solution to the root exodermal cells and then released actively to the apoplast of the cortex in roots, before translocated to various parts of rice (Ma and Yamaji, 2008). The higher expression of Lsi1 and Lsi2 in SPR1 than PTT1 found here is consistent with the higher Si concentration is all tissues of SPR1 by maturity.
The expression of Lsi6 of both SPR1 and PTT1 rice varieties that was not detected in the roots at all stages, but the highest expression was found in the node at booting and flowering stages together with the positive correlation of the Si concentration in panicle with the relative gene expression of Lsi 6 in node, internode and flag leaf especially at booting stage confirmed the suggestion by Yamaji and Ma (2009) that that Lsi6 was involved in Si transportation to upper part of the rice plant. Yamaji and Ma (2009) reported that Lsi6 is the transporter at the nodes, with the highest level of Lsi6 expression in the first node below the panicle and the expression increases after the panicle is fully emerged implied that Lsi6 is functioned as Si transporter from root to accumulate in the grain (Ma et al., 2011). The mechanism for partitioning most of the Si to the husk and very little to the caryopsis (i.e. brown rice) remains to be explored. Ma et al., (2007) also suggested that Si uptake and the expression level of genes those in- volved in Si uptake and transportation are differ among rice varieties. However, in the present study although the higher Si concentration in the different shoot tissues was in agreement with higher expression of Lsi6 in SPR1 than PTT1 at the booting stage, but this was not the case at the flowering stage, nor was there agreement between Lsi6 expression at flowering and the higher Si concentration in all tissues of SPR1 than PTT1 at maturity. These discrepancies suggested ei- ther changes in the level of expression of Lsi6 over time after flowering, or more likely, accumulation of Si by other mechanism(s) in addition to the action of the Si transporter. After it is taken up by the roots, Si is loaded into the xylem, its distribution to the various organs of the shoot governed by the transpiration rate and age of the organ (Jones and Handreck, 1969; Broadley et al., 2012). The role of varietal difference in this passive transport of Si, possibly via differential rate of transpiration, is suggested by the Si concentration in transpiring organs at ma- turity that was much higher in SPR1 than PTT1, including the flag leaf and husk.
CONCLUSION
This study has established that differential ability to accumulate Si in two Thai rice varieties SPR1 and PTT1 was partly associated with expres- sion level of the Si transport genes Lsi1, Lsi2 and Lsi6. The level of expression of Lsi1 and Lsi2, detected only in the roots, was associated with the higher Si concentration in all tissues, i.e. root, leaf, stem, flag leaf, panicle, paddy rice, brown rice and husk in SPR1 than PTT1, from tillering, booting, flowering to maturity. The much higher Si concentration in all tissues at maturity, how- ever, could not be predicted by expression of the gene Lsi6 at flowering. Dif- ference between varieties in the passive transport of Si via differential rate of transpiration is offered as a possible mechanism by which SPR1 accumulated more Si in its transpiring organs, including the leaves and husks, than PTT1.
ACKNOWLEDGEMENTS
This research was financially supported by Office of the Higher Education Commission and the Graduate School Chiang Mai University.
REFERENCES
Balasta, M.L.F., Perez, C.M., Juliano, B.O., Vlllareal, C.P., Lott, J.N., and Roxas, D.B. 1989. Effects of silica level on some properties of Oryza sativa straw and hull. Canadian Journal of Botany. 67(8): 2356-2363. https://doi.org/10.1139/b89-301
Broadley, M., Brown, P., Cakmak, I., Ma, J.F., Rengel, Z., and Zhao, F. 2012. Beneficial elements. pp. 249-269. In: Marschner, H., editor. Marschner’s Mineral Nutrition of Higher Plants. 3rd ed. Academic Press, London.
Dai, W.M., Zhang, K.Q., Duan, B.W., Sun, C.X., Zheng, K.L., Cai, R., and Zhuang, J.Y. 2005. Rapid determination of silicon content in rice. Rice Science. 12(2): 145-147.
Deren, C.W. 2001. Plant genotype, silicon concentration and silicon-related re- sponses. pp. 149-169. In: Datnoff, L.E., Snyder, G.H., and Korndorfer, G.H., editors. Silicon in Agriculture. Elsevier Science, Amsterdam.
Epstein, E. 1999. Silicon. Annual review of plant physiology and plant Molecular Biology. 50(1): 641–664. https://doi.org/10.1146/annurev. arplant.50.1.641
Hajipour, H., and Jabbarzadeh, Z. 2016. Effect of foliar application of silicon on physiological responses of Chrysanthemum (Dendranthema × grandiflorum) at two different growth stages. Journal of Ornamental Plants. 6(1): 39–47.
Hodson, M.J., White, P.J., Mead, A., and Broadley, M.R. 2005. Phylogenetic variation in the silicon composition of plants. Annals of Botany. 96(6): 1027-1046. https://doi.org/10.1093/aob/mci255
Hossain, K.A., Horiuchi, T., and Miyagawa, S. 1999. Effects of powdered rice chaff application on Si and N absorption, lodging resistance and yield in rice plants (Oryza sativa L.). Plant Production Science. 2(3): 159–164. https://doi.org/10.1626/pps.2.159
Jones, L.H.P., and Handreck, K.A. 1969. Uptake of silica by Trifolium incarnatum in relation to the concentration in the external solution and to transpira- tion. Plant and Soil. 30(1): 71–80. https://doi.org/10.1007/BF01885262
Ma, J.F. 2004. Role of silicon in enhancing the resistance of plants to biotic and abiotic stresses. Soil Science and Plant Nutrition. 50(1): 11-18. https://doi.org/10.1080/00380768.2004.10408447
Ma, J.F., and Yamaji, N. 2006. Silicon uptake and accumulation in higher plants. Trends in Plant Science. 11(8): 392–397. https://doi.org/10.1016/ j.tplants.2006.06.007
Ma, J.F., and Yamaji, N. 2008. Functions and transport of silicon in plants. Cellular and Molecular Life Sciences. 65(19): 3049–3057. https://doi. org/10.1007/s00018-008-7580-x
Ma, J.F., and Yamaji, N. 2015. A cooperative system of silicon transport in plants. Trends in Plant Science. 20(7): 435–442. https://doi.org/10.1016/j. tplants.2015.04.007
Ma, J.F., Nishimura, K., and Takahashi, E. 1989. Effect of silicon on the growth of rice plant at different growth stages. Soil Science and Plant Nutrition. 35(3): 347-356. https://doi.org/10.1080/00380768.1989.10434768
Ma, J.F., Yamaji, N., and Mitani-Ueno, N. 2011. Transport of silicon from roots to panicles in plants. Proceedings of the Japan Academy Series B. Physical and Biological Sciences. 87(7): 377–385. https://doi.org/10.2183/pjab.87.377
Ma, J.F., Yamaji, N., Tamai, K., and Mitani, N. 2007. Genotypic difference in silicon uptake and expression of silicon transporter genes in rice. Plant Physiology. 145(3): 919–924. https://doi.org/10.1104/pp.107.107599
Ma, J.F., Tamai, K., Yamaji, N., Mitani, N., Konishi, S., Katsuhara, M., and Yano, M. 2006. A silicon transporter in rice. Nature. 440: 688-691. https://doi.org/10.1038/nature04590
Mitani, N., and Ma, J.F. 2005. Uptake system of silicon in different plant species. Journal of Experimental Botany. 56(414): 1255-1261. https://doi.org/ 10.1093/jxb/eri121
Mitani, N., Ma, J.F., and Iwashita, T. 2005. Identification of the silicon form in xylem sap of rice (Oryza sativa L.). Plant and Cell Physiology. 46(2): 279-283. https://doi.org/10.1093/pcp/pci018
Rice Department online [Internet] Rice knowledge bank [cited 2018 Aug 3]. Avalaible from http://brrd.ricethailand.go.th
Richmond, K.E., and Sussman, M. 2003. Got silicon? The non-essential beneficial plant nutrient. Plant Biology. 6: 268–272.
Sahebi, M., Hanafi, M.M., Rafii, M.Y., Azizi, P., Abiri, R., Kalhori, N., and Atabaki, N. 2017. Screening and expression of a silicon transporter gene (Lsi1) in wild-type Indica rice cultivars. BioMed Research International. 2017: 9064129. https://doi.org/10.1155/2017/9064129
Takahashi, E., Ma, J.F., and Miyake, Y. 1990. The possibility of silicon as an essential element for higher plants. Comments on Agricultural and Food Chemistry. 2: 99-122.
Van Soest, P.J. 2006. Rice straw, the role of silica and treatments to improve quality. Animal Feed Science and Technology. 130: 137-171. https:// doi.org/10.1016/j.anifeedsci.2006.01.023
Yamaji, N., and Ma, J.F. 2009. A Transporter at the node responsible for intervascular transfer of silicon in rice. The Plant Cell. 21: 2878-2883. https://doi.org/10.1105/tpc.109.069831
Yoshida, S., Forno, D.A., Cock, J.H., and Gomez, K.A. 1976. Laboratory Manual for Physiological Studies of Rice. International Rice Research Institute, Laguna. Philippines. 83 p.
Yoshida, S., Ohnishi, Y., and Kitagishi, K. 1962a. Chemical forms, mobility and deposition of silicon in rice plant. Soil Science and Plant Nutrition. 8(3): 15-21. ttps://doi.org/10.1080/00380768.1962.10430992
Yoshida, S., Ohnishi, Y., and Kitagishi, K. 1962b. Histochemistry of silicon in rice plant: II. Localization of silicon within rice tissues. Soil Science and Plant Nutrition. 8(1): 36-41. https://doi.org/10.1080/00380768.1
Benjamaporn Wangkaew1, Chanakan Thebault Prom-u-thai1,2, Sansanee Jamjod1,2, Benjavan Rerkasem3, and Tonapha Pusadee1*
1Depatment of Plant and Soil Sciences, Faculty of Agriculure, Chiang Mai University, Chiang Mai 50200, Thailand
2Lanna Rice Research Center, Chiang Mai University, Chiang Mai 50200, Thailand
3Plant Genetic Resources and Nutrition Laboratory, Chiang Mai University, Chiang Mai 50200, Thailand
*Corresponding author. E-mail: tonapha.p@cmu.ac.th
Total Article Views
Article history:
Received: August 23, 2018;
Revised: January 23, 2019;
Accepted: January 31, 2019