 ISSN: 2822-0838 Online

Ultrasonic-Assisted Extraction of Bioactive Extract from Napier Grass (Pennisetum purpureum), Evaluation of Its Bioactivity, Antimutagenicity and Cytotoxicity
Kornkanok Thaisungnoen, Muhammad Umar, Manisha Singh, and Anil Kumar Anal *Published Date : January 22, 2024
DOI : https://doi.org/10.12982/NLSC.2024.014
Journal Issues : Number 1, January-March 2024
Abstract The antioxidant characteristics of Napier grass (Pennisetum purpureum) can vary significantly depending on the age of the plant, species, and environmental constraints. In this study, ultrasonic extraction was performed to obtain the bioactive extract from Napier grass. Napier grass at different growth periods (50, 70, and 90 days) was evaluated for phenolic and flavonoid quantity followed by antioxidant activity. The effect of extraction parameters was evaluated using response surface methodology (RSM) with Box-Behnken design. The optimum condition for extraction of bioactive compounds from Napier grass was selected through RSM as 10 mL of ethanol (47.68% v/v) and 50 min of extraction time with ultrasound assisted process (100% amplitude and 20 kHz). The extract from 50 days old grass showed excellent antioxidant properties (68.4 μm Fe (II)/g, 5.1 mg AAE/g, 56.7% of DPPH activity), higher phenolic (8.5 mg GAE/g), flavonoid (3.9 mg QE/g) and protein content (14.9% w/w) which also good antimicrobial and antimutagenic activity. The bioactive extract from 50 days of grass demonstrated strong antimutagenicity (>60%) against sodium azide-induced mutation in S. typhimurium TA 100 strain and did not exhibit a cytotoxic effect on Vero and Caco-2 cells at the concentration of 250 µg/mL and 500 µg/mL, respectively..
Keywords: Napier grass, Ultrasonic extraction, Antioxidant, Antimutagenicity, Cytotoxicity
Funding: This study received financial support from the Royal Thai Government (RTG) Fellowship.
Citation: Thaisungnoen, K., Umar, M., Singh, M., and Anal, A. K. 2024. Ultrasonic-assisted extraction of bioactive extract from napier grass (Pennisetum purpureum), evaluation of its bioactivity, antimutagenicity and cytotoxicity. Natural and Life Sciences Communications. 23(1): e2024014.
INTRODUCTION
Plant extracts are a rich source of phytochemicals that possess numerous medicinal benefits such as flavonoids, essential oils, phenolic compounds, terpenoids, saponins, tannins, alkaloids, and phytochemicals. These phytochemicals come from easily available plant sources, such as tea, berries, lemongrass, ginger, rosemary, basil, etc., and many others have been considered as alternative therapy against various infectious diseases (Mostafa et al., 2018; J. Kim et al., 2020; Doungsaard et al 2023). The extracts from these sources provide several antioxidant and antimicrobial functions (Ahmed et al., 2019). Some epidemiological studies have also indicated evidence of a linkage between the antioxidant compounds and reduced chance of free radical development in the body (Adesso et al., 2016). Moreover, these medicinal plants also exhibit antimutagenicity and protective functions from oxidative damage which are particularly crucial and desirable effects to protect the DNA damage (Sirisa-ard et al., 2023; Meziane et al 2023).
Napier grass (Pennisetum purpureum) rich source of polyphenols and flavonoids is a perennial grass of the Poaceae family that has gained high attention due to its beneficial effects on animal health. Currently, Napier grass is being used in livestock feed in various countries due to its health-promising benefits. However, the composition and bioactive content present in plants generally fluctuate depending on the plant sources, plant parts, growing seasons, and growth periods (D.-S. Kim et al., 2020). The study of two varieties of Napier grass (with dark-purple and green pigmentation) in Taiwan was conducted on polyphenolic profile (anthocyanin, quercetin, rutin, coumaric acid, and epicatechin) which concluded that this grass contains strong antioxidant properties (Ojo et al., 2022). Since Napier grass is widely grown and used in many countries, it should be explored at different growth periods for the maximum production of bioactive compounds (Chemat et al., 2017). In addition, the rich chemical diversity of Napier grass has not yet been fully explored for antimutagenic and cytotoxic activity (Gullon et al., 2017).
There are some studies available on Napier grass about the proximate analysis but there is no study on the extraction of bioactive compounds from Napier grass at different growth periods to evaluate the antioxidant properties at different age of plant. The antimutagenicity, antimicrobial, and cytotoxic activity have also not been studied for Napier grass. Furthermore, ethanol extraction of bioactive using an ultrasound-assisted extraction method has not been used previously which can help extract the polyphenols, flavonoids, and other compounds from grass. Thus, this study aimed at extracting the bioactive compounds from Napier grass at different growth periods and optimizing the extraction parameters such as ethanol concentration, volume, and extraction time using the Box Behnken experimental design. The characterization of bioactive extracts was performed along with the evaluation of antimutagenic activity and cytotoxicity. This study can help identify the harvesting age of grass plants with maximum bioactive properties and health benefits.
MATERIALS AND METHODS
Raw samples and chemicals
Fresh leaves of Napier grass (Pennisetum purpureum) at different growth stages (50, 70, and 90 days old) were harvested from a plantation farm, Department of Animal Science, Kasetsart University, Nakhonprathom, Thailand. All the samples were cut into small pieces and dried in a hot air oven at 40°C, for 72 h. These samples were ground by a high-speed blender (HR2115, Philips, Japan) into fine powders, sieved through a mesh size of 40, and packed in high-density polyethylene (HDPE) bags for further analysis. All the analytical grade chemicals were purchased from CTi & Science Co. Ltd., Thailand. Microorganisms including Staphylococcus aureus, Escherichia coli, Salmonella spp, and Salmonella Typhimurium strain TA 100 purchased from Thailand Institute of Scientific and Technological Research (TISTR).
Proximate analysis
Total solids, protein, fat, and ash percentage were estimated using standard AOAC methods number 923.10, 979.09, 920.39C, and 925.03 respectively with slight modifications (Umar et al., 2023).
Box-behnken design
Ultrasonic conditions of extraction including ethanol concentration (X1, 40, 50, and 60%, v/v), the volume of ethanol (X2, 10, 20, and 30 mL), and extraction time (X3, 10, 30, and 50 min) were optimized through Box-Behnken design using Design-Expert Software (Version 13.1, Stat-Ease Inc., USA) according to method of (Jain and Anal, 2018). The bioactive extraction of Napier grass at different growth stages (50, 70, and 90 days) was optimized using total phenolic content (TPC), total flavonoid content (TFC), antioxidant activity (FRAP, %DPPH inhibition and reducing power) as responses. The experimental design consisted of 15 runs with one central optimized replication point implemented in a randomized manner to decrease the chances of unexpected variations. A quadratic polynomial regression model was used to analyze the data as shown:
Y= β0+∑βiXi+∑βiiXi2+∑βijXiXj
Where Y represents the response variable, β0 is constant, βi, βii,and βij are the linear, quadratic, and interactive coefficients determined by the model, and Xi and Xj are the independent variables, respectively.
Ultrasonic assisted extraction of Napier grass
The bioactive compounds from Napier grass powder were extracted at 25°C using a probe ultrasonic reactor (UP200S, 200 W, Hielscher, Germany) at a fixed 100% amplitude, 0.5 cycles, and frequency of 24 kHz. The extracts were filtered with Whatman filter paper No. 1 and centrifuged at 5,000 rpm for 15 min to collect the supernatant (used as extract). For the evaluation of antimicrobial properties, the ethanol from the extract was evaporated by placing it in a hot air oven at 40°C for 4-6 hr. The extract obtained from the optimized condition was dried in a freeze dryer (Scanvac Cool Safe 55-4, Denmark) for 24 hr. and stored at 4°C in high-density polyethylene bags for further analysis.
Determination of total phenolic content
The total phenolic content of the extract was estimated according to the spectrophotometric method described by (Akbar et al., 2022) with slight modifications, using the Folin-Ciocalteu’s reagent. The 10% (diluted in deionized water) crude extract solution (0.5 mL) was mixed with the 2 mL of Folin-Ciocalteu reagent. The 4 mL of sodium carbonate solution (7.5%, w/v) was added to the solution for neutralization, mixed well, and placed at 25°C for 30 min. The absorbance of the solution was measured at 765 nm using a UV-VIS spectrophotometer (UNICAM, Alva, U.K.). A reference standard curve was prepared by using gallic acid and a linear equation was used to determine the total phenolic contents of the samples expressed as mg gallic acid equivalent (GAE) /g of crude sample.
Determination of total flavonoid content
The 10% (diluted in deionized water) crude extract solution (0.5 mL) was mixed with 1.5 mL of ethanol (95%, v/v), and 0.1 mL of aluminum chloride hexahydrate (10%). After five minutes of incubation at room temperature, 0.1 mL of potassium acetate (1M) was added, and the total volume was adjusted to 2.8 mL by adding distilled water. The mixed solution was further incubated for 40 min at 25ºC and absorbance was measured at 415 nm using a UV-VIS spectrophotometer (UNICAM, Alva, U.K.). The reference standard cure was prepared using quercetin and a linear equation was used to determine the total flavonoid content expressed as mg quercetin equivalent (QE) /g of crude sample (Akbar et al., 2022).
Assay of 1,1- diphenyl-2-picrylhydrazyl (DPPH) free radical scavenging activity
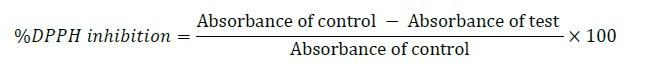
The 1.5 mL of DPPH solution (0.004% in methanol) was mixed with the 1.5 mL of crude extract and incubated at 25°C in a dark place for 30 min (Govindappa et al., 2011). Then the absorbance was measured at 515 nm using a UV-VIS spectrophotometer (UNICAM, Alva, U.K.), and the inhibition percentage was computed using the following equation.
Assay of ferric reducing antioxidant power (FRAP)
FRAP reagent was prepared in acetate buffer (pH 3.6), TPTZ solution (10 mmol) was prepared in HCl (40 mmol) and FeCl3.6H2O solution (20 mmol) in 10:1:1 (v/v) ratio, respectively. The 1.5 mL of the FRAP reagent was mixed with 50 µL of liquid crude extract (diluted 10 times in deionized water) and incubated at 25°C for 4 min. The absorbance was recorded at 593 nm using a UV-VIS spectrophotometer (UNICAM, Alva, U.K.) (Proestos et al., 2013). The standard curve was prepared using FeSO4 solution and results were expressed as µmol of FeSO4 per g of crude sample.
Antibacterial activity
The bacteria (Staphylococcus aureus, Escherichia coli, and Salmonella spp.) were inoculated into broth Mueller Hinton Broth (MHB) and incubated for 16-18 hr. at 37°C. The microbial suspensions were diluted in sterilized distilled water and the concentration of 1x10⁵ cfu/mL was obtained with the McFarland standard method. The spread plate was performed using cotton swabs on Mueller Hinton agar plates (MHA) and plates were punched for 10 mm diameter to create wells. The freeze-dried extract was dissolved in DMSO (20% v/v) to obtain a concentration of 150 mg/mL. It was further diluted using Mueller Hinton Broth (MHB) to a final concentration of 1.17 mg/mL. The 100 μL of each extract was added to the prepared wells and incubated for 24 hrs. at 37°C. The growth was observed after incubation to calculate the diameter of the inhibition zone.
The minimal inhibitory concentration (MIC) was calculated by adding 50 µL of bacterial suspension (1x10⁵ cfu/mL) to each test tube (Figure 1) containing 10 mL of sample prepared in MHB. The 1 mL from each tube was spread on Mueller Hinton Agar plates and incubated at 37°C for 18 hrs. to observe the growth of bacteria (Shaw et al., 2019). The lowest concentration which showed no growth on the plate was considered as MBC for bacteria and MFC for fungal growth and the next concentration which showed little growth was MIC.
Antimutagenicity of napier grass extract
Salmonella typhimurium TA 100 was inoculated in nutrient broth and incubated at 37°C in an orbital shaking incubator (Ohaus ISHD16HDG, USA) at 150 rpm for 18 hrs. After incubation, it was diluted in distilled water to obtain the optical density of 0.3-0.4 measured at 620 nm using a spectrophotometer (UNICAM, Alva, U.K). Sodium azide (1 µg/µL) was sterilized as a positive mutagen without a metabolic activation system. Different concentrations of dried extract (100, 75, and 50 mg/mL) were prepared in DMSO (20% v/v). The 100 µL of sodium azide (1 µg/µL) was mixed with 500 µL of potassium phosphate buffer (0.1M, pH 7.4), 100 µL of each concentration of extract sample, and 100 µL of inoculum. These samples were incubated in a shaking water bath at 37°C, 150 rpm for 20 min. After incubation, 2 mL of top agar containing histidine and biotin (10 µL) was added into each sample before pouring on a glucose minimal agar plate and incubated again at 37°C for 72 hrs. (Saengprakai et al., 2015; Shaw et al., 2019). The colonies were counted after incubation using a digital colony counter (DCC-1, 230 V, China).
% Antimutagenic activity=[(A-B)A]×100
Where, A = Number of positive mutagens revertant colonies, B = Number of revertant colonies after adding the test sample
Cytotoxic activity of extract
Caco2 cell line (ATCC HTB-37) was grown in a complete medium supplemented with 10% heat-inactivated fetal bovine serum, L-glutamine (2mM), non-essential amino acid (0.1mM), Insulin-Transferrin-Selenium-X (0.1IU/mL), sodium bicarbonate (1.5 g/L), penicillin (100 unit/mL) and streptomycin (100 μg/mL) and incubated at 37°C with humidified incubator (5% CO2). The cells at a logarithmic growth were harvested and diluted to 2x10⁴ cells /mL in a complete medium. The ellipticine and DMSO (1% v/v) were used as positive and negative control respectively. 96-well plates were seeded with cell suspension (45 μL) or blank medium (200 μL) and incubated at 37°C in a humidified incubator (5% CO2) for 48 h. The culture medium was replaced with 200 μL fresh medium containing extracted 5 μL of sample dissolved in DMSO (100% v/v), negative or positive control, and incubated for 24 hrs. After incubation, 50 μL of resazurin solution (125 μg/mL) was added and incubated for 4 hrs at 37°C. The fluorescence wavelengths at 530 nm excitation and 590 nm emission were measured using a fluorometer (O’Brien et al., 2000; Neagu et al., 2021).
Vero cell line (Vero, ATCC CCL-81) was maintained in minimal essential medium (MEM) supplemented with 10% heat-inactivated fetal bovine serum, 1 mM sodium pyruvate, 2.2 g/L sodium bicarbonate and 0.8 mg/mL geneticin and incubated at 37°C in a humidified incubator with 5% CO2. The cells at a logarithmic growth were harvested and diluted to 3.3x10⁴ cells/mL suspension in a complete medium without geneticin. Test wells were loaded with 5 μL of samples and 45 μL of cell suspension addition, incubated at 37°C in a humidified incubator with 5% CO2 for 4 days. Fluorescence was measured with excitation and emission wavelengths of 485 and 535 nm respectively.
% Cytotoxicity = [1-(FUT/ FUC)] x100
Where FUT and FUC are the mean fluorescent unit (FU) from cells treated with sample and DMSO (1 and 0.5% v/v for Caco2 and Vero cells respectively).
Statistical analysis
All the experiments were carried out in triplicate and the results were presented as mean values with standard deviation. The SPSS software (SPSS Version 16, Chicago, IL, USA) was employed for conducting the statistical analysis where one-way ANOVA was carried out. The significant differences among the samples were determined using the post hoc Tukey test, having a confidence interval of 95%.
RESULTS
Proximate, bioactive components, and antioxidant activity analysis of Napier grass
The proximate composition and bioactive compounds in Napier grass were estimated and presented in Table 1. The ash content showed no significant difference (P >0.5) at different growth periods and values were 10.39, 10.37, and 10.33% for 50-, 70-, and 90-day-old grass respectively. The obtained ash content values were slightly higher as compared to the ash content (6.90-9.68%, w/w) for Napier grass estimated in previous studies (Lee et al., 2010; Braga et al., 2014; De Conto et al., 2016). The moisture content showed a non-significant difference from 50 to 70 days while it decreased significantly to 6.8%, from 70 to 90 days. The fat content also showed a similar trend during these growth periods and changed from 1.96 to 2.14%, w/w. The protein content showed a significant decrease (P <0.05) from 14.88 to 9.43% (w/w) during these growth periods. TPC and TFC were highest in the extract of 50 days old grass and the lowest values were obtained for the extract of 90 days grass which clearly illustrates that the younger plant leaves contain higher amounts of these bioactive components (Wang et al., 2021).
Table 1. Proximate, bioactive components and antioxidant activity analysis of Napier grass. TPC: Total phenolic contents, TFC: Total Flavonoid Content, RP: Reducing power, FRAP: Ferric Reducing Antioxidant Power, and DPPH scavenging ability.
|
Proximate, Bioactive Components and Antioxidant Activity |
50 Days |
70 Days |
90 Days |
|
Moisture (%) |
7.80 ± 0.10b |
7.80 ± 0.10b |
6.80 ± 0.10a |
|
Ash (%) |
10.40 ± 0.10a |
10.40 ± 0.10a |
10.30 ± 0.20a |
|
Fat (%) |
1.90 ± 0.01a |
2.00 ± 0.10ab |
2.20 ± 0.10b |
|
Protein (%) |
14.90 ± 1.30a |
12.70 ± 0.10b |
9.40 ± 0.40c |
|
TPC (mg GAE/g of the crude sample) |
8.50 ± 0.10a |
7.90 ± 0.20ab |
7.10 ± 0.10b |
|
TFC (mg QE/g of the crude sample) |
3.90 ± 0.10a |
3.20 ± 0.10ab |
2.90 ± 0.10b |
|
FRAP (μm Fe (II)/g of crude sample) |
68.40 ± 1.50a |
67.50 ± 2.30ab |
55.70 ± 2.20b |
|
RP (mg AAE/ g of crude sample) |
5.10 ± 0.20a |
4.80 ± 0.10ab |
4.70 ± 0.10b |
|
DPPH (%) |
56.70 ± 2.00a |
54.60 ± 2.20b |
46.80 ± 1.50c |
Effect of extraction parameters on responses
Total phenolic and flavonoid content extraction
The extraction conditions of ultrasonication for the extraction of bioactive from Napier grass were optimized using statistical tools with response surface methodology (RSM). The association between three factors of the extraction conditions (ethanol volume, concentration, and extraction time) and the yield of TPC from the extract of Napier grass at different growth periods was quadratic. The concentration of ethanol showed a significant effect (P <0.05) on the extraction of phenolic compounds for samples of each growth period. The P-values for the model were <0.05 for all samples while the lack-of-fit analysis also indicated a non-significant difference with all p-values above 0.05 which showed that the fitted models were good for the prediction of TPC within the design space (Table 2).
The concentration of TPC was 8.71-13.44 (50 days old grass extract), 8.28-13.10 (70 days old grass extract), and 7.91-13.05 mg GAE/g (90 days old grass extract), illustrating that the TPC was higher in 50 days old grass samples. RSM indicated higher concentration of ethanol (60%, v/v) caused less extraction of TPC while the less ethanol concentration (40%, v/v) indicated higher extraction of TPC (Figure 1). The effect of ethanol concentration and volume was significant (P <0.05) on the extraction of TPC, and higher concentration can significantly reduce the TPC of extract regardless of grass age. All the solvent volumes of 20 mL or above showed high TPC while the lower amount of solvent (10 mL) caused less extraction of TPC. It has been observed that the extraction time had a non-significant effect on the extraction of TPC content from all the grass samples. The ethanol concentration of 40%, v/v presented a high yield of TPC of all the extracted samples at three different growth periods. The predicted optimal extraction conditions for grass of 50 and 90 days were 10 min, 20 mL ethanol (40%, v/v) and the maximum expected TPC values were 13.77 and 12.87 mg GAE/ g, respectively. The predicted optimal extraction conditions of 70 days old grass were also the same except extraction time which was 30 min and the maximum expected value of TPC was 13.03 mg GAE/ g.
The volume and amount of ethanol significantly (P <0.05) affected the TFC (mg QE/g) extracted from all the samples of grass. Moreover, all the models of 50, 70, and 90 days of the sample had significant effects and the lack-of-fit tests displayed non-significance (P >0.05) indicating that the fitted models were good for the prediction of TFC within the design space. The TFC values were 4.42-6.59, 4.19-6.52, and 3.77-6.47 mg QE/g for 50-, 70-, and 90-day old grass samples respectively. It was observed that the extract from 50-day-old grass contained a higher concentration of TFC than the samples of 70 and 90 days. The response surface graph for the interactive effects demonstrated that the high concentration of ethanol (60%, v/v) resulted in higher TFC, and less concentration of ethanol caused the reverse effect (Figure 1). The predicted optimal conditions for 70-day old grass sample were 10 mL of ethanol (60%, v/v) for an extraction time of 30 min and the maximum expected TFC value was 6.55 mg QE/g. For the extract of both 50 days and 90 days grass samples, the predicted optimal condition of extraction parameters was 20 mL of ethanol (60%, v/v) and extraction time was 50 min with the maximum expected TFC values of 6.55 and 6.28 mg QE/g, respectively.
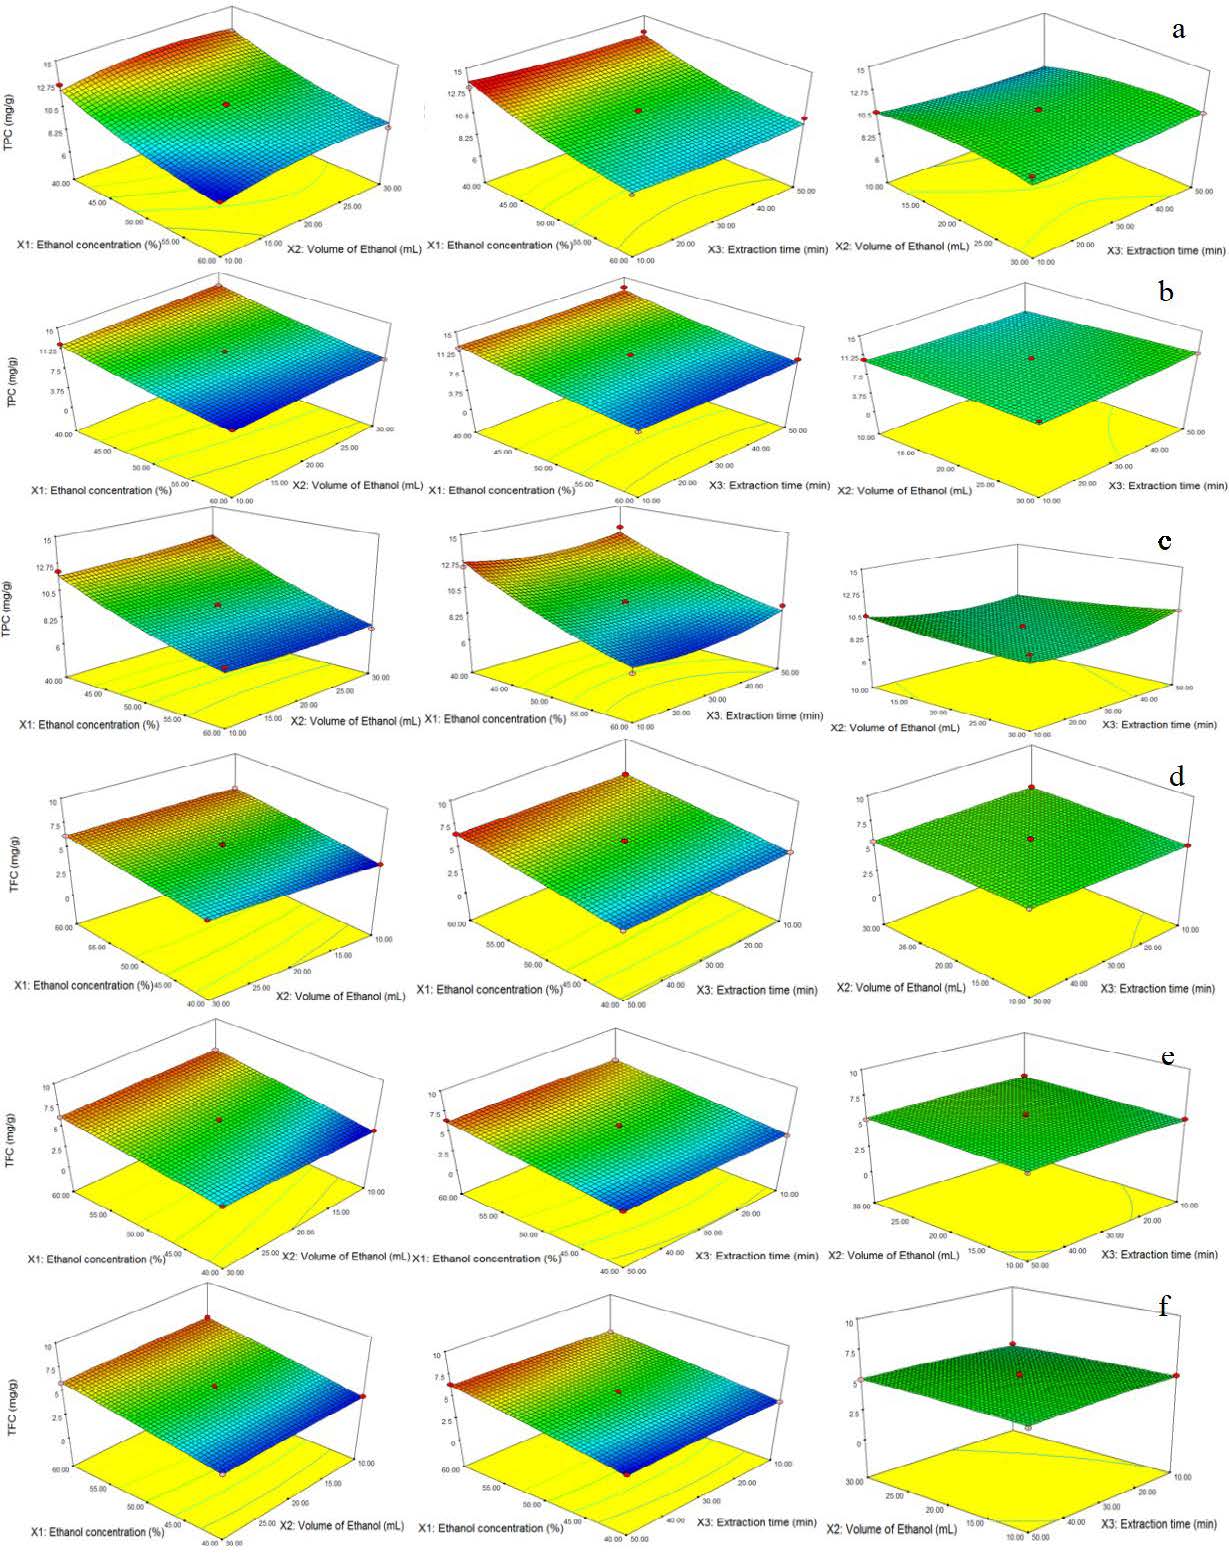
Figure 1. The response surface graphs showing the interactive effects of ethanol concentration (%), volume (mL), and extraction time (minutes) on TPC (mg GAE/g) of grass extract from, a) 50, b) 70, and c) 90 days old grass and on the TFC (mg QE/g) of extracted samples from, d) 50, e) 70, and f) 90 days old grass.
|
Table 2. Effect of Ultra-sonication parameters on total phenolic content (TPC, mg GAE/g) and total flavonoids content (TFC, mg QE/g) of Napier grass extract from 50-, 70- and 90-days old grass determined using box-Behnken. |
||||||||||||
|
|
TPC |
TFC |
||||||||||
|
50 days |
70 days |
90 days |
50 days |
70 days |
90 days |
|||||||
|
Source |
F- Value |
P-Value |
F- Value |
P- Value |
F- Value |
P-Value |
F- Value |
P- Value |
F- Value |
P- Value |
F- Value |
P- Value |
|
Model |
5.610 |
0.036 |
20.09 |
0.002 |
7.031 |
0.024 |
6.331 |
0.028 |
6.161 |
0.029 |
16.09 |
0.004 |
|
X1 |
41.56 |
0.001 |
162.7 |
<0.0001 |
57.11 |
0.001 |
53.71 |
0.001 |
47.81 |
0.001 |
125.8 |
<0.0001 |
|
X2 |
2.080 |
0.209 |
1.771 |
0.244 |
0.081 |
0.792 |
0.951 |
0.373 |
2.011 |
0.215 |
0.111 |
0.758 |
|
X3 |
0.270 |
0.625 |
5.251 |
0.075 |
0.110 |
0.754 |
0.411 |
0.557 |
1.381 |
0.297 |
4.691 |
0.085 |
|
X1X2 |
0.070 |
0.802 |
1.551 |
0.268 |
2.220 |
0.195 |
0.821 |
0.407 |
0.351 |
0.586 |
3.381 |
0.154 |
|
X1X3 |
0.170 |
0.701 |
0.241 |
0.647 |
0.520 |
0.503 |
0.321 |
0.599 |
1.481 |
0.278 |
0.047 |
0.873 |
|
X2X3 |
0.710 |
0.436 |
0.251 |
0.635 |
0.211 |
0.675 |
0.430 |
0.538 |
0.470 |
0.524 |
10.76 |
0.029 |
|
X12 |
2.070 |
0.209 |
0.074 |
0.798 |
0.201 |
0.147 |
0.180 |
0.692 |
0.790 |
0.415 |
0.009 |
0.931 |
|
X22 |
2.630 |
0.165 |
8.441 |
0.036 |
2.931 |
0.595 |
0.110 |
0.757 |
0.220 |
0.664 |
0.001 |
0.985 |
|
X32 |
0.470 |
0.525 |
0.521 |
0.548 |
0.080 |
0.799 |
0.011 |
0.949 |
0.830 |
0.405 |
0.034 |
0.867 |
|
Lack of fit |
5.111 |
0.168 |
9.811 |
0.099 |
3.511 |
0.229 |
0.010 |
0.998 |
1.231 |
0.477 |
7.921 |
0.114 |
|
R2 |
R20.9098 |
R20.9377 |
R20.9475 |
R20.9193 |
R20.9381 |
R20.9847 |
||||||
|
ajR2 |
ajR20.9012 |
ajR20.9124 |
ajR20.9247 |
ajR20.9074 |
ajR20.9072 |
ajR20.9424 |
||||||
Effect of extraction conditions on antioxidant activities
The DPPH radical scavenging activity values of R2 were low for 90 days grass sample and the model and lack of fit were also non-significant. On the other hand, the model was significant (P <0.05) for both 50- and 70-day grass extract samples and lack-of-fit did not show a significant difference indicating that the fitted models were good for the prediction of DPPH values within the design space (Table 3). DPPH scavenging activity of the extracted grass sample of 50, 70, and 90 days were 46.02-83.83, 45.43-83.58, and 6.26-15.93%, respectively. It was found that the extract from 90 days of grass indicated lower DPPH radical scavenging activity than other samples. The ethanol concentration had a significant effect (Figure 2) on samples of 50 and 70 days while a non-significant (P >0.05) effect on the samples of 90 days of grass. The optimal predicted condition of extraction parameters was 20 mL of ethanol (40%, v/v) and 50 min of extraction time for both samples of 50- and 70-days grass with the maximum expected %DPPH inhibition values of 82.23 and 82.13% respectively.
The models and lack of fit for FRAP activity represented a non-significant (P >0.05) effect for all samples of different age grass. This relation indicated that the fitted models were not good for the prediction of FARP values within the design space. The R2 values were also less than <0.5839, <0.8636, and <0.7404 for the extract from 50-, 70-, and 90-day-old grass samples which clearly show less goodness of fit for these models (Table 3). The FRAP values were 50.80-82.98, 66.33-80.32, and 59.71-78.71 µmoles of Fe+2/g, for the extract of 50-, 70-, and 90-day grass samples respectively. The interactive effects of ethanol concentration, volume, and extraction time on the FRAP assay of 50-, 70-, and 90-day grass extract were non-significant (P >0.05) (Figure 2). Higher values of FRAP assay were obtained with 10 min of extraction using a high volume of solvent per g of sample (1:30) (Al-Saeedi et al., 2016).
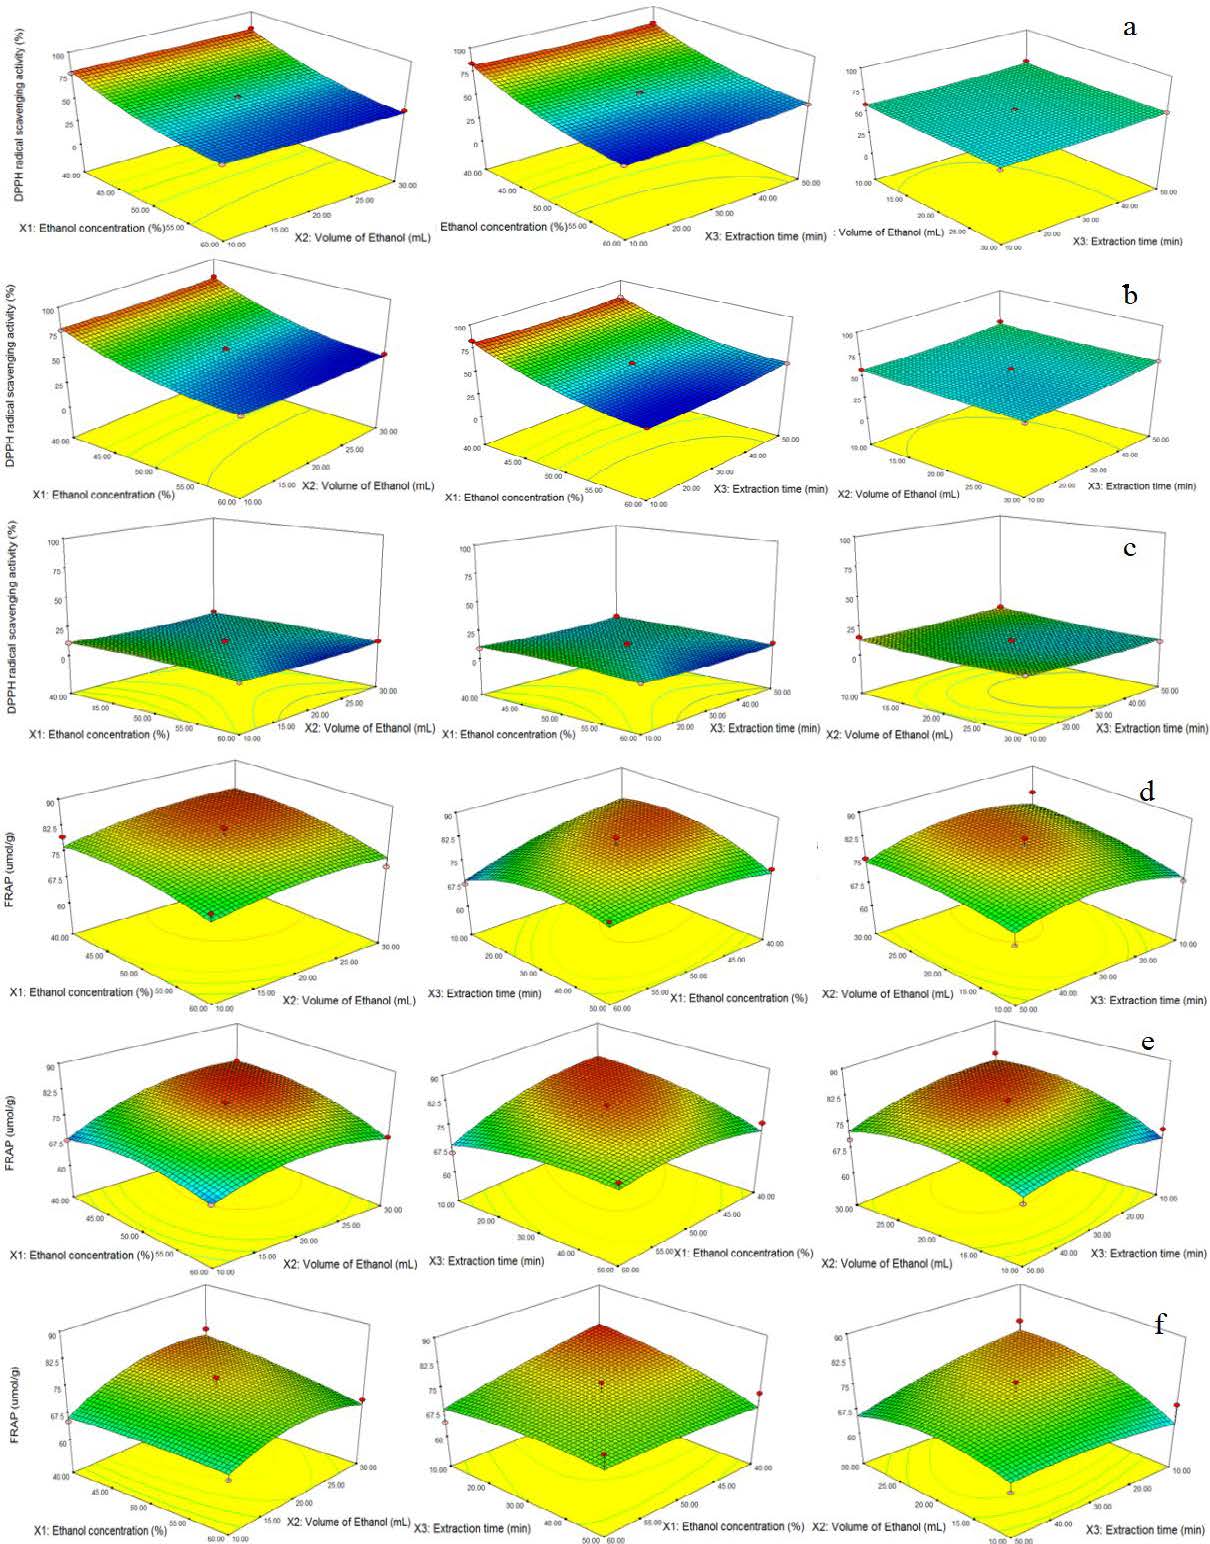
Figure 2. The response surface graphs showing the interactive effects of ethanol concentration (%), volume (mL), and extraction time (min) on %DPPH inhibition of extracted samples from, a) 50, b) 70, and c) 90 days old grass and on FRAP activity (µmoles of Fe+2/g) of samples from d) 50, e) 70, and f) 90 days old grass.
Table 3. Effect of Ultra-sonication parameters on %DPPH inhibition and FRAP activity (µmoles of Fe+2/g) of Napier grass extract from 50-, 70-, and 90-day-old grass determined using box-Behnken.
|
DPPH |
FRAP |
|||||||||||
|
50 days |
70 days |
90 days |
50 days |
70 days |
90 days |
|||||||
|
Source |
F- Value |
P-Value |
F- Value |
P-Value |
F- Value |
P-Value |
F- Value |
P-Value |
F- Value |
P-Value |
F- Value |
P-Value |
|
Model |
40.11 |
0.001 |
47.41 |
0.001 |
0.981 |
0.543 |
1.581 |
0.318 |
3.521 |
0.089 |
0.781 |
0.649 |
|
X1 |
323.2 |
<0.0001 |
372.1 |
<0.0001 |
1.021 |
0.359 |
2.741 |
0.159 |
2.951 |
0.146 |
0.721 |
0.436 |
|
X2 |
1.061 |
0.351 |
1.811 |
0.237 |
1.631 |
0.258 |
1.671 |
0.253 |
8.971 |
0.033 |
1.361 |
0.297 |
|
X3 |
3.321 |
0.128 |
4.752 |
0.082 |
0.931 |
0.378 |
0.041 |
0.847 |
0.621 |
0.468 |
0.731 |
0.433 |
|
X1X2 |
0.941 |
0.377 |
1.641 |
0.257 |
0.061 |
0.818 |
0.091 |
0.775 |
1.611 |
0.261 |
0.411 |
0.551 |
|
X1X3 |
1.571 |
0.265 |
2.051 |
0.213 |
0.001 |
0.998 |
3.021 |
0.147 |
5.231 |
0.079 |
0.891 |
0.388 |
|
X2X3 |
0.211 |
0.674 |
0.391 |
0.559 |
0.531 |
0.501 |
0.451 |
0.532 |
1.681 |
0.257 |
1.131 |
0.336 |
|
X12 |
30.01 |
0.003 |
40.81 |
0.001 |
1.191 |
0.325 |
1.071 |
0.349 |
3.411 |
0.124 |
0.041 |
0.859 |
|
X22 |
0.091 |
0.777 |
0.741 |
0.429 |
1.881 |
0.229 |
0.761 |
0.433 |
6.591 |
0.053 |
1.631 |
0.258 |
|
X32 |
1.251 |
0.314 |
4.531 |
0.087 |
1.341 |
0.299 |
5.091 |
0.076 |
2.081 |
0.208 |
0.241 |
0.648 |
|
Lack of fit |
8.461 |
0.108 |
10.82 |
0.863 |
1.191 |
0.487 |
4.301 |
0.195 |
8.151 |
0.113 |
9.441 |
0.097 |
|
R2 |
R20.9863 |
R20.9884 |
R20.6377 |
R20.5839 |
R20.8636 |
R20.7404 |
||||||
|
ajR2 |
ajR20.9543 |
ajR20.9723 |
ajR20.5897 |
ajR20.5487 |
ajR20.8475 |
ajR20.7139 |
||||||
The bioactive extract obtained from 50-day-old Napier grass samples was selected for higher bioactivity due to significantly higher concentrations of TPC, TFC, and antioxidant activity. The extraction conditions providing maximum yield of TPC, TFC, and antioxidant activities such as % DPPH scavenging ability, and FRAP activity were optimized. The responses can be converted into desirable values between 0 and 1 providing the minimum and maximum values of adjusted R2. The point with maximum desirability of 0.58 (10 mL of ethanol (47.68%, v/v) and 50 min of extraction time) was selected as the optimum condition for extraction of bioactive compounds from 50-day-old grass samples. It was observed that all the experimental values (TPC: 10.98 mg GAE/g, TFC: 6.51 mg QE/g, % DPPH scavenging activity: 82.87, FRAP 143.1 µmol/g) were higher than the predicted values of the model. The experimental FRAP value was significantly higher than the predicted value due to a higher concentration of TPC (Bursal and Köksal, 2011).
Antimicrobial activity of extract
In the present study, the Napier grass extract was less efficient against gram-negative bacteria. None of the extract from 70 days and 90 days of Napier grass presented antibacterial and antifungal activity against any microorganisms tested. However, the 50 days old Napier grass extract presented antimicrobial activity with the inhibition zone of 15 mm against Staphylococcus aureus, 16.67 mm against Escherichia coli, 14.67 mm against Salmonella spp., and 19 mm against Aspergillus niger. The MIC, MBC, and MFC were only analyzed for the extract of 50-day-old grass samples with optimized ultrasonic assistant extraction conditions (10 mL of ethanol (47.68%, v/v) and 50 min of extraction time). The MIC and MBC values of Escherichia coli and Salmonella spp. were 75 mg/mL and 150 mg/mL, while for Staphylococcus aureus were 37.5 mg/mL and 75 mg/mL, respectively. The MIC and MFC against Aspergillus niger were also 37.5 mg/mL and 75 mg/mL respectively (Figure 3).
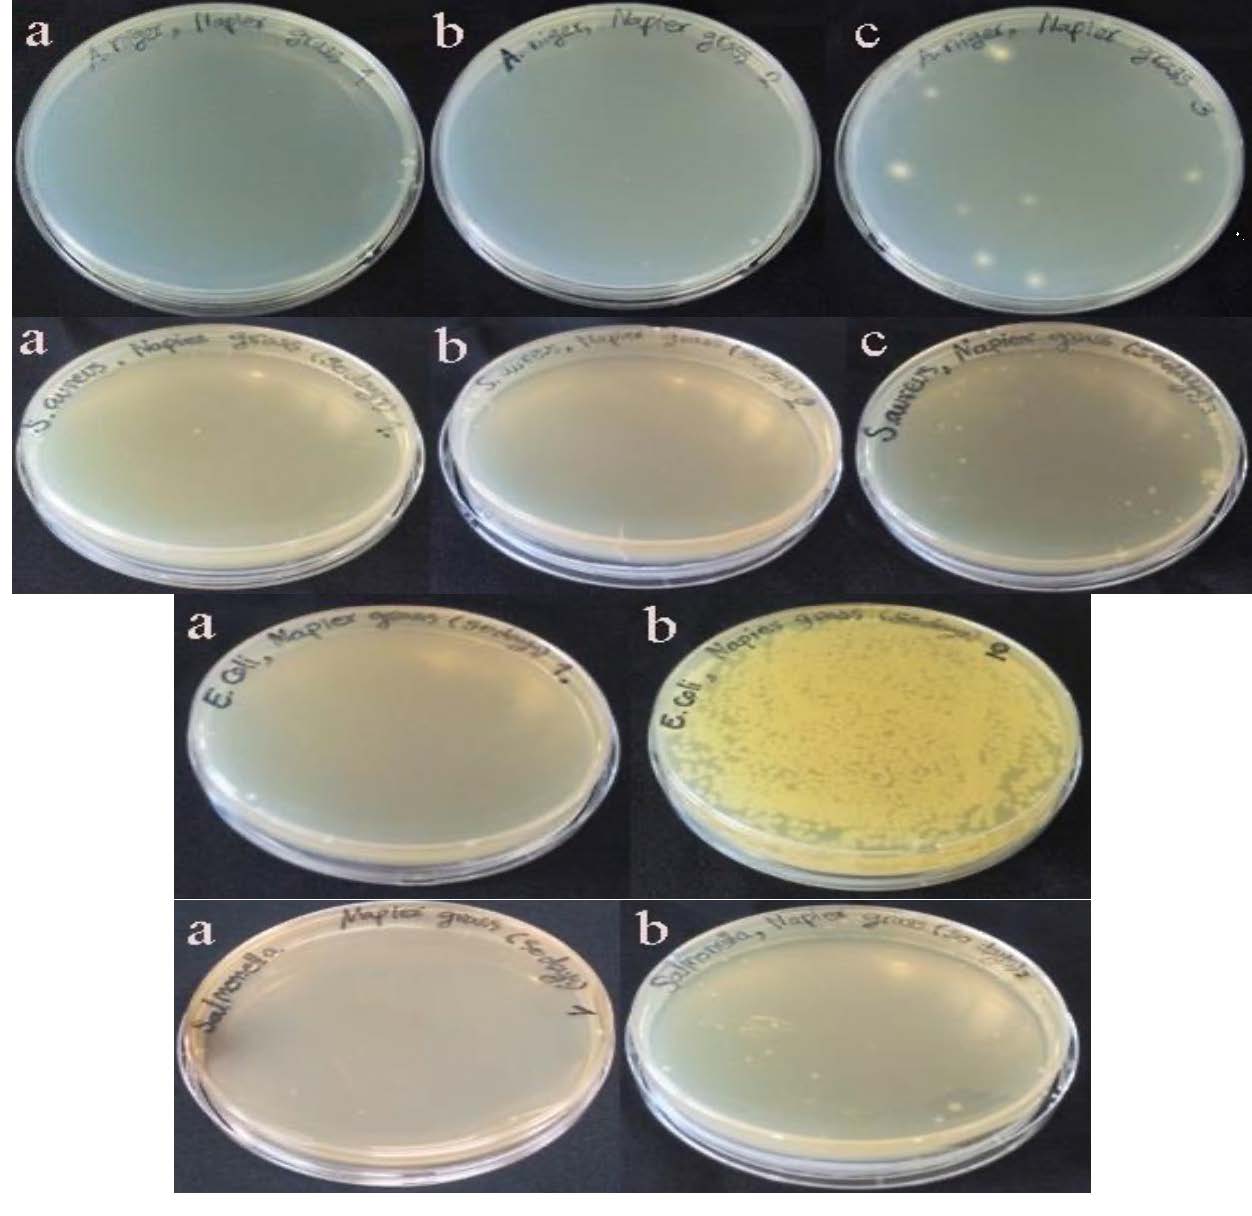
Figure 3: The MIC and MBC for Staphylococcus aureus, Escherichia coli and Salmonella spp. and MIC and MFC for Aspergillus niger. Where a, b, and c are 150, 75 and 37.5 mg/mL concentrations of bioactive extract from 50 days old grass samples respectively.
Antimutagenic activity of the extract
The antimutagenic potential of extract from 50-day-old Napier grass was tested against Salmonella typhimurium tester strains (TA 100). The 1 μg/μL of sodium azide (NaN3) was used as a positive control and the Napier grass extract showed a strong antimutagenic effect (>60%) against sodium azide-induced mutation in S. typhimurium TA 100 strain (Figure 4). The inhibition mutagenicity of S. typhimurium TA 100 was 76.70, 83.41, and 86.64% for 100, 75, and 50 mg/mL of extract.
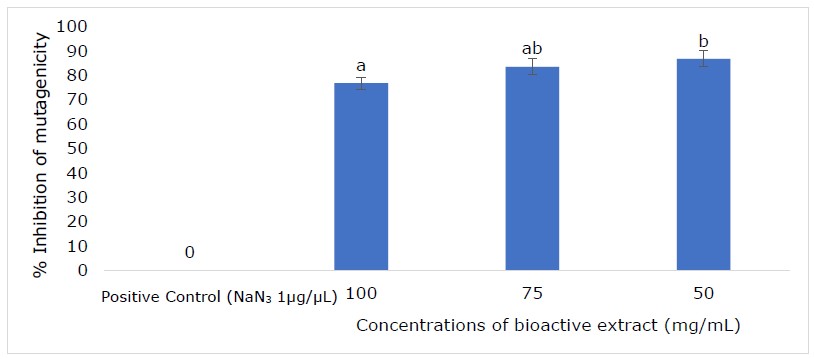
Figure 4. Antimutagenic activity of bioactive extract from 50-day-old grass sample against S. typhimurium TA 100.
Cytotoxicity assay
The extract from the grass was dried into powder using the freeze-drying method for cytotoxicity analysis. The cytotoxicity analysis of Napier grass extract (50 days old) was conducted in the concentration range of 15.63-500 µg/mL on Caco2 cells in vitro (Figure 5). The bioactive extract showed no cytotoxic effect on Vero cells while positive control showed higher cytotoxicity in the range of 20-40 µg/mL. The cytotoxicity of bioactive extract in the concentration of 250-15.63 µg/mL was also observed for Vero cells and results showed that cytotoxicity was 17 to 2% for this concentration range of extract.

Figure 5. a) The cytotoxic effect of bioactive extract from 50 days old Napier grass, b) cytotoxic effect of negative (NC, 1% DMSO) and positive control (ellipticine) on Caco2 cells, c) cytotoxic effect of bioactive extract from 50 days old Napier grass, and d) cytotoxic effect of negative (NC, 0.5% DMSO) and positive control (ellipticine) on Vero cells.
DISCUSSION
Proximate and bioactive components analysis of Napier grass
Higher ash content is related to higher concentrations of minerals such as calcium, phosphorus, and zinc (Mohammed et al., 2015). Some previous studies obtained higher moisture content (10.04-12.6%, w/w) in Napier grass, this difference in moisture content can be related to growth season, environmental changes, and the maturation stage of plant (Strezov et al., 2008; Braga et al., 2014). These values of fat content are in good agreement with the previously obtained values (1.9-2.0%, w/w) of fat content in similar growth periods (Savitha, 2012). In a previous study on different heights of Napier grass, it was observed that protein content changes from 13.29 to 4.79% (w/w) (Aganga et al., 2005). These results indicated that the old grass contains less quantity of protein as compared to immature or younger grass leaves. Similarly, since the antioxidant properties also depend on the concentrations of TFC or TPC, the antioxidant properties (DPPH, FRAP, and RP) were also higher for the extract obtained from 50-day-old grass. These results indicate that the older plant is not a suitable option to obtain the maximum bioactive components and harvesting at an early stage (50 days old grass) can provide promising health benefits due to a higher number of bioactive components and higher antioxidant properties. A similar trend for the concentration of TPC was observed in a previous study (Mekinić et al., 2019).
Extraction of total phenolic and flavonoid content
In a previous study, TPC in Napier grass was observed to be 36.33 mg GAE/g extracted with boiling water (Patra et al., 2016). In our study, the values of TPC differ from the values obtained in the previous study due to different methods and solvents (ethanol) used for extraction (Ferreira & Pinho, 2012). It has been reported that the volume of solvent is an important factor in the extraction of anthocyanin (Ryu and Koh, 2019). Furthermore, the concentration of ethanol and extraction time also had a significant effect on the extraction of TPC. In contrast, the volume of ethanol and extraction time had a non-significant effect (P >0.05) on the extraction of TPC. This effect could be due to less solubility of phenolic compounds in high ethanol (Ferreira and Pinho, 2012). Similarly, It was reported that the aqueous extraction of TPC from leaves and fruit of jujubes (Ziziphus jujuba Mill.) contains higher TPC (22.33 mg GAE/ g) as compared to less TPC content (18.17 mg GAE/ g) when extracted using ethanol (Al-Saeedi et al., 2016). It has been also reported previously that the extraction time from 40 to 100 min showed no effect on the extraction of anthocyanin from mulberry (Zou et al., 2011). It has been reported that the TFC in Napier grass was 14.695 mg QE/g extracted using boiling water (Ye et al., 2007). The TFC obtained in this study was significantly low as compared to the previous study due to the use of different extraction solvents (Ferreira and Pinho, 2012). The extraction time was also less than in the previous study and TFC show less solubility in ethanol as compared to water (Wang et al., 2021). Islas et al., (2020) also indicated that the use of different solvents for the extraction of TFC from crude leaves of neem (Azadirachta indica) results in different concentrations such as 4.91, 4.01, 3.57, 0.63, and 5.29 mg QE/g using hexane, chloroform, ethyl acetate, butanol, and methanol respectively. Hence, the percentage of ethanol concentration can significantly increase the TFC of all grass samples. Similar results were reported in previous studies using a higher concentration of methanol (80%, v/v) and ethanol (72%, v/v) (Pan et al., 2012; Ghasemzadeh et al., 2014). Flavonoids can be non-polar compounds which are dissolved in high ethanol concentrations and polar compounds which are dissolved in low ethanol concentrations 35. Moreover, the polarity of ethanol is less than water causing the dissolution of non-polar flavonoid from the grass extract, however, the solubility of TFC is less in ethanol as compared to water (Al-Saeedi et al., 2016). The effect of ethanol concentration and extraction time was also significant (P <0.05) on the extraction of TFC from all grass samples while the relationship between ethanol volume and extraction time showed a non-significant (P >0.05) effect on the total flavonoid content (Figure 2). Similar results were reported for the extraction time of anthocyanin from mulberry (Zou et al., 2011; Zhang et al., 2020). The volume of solvent did not show any significant effect on the extraction of TFC from all grass samples of different growth periods.
Effect of extraction conditions on antioxidant activities
The synthesis of bioactive compounds in plants depends on the growth period, several bioactive compounds were generated from young plants while some bioactive compounds were generated from mature plants (Ryu and Koh, 2019). In particular, the major responsible for the antioxidant activity was the synergistic action of phenolic compounds. The antioxidant activity also depends on the species of plants, parts of plants, growth periods, and their chemical structures (Al-Saeedi et al., 2016). It has been observed that different parts of Napier grass such as leaves and stems showed different DPPH inhibition ranging from 60.06 to 0.67% (Tsai et al., 2008). It was observed that the value of DPPH activity increased when the ethanol concentration was decreased. However, the relationship between ethanol volume and extraction time showed a non-significant effect on the DPPH activity of all samples. The younger grass extract contains higher concentrations of bioactive compounds (TPC and TFC) which imparts the higher DPPH activity for these samples while the mature (90 days old) grass samples contain less concentration of bioactive compounds which generates less DPPH activity which cannot be enhanced by increasing the extraction time for these samples (Ferreira and Pinho, 2012). The extraction solvent has a high impact on the reducing power of phenolics present in the extract which act as reducing agents causing the reduction of Fe+3 to Fe+2 (Wang et al., 2021). The reduction capabilities of these antioxidants decrease in the ethanol. Similarly, in the extraction of bioactive compounds from sumac (Rhus Coriaria L.) with ethanol and water, the FRAP capability of water extract was significantly higher than ethanol extract (Bursal and Köksal, 2011).
Antimicrobial activity of extract
Antimicrobial activity is related to the chemical composition of plant extracts and all the plant extracts containing phenolic compounds show antibacterial activity against different pathogenic bacteria. For example, rosemary extract showed more phenolic compounds and indicated high antimicrobial activity (Moreno et al., 2006; Klancnik et al., 2009). The major reason for less bacterial susceptibility was its lipopolysaccharide covering in gram-negative bacteria can restrict the diffusion of bioactive compounds. Similarly, it was also found that the young whole plant of Napier grass extract showed antimicrobial activity against Staphylococcus aureus, Escherichia coli, and Aspergillus niger (Talebi et al., 2009; Mambe et al., 2016). The grass extract was less effective against gram-negative bacteria as compared to previously reported data. In a previous study, it was reported that the young whole Napier grass extract showed a MIC value of 1024 μg/mL against Escherichia coli, 512 μg/mL against Enterobacter aerogenes, Klebsiella pneumoniae, Providencia stuartii and Pseudomonas aeruginosa (Mambe et al., 2016). Less effectiveness of grass extract could be due to many reasons including extraction method, extraction solvent, and physiological conditions of plants (Tsai et al., 2008). Since in this study, only leaves of grass were used to extract the bioactive compounds from the plant, this can also affect the antibacterial activity of grass against these strains of leaves. In a previous study, the whole plant was used to obtain the extract and was tested against these strains which can have more effectivity due to different parts of plants included in the extraction (Islam et al., 2003).
Antimutagenic activity of the extract
A significant difference (P <0.05) was observed between 100 and 50 mg/mL of bioactive extract to produce an antimutagenic effect on S. typhimurium TA 100. Higher concentrations of extract had less antimutagenic impact as compared to less concentration (50 mg/mL). The presence of phenolic compounds such as chlorogenic, caffeic and catechins can boost the ability to generate antimutagenic activity. The younger leaves of grass (50 days old) may have more concentration of these compounds as compared to older grass which caused the antimutagenic activity against S. typhimurium TA 100. It has been reported that phenolic compounds from various natural plant-based sources provide more potential antimutagenicity (Satish et al., 2013; Babbar et al., 2015).
Cytotoxicity of bioactive extract
When a substance is cytotoxic, it can induce cell death through different mechanisms, such as disrupting cellular structures, interfering with essential cellular processes, or triggering apoptosis (programmed cell death) (Chittasupho et al., 2023). In drug development, assessing cytotoxicity is crucial to determine the safety and efficacy of potential therapeutics (Maneechai et al., 2023). Most plant-based natural extract contains phenolic and flavonoid compounds which may have cytotoxic activity (Singh et al., 2022). Good natural medicinal plant extract should not show any cytotoxicity on Vero and Caco2 cells. Positive control showed higher cytotoxicity of 67 and 70% for the concentrations of 2 and 4 µg/mL of ellipticine respectively. Several polyphenols and flavonoids isolated from different parts of different plant species have been reported to show cytotoxic activity (Uddin et al., 2011; Akter et al., 2014). However, no cytotoxicity of Napier grass extract on both cell lines indicated the absence of these compounds in Napier grass.
CONCLUSION
The optimization of the ultrasonic-assisted extraction conditions for bioactive constituents from Napier grass in different growth periods (50, 70, and 90 days) showed higher concentrations of TPC, TFC, and antioxidant activity (scavenging activity of 1,1-diphenyl-2-picrylhydrazyl radical and ferric reducing antioxidant power) of younger grass leaves as compared to mature grass leaves. The effect of independent variables, ethanol concentration volume, and extraction time was significant (P <0.05) on all the responses determined by response surface methodology using with Box-Behnken experimental design. Furthermore, the bioactive extract of 50 days old grass showed good antimicrobial and anti-fungal activity against Staphylococcus aureus, Escherichia coli, Salmonella spp., and Aspergillus niger. Moreover, bioactive extract also showed antimutagenic activity against S. typhimurium TA 100, and no cytotoxicity was observed in vitro for Caco2 and Vero cell lines. The Napier grass extract at the age of 50 days can be a good potential source of bioactive compounds with good antioxidant, antimicrobial, antifungal activity, and antimutagenicity.
ACKNOWLEDGMENT
The authors are especially indebted to Mr. Worathep Chompunit, at the Department of Animal Science, Faculty of Agriculture, Kasetsart University, Nakhon Pathom for his help and support in obtaining the Napier grass for experimentation.
AUTHOR CONTRIBUTIONS
Kornkanok Thaisungnoen: Investigation of data, data analysis & writing of the original draft.
Muhammad Umar: Investigation of data, data analysis & writing of the original draft.
Manisha Singh: Supervision, Project management & funding acquisition.
Anil Kumar Anal: Supervision, Funding acquisition, Project administration & final editing.
CONFLICT OF INTEREST
The authors declare that they hold no competing interests.
REFERENCES
Adesso, S., Pepe, G., Sommella, E., Manfra, M., Scopa, A., Sofo, A., Tenore, G. C., Russo, M., Di Gaudio, F., Autore, G., Campiglia, P., and Marzocco, S. 2016. Anti-inflammatory and antioxidant activity of polyphenolic extracts from Lactuca sativa (var. Maravilla de Verano) under different farming methods. Journal of the Science of Food and Agriculture. 96(12): 4194–4206.
Aganga, A. A., Omphile, U. J., Thema, T., and Baitshotlhi, J. C. 2005. Chemical composition of Napier grass (Pennisetum purpureum) at different stages of growth and Napier grass silages with additives. Journal of Biological Sciences. 5(4): 493–496.
Ahmed, A. F., Attia, F. A. K., Liu, Z., Li, C., Wei, J., and Kang, W. 2019. Antioxidant activity and total phenolic content of essential oils and extracts of sweet basil (Ocimum basilicum L.) plants. Food Science and Human Wellness, 8(3), 299–305.
Akbar, A., Gul, Z., Aziz, S., Sadiq, M. B., Achakzai, J. K., Saeed, S., Chein, S. H., and Sher, H. 2022. Bio-functional potential and biochemical properties of propolis collected from different regions of Balochistan Province of Pakistan. Oxidative Medicine and Cellular Longevity. 2022: 7585406.
Akter, R., Uddin, S. J., Grice, I. D., and Tiralongo, E. 2014. Cytotoxic activity screening of Bangladeshi medicinal plant extracts. Journal of Natural Medicines. 68: 246–252.
Al-Saeedi, A. H., Al-Ghafri, M. T. H., and Hossain, M. A. 2016. Comparative evaluation of total phenols, flavonoids content and antioxidant potential of leaf and fruit extracts of Omani ziziphus jujuba L. Pacific Science Review A: Natural Science and Engineering, 18(1), 78–83.
Babbar, N., Oberoi, H. S., andSandhu, S. K. 2015. Therapeutic and nutraceutical potential of bioactive compounds extracted from fruit residues. Critical Reviews in Food Science and Nutrition. 55(3): 319–337.
Braga, R. M., Melo, D. M. A., Aquino, F. M., Freitas, J. C. O., Melo, M. A. F., Barros, J. M. F., and Fontes, M. S. B. 2014. Characterization and comparative study of pyrolysis kinetics of the rice husk and the elephant grass. Journal of Thermal Analysis and Calorimetry. 115: 1915–1920.
Bursal, E. and Köksal, E. 2011. Evaluation of reducing power and radical scavenging activities of water and ethanol extracts from Sumac (Rhus coriaria L.). Food Research International. 44(7): 2217–2221.
Chemat, F., Rombaut, N., Sicaire, A. G., Meullemiestre, A., Fabiano-Tixier, A. S., and Abert-Vian, M. 2017. Ultrasound assisted extraction of food and natural products. Mechanisms, techniques, combinations, protocols and applications. A review. Ultrasonics Sonochemistry. 34: 540–560.
Chittasupho, C., Samee, W., Tadtong, S., Jittachai, W., Managit, C., and Athikomkulchai, S. 2023. Cytotoxicity, apoptosis induction, oxidative stress, and cell cycle arrest of Clerodendrum chinense flower extract nanoparticles in HeLa cells. Natural and Life Sciences Communications. 22(4): e2023057.
De Conto, D., Silvestre, W. P., Baldasso, C., and Godinho, M. 2016. Performance of rotary kiln reactor for the elephant grass pyrolysis. Bioresource Technology. 218: 153–160.
Doungsaard, P., Chansakaow, S., Poomanee, W., Sirithunyalug, J., Intasai, N., and Leelapornpisid, P. 2023 Antioxidant, anti-tyrosinase, antiglycation and safety of longan leaf extract for cosmeceutical application. Natural and Life Sciences Communications. 22(3): e2023052.
Ferreira, O. and Pinho, S. 2012. Solubility of flavonoids in pure solvents. Industrial & Engineering Chemistry Research. 51: 6586–6590.
Ghasemzadeh, A., Jaafar, H. Z. E., Karimi, E., and Rahmat, A. 2014. Optimization of ultrasound-assisted extraction of flavonoid compounds and their pharmaceutical activity from curry leaf (Murraya koenigii L.) using response surface methodology. BMC Complementary and Alternative Medicine. 14(1): 318.
Govindappa, M., Naga Sravya, S., Poojashri, M. N., Sadananda, T. S., Chandrappa, C. P., Santoyo, G., Sharanappa, P., and Anil Kumar, N. V. 2011. Antimicrobial, antioxidant and in vitro anti-inflammatory activity and phytochemical screening of water extract of Wedelia trilobata (L.) Hitchc. Journal of Medicinal Plants Research. 5(24): 5718–5729.
Gullon, B., Lú-Chau, T. A., Moreira, M. T., Lema, J. M., and Eibes, G. 2017. Rutin: A review on extraction, identification and purification methods, biological activities and approaches to enhance its bioavailability. Trends in Food Science \& Technology. 67: 220–235.
Islam, M. R., Saha, C. K., Sarker, N. R., Jalil, M. A., and Hasanuzzaman, M. 2003. Effect of variety on proportion of botanical fractions and nutritive value of different Napier grass (Pennisetum purpureum) and relationship between botanical fractions and nutritive value. Asian-Australasian Journal of Animal Sciences. 16(6): 837–842.
Islas, J. F., Acosta, E., Zuca, G., Delgado-Gallegos, J. L., Moreno-Treviño, M. G., Escalante, B., Moreno-Cuevas, J. E., et al. 2020. An overview of Neem (Azadirachta indica) and its potential impact on health. Journal of Functional Foods. 74: 104171.
Jain, S. and Anal, A. K. 2018. Preparation of eggshell membrane protein hydrolysates and culled banana resistant starch-based emulsions and evaluation of their stability and behavior in simulated gastrointestinal fluids. Food Research International. 103: 234–242.
Kim, D.-S., Choi, M.-H., and Shin, H.-J. 2020. Extracts of Moringa oleifera leaves from different cultivation regions show both antioxidant and antiobesity activities. Journal of Food Biochemistry. 44(7): e13282.
Kim, J., Pälijärvi, M., Karonen, M., and Salminen, J. P. 2020. Distribution of enzymatic and alkaline oxidative activities of phenolic compounds in plants. Phytochemistry. 179: 112501.
Klancnik, A., Guzej, B., Kolar, M. H., Abramovic, H., and Mozina, S. S. 2009. In vitro antimicrobial and antioxidant activity of commercial rosemary extract formulations. Journal of Food Protection. 72(8): 1744–1752.
Lee, M.-K., Tsai, W.-T., Tsai, Y.-L., and Lin, S.-H. 2010. Pyrolysis of Napier grass in an induction-heating reactor. Journal of Analytical and Applied Pyrolysis. 88(2): 110–116.
Mambe, F. T., Voukeng, I. K., Beng, V. P., and Kuete, V. 2016. Antibacterial activities of methanol extracts from Alchornea cordifolia and four other Cameroonian plants against MDR phenotypes. Journal of Taibah University Medical Sciences. 11(2): 121–127.
Maneechai, P., Leelapornpisid, P., and Poomanee, W. 2023. Multifunctional biological activities and cytotoxic evaluation of Bouea macrophylla for cosmetic applications. Natural and Life Sciences Communications. 22(2): e2023030.
Mekinić, I. G., Ljubenkov, I., Možina, S. S., Abramović, H., Šimat, V., Katalinić, A., Novak, T., and Skroza, D. 2019. Abiotic factors during a one-year vegetation period affect sage phenolic metabolites, antioxidants and antimicrobials. Industrial Crops and Products. 141: 111741.
Meziane, Y., Yakoubi, R., Megateli, S., and Chaouia, C. 2023. In vitro assessment of total bioactive contents and antioxidant capacity of grape juices extracts of table and wine varieties from Algeria and their correlations. Natural and Life Sciences Communications. 22(3): e2023050
Mohammed, I. Y., Abakr, Y. A., Kazi, F. K., Yusup, S., Alshareef, I., and Chin, S. A. 2015. Comprehensive characterization of Napier grass as a feedstock for thermochemical conversion. Energies. 8(5): 3403–3417.
Moreno, S., Scheyer, T., Romano, C. S., and Vojnov, A. A. 2006. Antioxidant and antimicrobial activities of rosemary extracts linked to their polyphenol composition. Free Radical Research. 40(2): 223–231.
Mostafa, A. A., Al-Askar, A. A., Almaary, K. S., Dawoud, T. M., Sholkamy, E. N., and Bakri, M. M. 2018. Antimicrobial activity of some plant extracts against bacterial strains causing food poisoning diseases. Saudi Journal of Biological Sciences. 25(2): 361–366.
Neagu, G., Stefaniu, A., Albulescu, A., Pintilie, L., and Pirvu, L. C. 2021. Antiproliferative activity of Stokesia laevis ethanolic extract in combination with several food-related bioactive compounds; In vitro (Caco-2) and in silico docking (TNKS1 and TNKS2) studies. Applied Sciences. 11(21): 9944.
O’Brien, J., Wilson, I., Orton, T., and Pognan, F. 2000. Investigation of the Alamar blue (resazurin) fluorescent dye for the assessment of mammalian cell cytotoxicity. European Journal of Biochemistry. 267(17): 5421–5426.
Ojo, O. A., Ojo, A. B., Barnabas, M., Iyobhebhe, M., Elebiyo, T. C., Evbuomwan, I. O., Michael, T., Ajiboye, B. O., Oyinloye, B. E., and Oloyede, O. I. 2022. Phytochemical properties and pharmacological activities of the genus Pennisetum: A review. Scientific African. 16: e01132.
Pan, G., Yu, G., Zhu, C., and Qiao, J. 2012. Optimization of ultrasound-assisted extraction (UAE) of flavonoids compounds (FC) from hawthorn seed (HS). Ultrasonics Sonochemistry. 19(3): 486–490.
Patra, J. K., Kwon, Y., and Baek, K.-H. 2016. Green biosynthesis of gold nanoparticles by onion peel extract: Synthesis, characterization and biological activities. Advanced Powder Technology. 27(5): 2204–2213.
Proestos, C., Sinanoglou, V., Ζουμπουλάκης, Π., and Sinanoglou, V. 2013. Determination of plant bioactive compounds. Antioxidant capacity and antimicrobial screening. Focusing on Modern Food Industry (FMFI). 2(1): 26–35.
Ryu, D. and Koh, E. 2019. Optimization of ultrasound-assisted extraction of anthocyanins and phenolic compounds from black soybeans (Glycine max L.). Food Analytical Methods. 12: 1382–1389.
Saengprakai, J., Sikkhamondhol, C., Ruengrit, N., Iamtham, S., and others. 2015. Mutagenic activity of Nua powder extracts by Ames test. ISSAAS, 21(2): 56–66.
Satish, A., Kumar, R. P., Rakshith, D., Satish, S., and Ahmed, F. 2013. Antimutagenic and antioxidant activity of Ficus benghalensis stem bark and Moringa oleifera root extract. International Journal of Chemical and Analytical Science. 4(2): 45–48.
Savitha, A. 2012. Performance of hybrid Napier cultivars under rainfed conditions. Department of Agronomy, College of Horticulture, Vellanikkara.
Shaw, H. M., Lin, J. B., and Wang, M. S. 2019. Study on anti-mutagenic effect of extracts from purple napier grass and other functional grasses. Journal of the Chinese Society of Animal Science. 48: 278.
Singh, Y. D., Jena, B., Ningthoujam, R., Panda, S., Priyadarsini, P., Pattanayak, S., Panda, M. K., Singh, M. C., and Satapathy, K. B. 2022. Potential bioactive molecules from natural products to combat against coronavirus. Advances in Traditional Medicine. 22(2): 259–270.
Sirisa-Ard, P., Pholsonklam, K., Xuyen, D. T., Hang, D. T. D., Chinh, V. D., Kim, L. T., da Cruz, Z.V.,Sorncharoen, P., and Nithikathkul, C. 2023. Chemical composition, antibacterial and antioxidant activities of extracts from dry leaves and ash-dry leaves of Luffa cylindrica (L.) roem cultivated in Vietnam. Asian Journal of Research in Medical and Pharmaceutical Sciences. 12(4): 38-51.
Strezov, V., Evans, T. J., and Hayman, C. 2008. Thermal conversion of elephant grass (Pennisetum purpureum Schum) to bio-gas, bio-oil and charcoal. Bioresource Technology. 99(17): 8394–8399.
Talebi, A. A., Rakhshani, E., Fathipour, Y., Star\`y, P., Tomanović, Ž., and Rajabi-Mazhar, N. 2009. Aphids and their parasitoids (Hym., Braconidae: Aphidiinae) associated with medicinal plants in Iran. American-Eurasian Journal of Sustainable Agriculture. 3(2): 205–219.
Tsai, P. J., Wu, S. C., and Cheng, Y. K. 2008. Role of polyphenols in antioxidant capacity of Napier grass from different growing seasons. Food Chemistry. 106(1): 27–32.
Uddin, S. J., Grice, I. D., Tiralongo, E., and others. 2011. Cytotoxic effects of Bangladeshi medicinal plant extracts. Evidence-Based Complementary and Alternative Medicine, 2011.
Umar, M., Ruktanonchai, U. R., Makararpong, D., and Anal, A. K. 2023. Compositional and functional analysis of freeze-dried bovine skim colostrum powders. Journal of Food Measurement and Characterization. 17 (5): 1–11.
Wang, Y., Ye, Y., Wang, L., Yin, W., and Liang, J. 2021. Antioxidant activity and subcritical water extraction of anthocyanin from raspberry process optimization by response surface methodology. Food Bioscience. 44: 101394.
Ye, M., Han, J., Chen, H., Zheng, J., and Guo, D. 2007. Analysis of phenolic compounds in rhubarbs using liquid chromatography coupled with electrospray ionization mass spectrometry. Journal of the American Society for Mass Spectrometry. 18: 82–91.
Zhang, L., Fan, G., Khan, M. A., Yan, Z., and Beta, T. 2020. Ultrasonic-assisted enzymatic extraction and identification of anthocyanin components from mulberry wine residues. Food Chemistry. 323: 126714.
Zou, T.-B., Wang, M., Gan, R.-Y., and Ling, W.-H. 2011. Optimization of ultrasound-assisted extraction of anthocyanins from mulberry, using response surface methodology. International Journal of Molecular Sciences. 12(5): 3006–3017.
OPEN access freely available online
Natural and Life Sciences Communications
Chiang Mai University, Thailand. https://cmuj.cmu.ac.th
Kornkanok Thaisungnoen1, Muhammad Umar1, Manisha Singh2, and Anil Kumar Anal1, *
1 Department of Food, Agriculture and Bioresources, Asian Institute of Technology, Klong Luang, Pathum Thani 12120, Thailand.
2 School of Science, RMIT University, Melbourne, VIC 3083, Australia.
Corresponding author: Anil Kumar Anal, E-mail: anilkumar@ait.asia
Total Article Views
Editor: Sirasit Srinuanparn,
Chiang Mai University, Thailand
Article history:
Received: October 19, 2023;
Revised: January 12, 2024;
Accepted: January 12, 2024;
Online First: January 22, 2024