 ISSN: 2822-0838 Online

Effects of Dietary Star Apple (Chrysophyllum cainito L.) Peel Extract on Growth Performance, Intestinal Histology, Hematology, and Non-Specific Immune Parameters in Common Lowland Frog (Rana rugulosa Wiegmann)
Aroon Jankham, Wilawan Promprom, Wannachai Chatan, Kajita Somnate, Somsak Khambaione, and Phukphon Munglue*Published Date : January 12, 2024
DOI : https://doi.org/10.12982/NLSC.2024.009
Journal Issues : Number 1, January-March 2024
Abstract Star apple (Chrysophyllum cainito L.) has been used to treat several diseases. However, using this plant as a feed additive in aquaculture production is rare. Therefore, this work aimed to investigate the effects of dietary star apple peel extract (SAPE) on growth performance, intestinal histology, hematology, and non-specific immune parameters in common lowland frog (Rana rugulosa Wiegmann). Peel samples from star apple fruits were collected, dried, and extracted with methanol. Alkaloids, flavonoids, phenolics, saponins, tannins, and steroids were detected in SAPE at varied concentrations. Frogs of average weight 8.50 ± 0.10 g were fed diets incorporating 0, 10, 15, and 20 g SAPE/kg diet. After six weeks of feeding, the frogs' growth and physiological parameters were evaluated. The results revealed that the growth and intestinal histology features of frogs fed SAPE diets were significantly increased compared with the control (P <0.05). No significant differences among the treatments were observed in the survival rate, red blood cells, hematocrit, and hemoglobin (P >0.05). Serum albumin was significantly enhanced in frogs fed a 10 g SAPE/kg diet (P <0.05). Dietary SAPE significantly decreased serum alkaline phosphatase, alanine aminotransferase, aspartate aminotransferase, triglyceride, and cholesterol compared with the control (P <0.05). Furthermore, frogs fed SAPE diets had significantly elevated lysozyme activity, leukocyte respiratory burst activity, complement activity, and immunoglobulin M compared with the control (P <0.05). In conclusion, these results showed the beneficial effects of SAPE on the growth and health status of frogs with the appropriate level of 17.75 to 20.00 g/kg diet.
Keywords: Medicinal plants, Common lowland frog, Growth performance, Immunity, Hematology
Funding: The authors are grateful for the research funding provided by Ubon Ratchathani Rajabhat University, Ubon Ratchathani, Thailand.
Citation: Jankham, A., Promprom, W., Chatan, W., Somnate, K., Khambaione, S., and Munglue, P. 2024. Effects of dietary star apple (Chrysophyllum cainito L.) peel extract on growth performance, intestinal histology, hematology, and non-specific immune parameters in common lowland frog (Rana rugulosa Wiegmann). Natural and Life Sciences Communications. 23(1): e2024009.
INTRODUCTION
Common lowland frog (Rana rugulosa Wiegmann) is successfully cultivated in many parts of the world. This species has shown great potential for future farming at a commercial level because of a growing demand for its meat (Zhang et al., 2015; Karnjanapratum et al., 2019). Therefore, intensive and semi-intensive farming techniques have been encouraged to produce frogs. However, extensive rearing systems can adversely affect frog health and physiological function, which can occur rapidly due to overcrowded conditions (Khambaione et al., 2021). In addition, the pathogens related to the stress-mediated diseases of frogs, including fungi, bacteria, protozoa, and viruses, can reduce the survival rate and cause severe economic losses (Nyman, 1986; Wongtha et al., 2019). The application in the diets of chemotherapeutic agents and antibiotics to improve the productivity and health of frogs may increase bacterial resistance and drug residues in meat products, which would harm human well-being (Dawood et al., 2018). Therefore, alternative sustainable methods to enhance frog growth and physiological conditions are urgently required (Elumalai et al., 2020).
Medicinal plants have been evaluated for their efficacy and safety in aquaculture production because some of them contain bioactive components that can improve growth, reproduction, and disease resistance in widely cultured frog species (Wongtha et al., 2019; Khambaione et al., 2021). Such studies have reported the positive effects of dietary supplementation of lotus (Nelumbo nucifera Gaertn.) (Thummek et al., 2016), waterlily (Nymphaea pubescens Willd.) (Kamatit et al., 2016), and papaya (Carica papaya L.) (Klahan and Pimpimol, 2018) on growth performance, feed utilization efficiency, and intestinal morphology in the frog.
Chrysophyllum cainito L. is an evergreen tree belonging to the Sapotaceae family. This plant is distributed in tropical and subtropical regions, including India, China, Vietnam, and Thailand (Doan and Le, 2020). The fruit has many common names depending on its growing location, such as star apple, cainito, milk fruit, golden leaf tree (English), and nam nom (Thai). The plant grows 25 m in height and 4-8 m in width. Leaves are oval and dark green on the upper surface, and the underside is coated with golden-brown color. The fruit is round, ellipsoid, or oblate-shaped. The fruit color may be pale green, red-purple, or dark purple. The flesh is milky, soft, and sweet. Immature fruits, leaves, and bark of star apple produce milky latex. All parts of this plant have been reported to have various pharmacological properties (Sofowora et al., 2013). In traditional medicine, it is used to treat diabetes, laryngitis, pneumonia, dysentery, cancer, and intestinal disorders (Doan and Le, 2020; Doan et al., 2018). The leaf extract had effective in antinociceptive and antihyperalgesic activities (Déciga-Campos et al., 2017). The fruit has been assessed for antioxidant, antidiabetic, anti-inflammatory, and α-glucosidase inhibitory properties (Arana-Argáez et al., 2021; Luo et al., 2002). The stem bark extract was found to show antidiabetic activity (Doan et al., 2018). The active components of star apple are alkaloids, flavonoids, phenolics, and triterpenoids (Ningsih et al., 2020). Additionally, Luo et al. (2002) isolated and identified nine polyphenolic compounds in star apple fruits (catechin, epicatechin, gallocatechin, epigallocatechin, quercetin, quercitrin, isoquercitrin, myricitrin, and gallic acid).
As mentioned above, several scientific reports have elucidated the beneficial effects of star apple on human health. However, there is no report on using star apple as a phytogenic in aquaculture production. In addition, continuous efforts are needed to find novel beneficial additives as growth promotors and immunostimulants in aquatic animals. Therefore, this present study investigated the effects of dietary star apple peel extract (SAPE) on growth performance, intestinal histology, hematology, and non-specific immune parameters in the common lowland frog.
MATERIALS AND METHODS
Plant materials
Star apple fruits with a purplish red color were collected from Detudom District, Ubon Ratchathani, Thailand. A plant specimen was authenticated and deposited at the Program of Biology, Faculty of Science, Ubon Ratchathani Rajabhat University for further reference.
Plant extraction
The extraction procedures were performed according to the report of da Rosa et al. (2019) with minor modifications. The star apple fruits were cleaned using tap water and the skin was collected and dried in a hot air oven at 40°C. The dried samples (3 kg) were macerated with 15 L of 80% methanol (1:5 w/v) at room temperature for one week. The mixture was then filtered using Whatman paper No. 1. The solvent was removed using a rotary evaporator (Buchi, R-200, Switzerland) and dried using a lyophilizer (Labconco Corporation, Missouri, USA). The yield was 2.19 ± 0.02% (weight/weight [w/w] based on the dried starting weight). The plant extract was kept at 4°C in a refrigerator to prepare the experimental diets.
Quantitative phytochemical evaluation
Determination of alkaloids was based on the reaction of alkaloids with bromocresol green (BCG) (Shamsa et al., 2008). The amount of alkaloid in the extract was quantified as milligrams of atropine equivalent per gram of extract (mgAE/g of extract). Total flavonoid content was assayed using the aluminum chloride colorimetric method (Roy et al., 2018). The flavonoid content was expressed as milligrams of quercetin equivalent per gram of extract (mgQE/g of extract). Total phenolic content was determined using the Folin-Ciocalteu reagent method (Roy et al., 2018). The phenolic concentration was computed as milligrams of gallic acid equivalent per gram of extract (mgGAE/g of extract). The vanillin-sulphuric acid method was used to measure the saponin contents (Le et al., 2018). The level of saponin was calculated and presented as milligrams of diosgenin equivalent per gram of extract (mgDE/g of extract). The tannin content was ascertained using the Folin-Ciocalteu reagent method (Roy et al., 2018). The tannin concentration was expressed as milligrams of gallic acid equivalent per gram of extract (mgGAE/g of extract). The level of the steroid content was evaluated using the method reported by Harborne (1998), and the result was expressed as milligrams of diosgenin equivalent per gram of extract (mgDE/g of extract). All tests were performed in triplicate.
Diet preparation
A commercial pellet feed was purchased from a local company. The proximate composition of the basal diet, including moisture, crude protein, crude lipid, and ash, was evaluated according to standard methods of AOAC (2010) and the results are presented in Table 1. A bomb calorimeter was used to determine the gross energy content in the diet. The feed samples were crushed and mixed with distilled water to produce a dough. The plant extract was subsequently incorporated into the dough at 0, 10, 15, and 20 g/kg diet. The diets were pelleted using a floating pellet machine. The pelleting temperature was not allowed to exceed 40°C. The diet samples were dried in a hot air oven at 40°C for 48 h, kept in polyethylene bags, and stored at 4 °C for further use. The levels of SAPE selected in this present study were modified based on the report of Thip-uten et al. (2021).
Table 1. Proximate composition of the commercial diet used in this research.
|
Analysis |
Values |
|
Moisture (%) |
5.69 |
|
Crude protein (%) |
43.53 |
|
Crude lipid (%) |
6.93 |
|
Ash (%) |
11.66 |
|
Gross energy (cal/g) |
4250.04 |
Animal ethics and regulation
This study was conducted at Ubon Ratchathani Rajabhat University Farm and maintained under the committee's guidelines on Care and Use of Laboratory Animal Resources, National Research Council, Thailand. The experiment trial was performed on the advice of the Institutional Animal Care and Use Committee, Ubon Ratchathani Rajabhat University, Thailand. The protocol number is AN63005.
Frog and experimental conditions
Male froglets with an average initial weight of 8.50 ± 0.10 g were obtained from Ubon Ratchathani Fishery Cooperative, Ubon Ratchathani, Thailand and reared in an indoor concrete pond. Frogs were acclimated to the experimental conditions for two weeks. They were fed a commercial diet containing 43% crude protein and 6% crude lipid (Table 1) twice daily (08.00 and 16.00) at a rate of 5% based on their wet body weight. The diets were placed on Styrofoam. External appearance, feeding behavior, and general health of frogs were monitored daily.
This research used Completely Randomized Design (CRD). After the acclimatization, two hundred and forty frogs were randomly divided into four treatments with triplication (20 male frogs per replication). Dietary inclusion of SAPE in each treatment was assigned as follows. Treatment 1, frogs were fed with the basal diet without containing SAPE and defined as the control. Treatment 2, frogs were fed with the diet containing SAPE at 10 g/kg diets. Treatment 3, frogs were fed with the diet containing SAPE at 15 g/kg diets. Treatment 4, frogs were fed with the diet containing SAPE at 20 g/kg diets. Frogs in each replication were cultivated in circular cement tanks (70 cm in diameter and 45 cm in height) filled with dechlorinated water (4 cm depth). The tanks were covered with a black shade net to protect the frogs from natural enemies. Frogs were fed the tested diets twice daily (08.00 and 16.00) at a feeding rate of 5% of body weight for six weeks. During the experimental period, the water in each tank was changed every two days. Water quality indices including dissolved oxygen (> 5 mg/L), water temperature (26 - 30°C), pH (7.50-8.50), total alkalinity (80 - 150 mg/mL), and total ammonia nitrogen (<0.10 mg/L) were kept at optimal levels for frog cultivation (Thip-uten et al., 2021). A dead frog, if present, was removed and recorded.
Growth performance
At the end of the trial, the frogs were starved for 24 hours. Four frogs from each replication (n = 12 for each treatment) were randomly collected and weighed to assess growth performance. The survival rate was also recorded throughout the experimental period. Evaluation of growth performance parameters and survival rate was conducted using the following equations:
Weight gain (WG, g) = final weight (g) – initial weight (g);
Specific growth rate (SGR, %/day) = 100 × (Ln final weight (g) – Ln initial weight (g))/experimental period (days);
Average daily gain (ADG, g/day) = (final weight (g) – initial weight (g))/ experimental period (days);
Feed conversion ratio (FCR) = dry feed consumed (g)/weight gain (g);
Feed conversion efficiency (FCE) = weight gain (g)/dry feed consumed (g);
Survival rate (SR, %) = 100 × (final number of frogs/initial number of frogs).
Blood sampling
At the end of the experimental duration, frogs were fasted for 24 hours. Four frogs from each replication (n = 12 for each treatment) were randomly sampled and double-pithed with a sharp steel needle. The abdominal wall was opened to present the heart. Blood samples were collected by cardiac puncture using 2 mL sterile hypodermic syringes and divided into two parts. One part (1 mL) was mixed gently with K2EDTA as an anticoagulant and used for hematological analysis. The other part (1 mL) was left to clot at room temperature for 3 hours and centrifuged at 9,000 × g at 4°C for 10 min. The sera were obtained and stored at -20°C to analyze blood biochemical and immunological parameters.
Intestinal histology analysis
Four frogs from each replication (n = 12 for each treatment) were randomly collected to evaluate the intestinal histology. After blood collection, the intestine samples were dissected, cleared from adherent tissues, and divided into the anterior (1 cm after the stomach), the middle, and the posterior intestines (1 cm before the anus). The intestinal lumen was cleaned using 0.90% normal saline solution and fixed in 10% neutral buffered formalin for 24 h. The tissues were dehydrated, embedded in paraffin wax to section the specimens (5 µm thick), and strained in hematoxylin and eosin (H & E). The morphological changes of the intestine, including villi height, villi width, inner circulatory smooth muscle, outer longitudinal smooth muscle, enterocyte height, and goblet cell number, were evaluated according to the method demonstrated by Munglue et al. (2019) (Figure 1). Additionally, the absorptive surface area of the intestine was measured using the following equation:
The absorptive surface area (µm2) = villi height (µm) × villi width (µm).
Hematological analysis
The red blood cell count (RBC) level was evaluated using a Neubauer hemocytometer. The hematocrit (Hct) content was analyzed using microhematocrit centrifugation. The hemoglobin (Hb) concentration was measured using the cyanmethemoglobin method with a wavelength of 540 nm (Sokooti et al., 2021).
Biochemical analysis
The alkaline phosphatase (ALP) level was estimated following the technique suggested by Tietz et al. (1983). The measurement of alanine aminotransferase (ALT) content was performed according to the report of Schumann et al. (2002). The contents of cholesterol and triglyceride were determined following the protocols of Flegg (1973) and Cole et al. (1997), respectively.
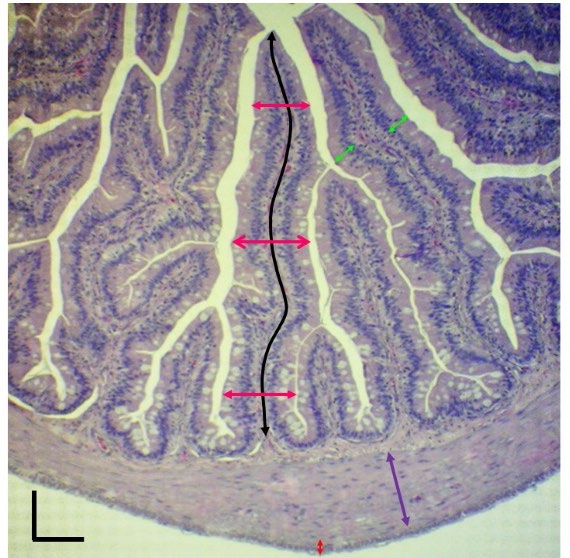
Figure 1. The criteria used in evaluating intestinal morphology of frogs fed with diets containing different levels of SAPE for 6 weeks. Villi height (black line) was evaluated from the base to the top of the villi. Villi width (pink line) was measured from side to side at the base, the middle, and the top of the villi, and these values were subsequently averaged to indicate the mean value of villi width. The height of enterocytes (green line) was randomly measured from 20 cells in the anterior and middle parts of the intestines and 10 cells in the posterior part of the intestine. The thicknesses of the inner circular smooth muscle (purple line) and outer longitudinal smooth muscle (red line) were also determined. Scale bar = 200 µm.
Immunological analysis
Lysozyme activity was evaluated using the turbidimetric method according to Van Doan et al. (2019) based on the lysis of Micrococcus lysodeikticus (Sigma-Aldrich, USA). In this regard, 25 µL of serum sample was added to 175 µL of M. lysodeikticus (0.3 mg/mL in 0.02 M sodium citrate buffer, pH 5.8) in a flat-bottomed 96-well plate in triplicate. The reduction in absorbance at 450 nm was evaluated every 3 min for 15 min and at 25°C using a plate reader (EPOCH-SN, Agilent Technologies, Inc, California, USA). One unit of lysozyme activity was defined as the amount of enzyme that produced a decrease of 0.001 in absorbance. The results of lysozyme activity were expressed as Unit/mL.
The level of alternative complement activity (ACH50) was measured using rabbit red blood cells (RaRBC) as targets for the lytic assay. Briefly, the RaRBC content was adjusted to 2 × 10⁷ cells/mL in phosphate-buffered saline (PBS) (pH 7.4). For the test, 100 µL of frog serum was diluted with 400 µL of PBS (pH 7.4) to produce final concentrations of 2.5%, 1.25%, 0.625%, 0.3125%, and 0.15625% and loaded into a 96-well round-bottom plate. Then, 100 µL of the washed RaRBC solution was added to each diluted serum content and incubated at room temperature for 60 min. After incubation, the samples were centrifuged at 1,500 × g for 5 min at 25°C and 100 µL of supernatant placed into a 96-well flat-bottom microplate. The absorbance of the supernatant was measured at 415 nm. The degree of hemolysis and the volume of serum were plotted to determine ACH50 (Unit/mL) according to the report of Amphan et al. (2019).
Leukocyte respiratory burst activity was estimated using the reduction of nitroblue tetrazolium (NBT) based on the report of Biller-Takahashi et al. (2013). In this method, 100 µL of frog blood sample was placed into a microtiter plate well. Then, 100 µL of 2% NBT solution was added and incubated for 30 min at room temperature. After incubation, 50 µL of NBT blood suspension was mixed with 2 mL of N, N-dimethylformamide in a glass tube. The mixture was subsequently centrifuged at 3,000 × g for 5 min. The absorbance of the supernatant fluid was measured in a spectrophotometer (Eppendorf BioSpectrometer® basic, Eppendorf AG, Germany) at 540 nm.
Immunoglobulin M (IgM) level was determined following the protocol of Jahazi et al. (2020). Briefly, 100 µL of 12% polyethylene glycol (PEG) was added to 100 µL of serum sample and incubated for 2 h at room temperature. The sample was centrifuged at 400 × g for 10 min at room temperature. The total protein level was evaluated using the Lowry protein assay (Lowry et al., 1951). IgM content was calculated by subtracting the total protein in individual serum and in serum treated with PEG. IgM level in the frog serum was expressed as g/dL.
Statistical analysis
A Completely Randomized Design (CRD) was used in this study. The Kolmogorov-Sminov test was used to evaluate the normal distribution of the data. The homogeneity of variances among the treatments was analyzed using the Levene’s test. Arcsin square-root transformation was used when the data were not normally distributed. All data were displayed as mean ± SEM. The data were analyzed using a one-way analysis of variance (ANOVA). Differences among treatments were evaluated using Duncan’s multiple range tests. If P <0.05 indicated a significant difference. Second-order polynomial regression analysis was also conducted to determine the appropriate level of SAPE for the culture of the frog.
RESULTS
Quantitative phytochemical evaluation
Table 2 shows the phytochemical components of SAPE. It was found that the plant extract contained alkaloids (116.25 ± 1.42 mgAE/g of extract), flavonoids (119.84 ± 0.73 mgQE/g of extract), phenolics (859.10 ± 2.43 mgGAE/g of extract), saponins (217.58 ± 2.60 mgDE/g of extract), tannins (38.66 ± 0.39 mgTAE/g of extract), and steroids (226.85 ± 1.70 mgDE/g of extract) in varied concentrations.
Table 2. Phytochemical components of SAPE.
|
Phytochemicals |
Values |
|
Alkaloids (mgAE/g of extract) |
116.25 ± 1.42 |
|
Flavonoids (mgQE/g of extract) |
119.84 ± 0.73 |
|
Phenolics (mgGAE/g of extract) |
859.10 ± 2.43 |
|
Saponins (mgDE/g of extract) |
217.58 ± 2.60 |
|
Tannins (mgTAE/g of extract) |
38.66 ± 0.39 |
|
Steroids (mgDE/g of extract) |
226.85 ± 1.70 |
Note. Data are represented as mean ± SEM; (n = 3 for each test); AE = atropine equivalent; QE = quercetin equivalent; GAE = gallic acid equivalent; DE = diosgenin equivalent; TAE = tannic acid equivalent.
Effects of dietary SAPE on growth performance
The effects of dietary SAPE on the growth of frogs are summarized in Table 3. Frogs fed with the diets supplemented with SAPE at 10, 15, and 20 g/kg diet showed a significant increase in the final weight, WG, SGR, ADG, and FCE compared with the control (P <0.05). Additionally, the diets containing SAPE caused a significant decrease in FCR compared with the control (P <0.05). No significant differences in the survival rate were found in frogs fed diets supplemented with SAPE compared with frogs fed the control diet (P >0.05). By using the second-order polynomial regression analysis on the final weight (Y = -0.051X2 + 2.133X + 85.789, R2 = 0.514, P = 0.000), WG (Y = -0.050X2 + 2.115X + 77.286, R2 = 0.515, P = 0.000), ADG (Y = -0.001X2 + 0.050X + 1.840, R2 = 0.515, P = 0.000), SGR (Y = -0.001X2 + 0.049X +5.499, R2 = 0.456, P = 0.000), FCR (Y = 0.002X2 - 0.071X + 2.757, R2 = 0.605, P = 0.000), and FCE (Y = 0.000X2 + 0.012X + 0.366, R2 = 0.572, P = 0.000), the appropriate level of SAPE demonstrated in this research was found to be 17.75 to 20.00 g/kg diet (Figure 2).
Table 3. Growth performance, feed utilization, and survival rate of frogs fed diets containing different levels of SAPE for 6 weeks.
|
Parameters |
The levels of SAPE (g/kg diet) |
|||
|
0 |
10 |
15 |
20 |
|
|
IW (g) |
8.50 ± 0.15 |
8.58 ± 0.14 |
8.50 ± 0.15 |
8.41 ± 0.14 |
|
FW (g) |
85.91 ± 2.23b |
101.25 ± 3.45a |
107.33 ± 1.84a |
107.66 ± 2.46a |
|
WG (g) |
77.41 ± 2.21b |
92.66 ± 3.41a |
98.83 ± 1.83a |
99.25 ± 2.54a |
|
SGR (%/day) |
5.50 ± 0.06b |
5.86 ± 0.08a |
6.03 ± 0.05a |
6.06 ± 0.08a |
|
ADG (g/day) |
1.84 ± 0.05b |
2.20 ± 0.08a |
2.35 ± 0.04a |
2.36 ± 0.06a |
|
FCR |
2.75 ± 0.08a |
2.24 ± 0.08b |
2.09 ± 0.03b |
2.07 ± 0.05b |
|
FCE |
0.36 ± 0.01b |
0.45 ± 0.01a |
0.48 ± 0.00a |
0.48 ± 0.01a |
|
SR (%) |
96.88 ± 3.13 |
96.88 ± 3.13 |
100 ± 0.00 |
100 ± 0.00 |
Note. Different letters in a row show a significant difference (P <0.05); (n = 12 for each treatment). Data are represented as mean ± SEM; IW = initial weight (g); FW = final weight (g); WG = weight gain (g); SGR = specific growth rate (%/day); ADG = average daily gain (g/day); FCR = feed conversion ratio; FCE = feed conversion efficiency; SR = survival rate (%).

Figure 2. The relationship between growth parameters of frogs and different dietary SAPE levels.
Effects of dietary SAPE on intestinal histology
The effects of dietary SAPE on the intestinal histology of frogs are summarized in Table 4. In the anterior intestine (Figure 3A), increased intestinal villi height and enterocyte height were observed in frogs fed on diets supplemented with 10 and 15 g SAPE/kg (P <0.05). A significant decrease in villi width was noticed in frogs fed with SAPE-added diets compared with the control (P <0.05). The outer longitudinal muscle layer of frogs fed with the diet containing 15 g SAPE/kg was significantly enhanced compared with other treatments (P <0.05). The inner circulatory muscle layer was significantly decreased in frogs fed dietary SAPE compared to the control diet (P <0.05). Goblet cells and the absorptive surface area of frogs fed with the diets containing SAPE were significantly increased compared with the control (P <0.05).
In the middle intestine (Figure 3B), it was found that dietary SAPE caused a significant increase in villi height, goblet cells, and absorptive surface area compared with the control diet (P <0.05). Enterocyte height was increased in frogs fed on 10 and 20 g SAPE/kg diets compared with the control (P <0.05). A diet containing 20 g SAPE/kg significantly increased villi width and inner circulatory smooth muscle layer compared with the control (P <0.05). The outer longitudinal smooth muscle layer was significantly decreased in SAPE-supplemented treatments compared with the control (P <0.05).
In the posterior intestine (Figure 3C), the intestinal villi height of frogs fed with a diet supplemented with 10 g SAPE/kg was significantly increased compared with the other treatments (P <0.05). Reductions of villi width were detected in frogs fed with SAPE-supplemented diets (P <0.05). The outer longitudinal smooth muscle layer of frogs fed with a diet containing 15 g
SAPE/kg was significantly higher than in the other treatments (P <0.05). The inner circulatory smooth muscle layer of frogs fed with SAPE-containing diets improved considerably compared with the control (P <0.05). Enterocyte height and the absorptive surface area were significantly decreased in frogs fed with 15 and 20 g SAPE/kg diets compared with frogs fed with the basal diet and a 10 g SAPE/kg diet (P <0.05). There was no significant difference in the goblet cell number among the treatments (P >0.05).
Table 4. Intestinal histology of frogs fed the diets containing different levels of SAPE for 6 weeks.
|
Parameters |
The levels of SAPE (g/kg diet) |
|||
|
0 |
10 |
15 |
20 |
|
|
Anterior intestine Villi height (µm) |
3,334.01 ± 5.73b |
3,777.72 ± 19.37a |
3,709.93 ± 10.20a |
3,267.57 ±2.81b |
|
Villi width (µm) |
371.19 ± 0.29a |
365.55 ±1.46b |
325.03 ± 1.34c |
325.40 ± 0.69c |
|
Outer smooth muscle layer (µm) |
40.58 ± 0.02b |
34.74 ± 0.31c |
47.47 ± 0.69a |
28.89 ± 0.50d |
|
Inner smooth muscle layer (µm) |
375.82 ± 0.99a |
227.32 ± 0.74b |
174.10 ± 1.56d |
203.01 ± 0.69c |
|
Enterocyte height (µm) |
163.35 ± 0.26b |
172.32 ± 0.38a |
176.09 ± 0.81a |
161.99 ± 0.34b |
|
Goblet cells |
37.50 ± 0.64c |
43.00 ± 0.40b |
43.50 ± 0.28b |
45.50 ± 0.28a |
|
Absorptive surface area (µm2) |
1,200,706.76 ± 79.49c |
1,378,867.66 ± 93.33a |
1,205,532.85 ± 80.48b |
1,206,617.75 ± 43.51b |
|
Middle intestine Villi height (µm) |
1,367.88 ± 8.40d |
2,279.50 ± 9.70c |
2,880.66 ± 23.37a |
2,434.14 ± 30.28b |
|
Villi width (µm) |
250.06 ± 11.84bc |
270.52 ± 6.43b |
236.11 ± 3.39c |
297.71 ± 3.71a |
|
Outer smooth muscle layer (µm) |
53.94 ± 3.23a |
39.27 ± 2.96b |
41.58 ± 1.59b |
34.91 ± 1.75b |
|
Inner smooth muscle layer (µm) |
229.64 ± 16.40b |
204.67 ± 15.13bc |
184.62 ± 6.10c |
307.81 ± 15.79a |
|
Enterocyte height (µm) |
107.12 ± 3.88c |
127.26 ± 6.03ab |
115.19 ± 3.20bc |
137.41 ± 3.33a |
|
Goblet cells |
32.50 ± 1.32c |
43.00 ± 0.90b |
42.63 ± 1.40b |
53.25 ± 2.78a |
|
Absorptive surface area (µm2) |
274,873.80 ± 889.46d |
875,096 ± 641.22a |
700,199.36 ± 145.49b |
677,504.31 ± 210.34c |
|
Posterior intestine Villi height (µm) |
1,397.67 ± 26.55b |
1,771.72 ± 26.62a |
1,253.20 ± 20.29c |
1,349.83 ± 33.71b |
|
Villi width (µm) |
328.22 ± 10.21a |
285.89 ± 6.75b |
233.43 ± 3.25c |
266.28 ± 9.26b |
|
Outer smooth muscle layer (µm) |
45.53 ± 6.71b |
44.24 ± 7.33b |
86.45 ± 1.83a |
81.03 ± 7.72a |
|
Inner smooth muscle layer (µm) |
149.81 ± 7.72c |
208.76 ± 3.32b |
292.94 ± 6.05a |
230.28 ± 14.12b |
|
Enterocyte height (µm) |
139.39 ± 2.76a |
139.95 ± 1.68a |
107.39 ± 1.23c |
128.20 ± 4.17b |
|
Goblet cells |
32.13 ± 1.03 |
31.00 ± 0.00 |
31.00 ± 0.00 |
31.00 ± 0.00 |
|
Absorptive surface area (µm2) |
517,490.47 ± 206.07b |
526,775.49 ± 334.42a |
255,615.51 ± 367.32d |
304,977.27 ± 269.93c |
Note. Different letters in a row show a significant difference (P<0.05); (n = 12 for each treatment). Data are represented as mean ± SEM.
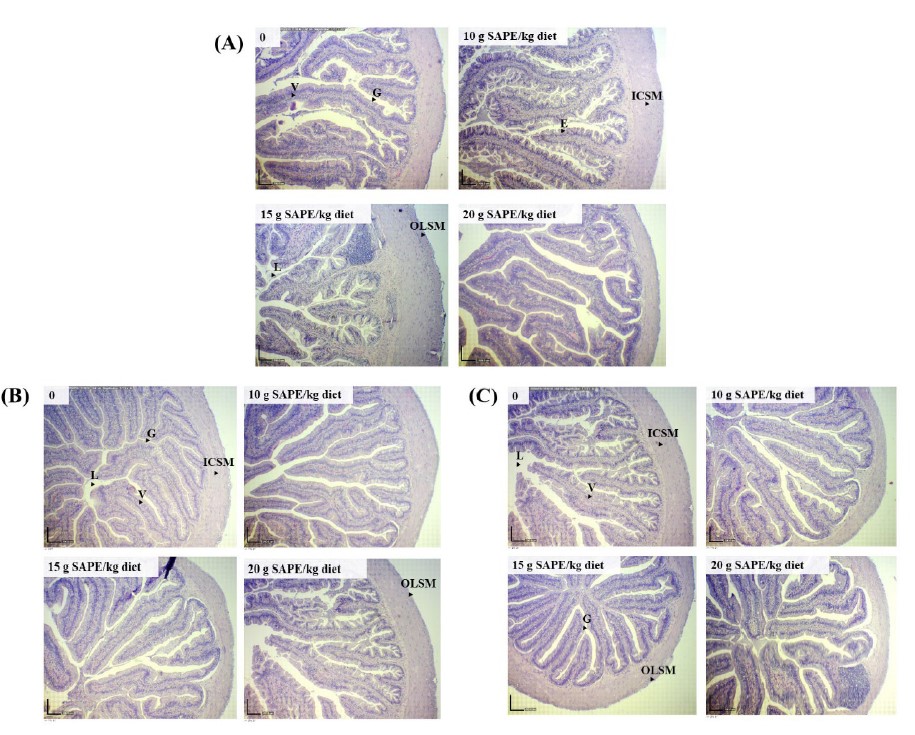
Figure 3. Histology of the anterior (A), middle (B), and posterior (C) intestines of frogs fed the diets containing different levels of SAPE for 6 weeks.
Note. L = lumen; V = villi; G = goblet cell; ICSM = inner circular smooth muscle; OLSM = outer longitudinal smooth muscle. Scale bar = 200 µm.
Effects of dietary SAPE on hematological parameters
The results of dietary supplementation with SAPE on hematological parameters of frogs are presented in Table 5. No significant differences were documented in the red blood cells, hematocrit, and hemoglobin of frogs fed on dietary SAPE compared with the frogs fed the basal diet (P >0.05).
Table 5. Hematological parameters of frogs fed the diets containing different levels of SAPE for 6 weeks.
|
Parameters |
The levels of SAPE (g/kg diet) |
|||
|
0 |
10 |
15 |
20 |
|
|
RBC (×1011 cell/L) |
1.70 ± 0.07 |
1.40 ± 0.14 |
1.60 ± 0.15 |
1.73 ± 0.22 |
|
Hb (g/dL) |
12.55 ± 0.55 |
12.55 ± 0.65 |
11.98 ± 0.73 |
12.80 ± 0.55 |
|
Hct (%) |
3.63 ± 0.40 |
3.60 ± 0.28 |
3.03 ± 0.34 |
3.30 ± 0.45 |
Note. Different letters in a row show a significant difference (P <0.05); (n = 12 for each treatment). Data are represented as mean ± SEM; RBC = red blood cells (×1011 cell/L); Hb = hemoglobin (g/dL); Hct = hematocrit (%).
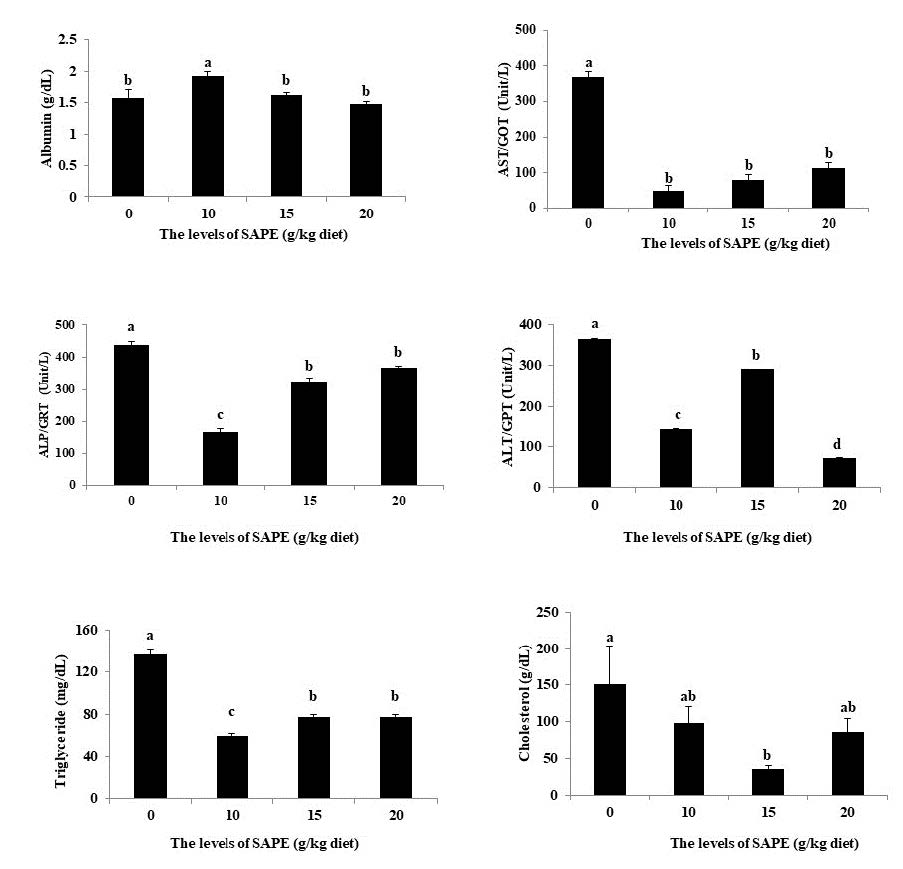
Figure 4. Blood biochemical parameters of frogs fed diets containing different levels of SAPE for 6 weeks.
Note. Bars assigned with different letters show a significant difference (P <0.05); (n = 12 for each treatment). Data are represented as mean ± SEM.
Effect of dietary SAPE on biochemical parameters
The effects of SAPE supplementation on blood chemical parameters of frog are summarized in Figure 4. The results showed that frogs fed a 10 g SAPE/kg diet had notably increased albumin levels compared with the other treatments (P <0.05). Decreased ALP, ALT, AST, cholesterol, and triglyceride levels were noted in the experimental groups compared with the control group (P <0.05).
Effects of dietary SAPE on non-specific immune parameters
The effects of dietary supplementation of SAPE on non-specific immune parameters of frogs are presented in Figure 5. Dietary SAPE significantly increased lysozyme activity and leukocyte respiratory burst activity compared with the control (P <0.05). The levels of complement activity were significantly increased in frogs fed with 10 and 20 g SAPE/kg diets compared with the other treatments (P <0.05). An increase in IgM level was recorded in frogs fed with a diet containing 10 g SAPE/kg compared to the other groups (P <0.05).

Figure 5. Immunological parameters of frogs fed the diets containing different levels of SAPE for 6 weeks.
Note. Bars assigned with different letters show a significant difference (P<0.05); (n = 12 for each treatment). Data are represented as mean ± SEM.
DISCUSSION
There is an increasing interest in using plants and their derivatives in aquaculture industries because they often have few side effects compared with synthetic compounds. Additionally, phytochemicals might be a new source of drugs that can be substituted for antibiotics. For this reason, this study evaluated the effects of dietary SAPE on growth and physiological responses in the common lowland frog. The results indicated that SAPE contains many phytochemicals, including alkaloids, flavonoids, phenolics, saponins, tannins, and steroids. Dietary supplementation with SAPE enhanced growth parameters, intestinal histology, blood biochemistry, and non-specific immune response in the frog. The appropriate SAPE level estimated using the second-order polynomial regression analysis was 17.75 to 20.00 g/kg diet.
It was found that SAPE improved growth performance indices and feed utilization parameters in the frog. A significant increase in the growth of frogs fed with SAPE diets might be due to the enhancement in digestive enzyme activities, resulting in increased feed intake, nutrient digestion and absorption, and performance production (Reverter et al., 2014; Awad and Awaad, 2017). Phytochemicals found in plants, like alkaloids, flavonoids, phenolics, saponins, tannins, and steroids, have been reported to have growth-promoting properties in many species of aquatic animals (Chakraborty et al., 2014). SAPE was found to contain alkaloids, flavonoids, phenolics, saponins, tannins, and steroids at varied levels in this research. A previous report suggested that dietary inclusion of lotus stamen extract caused a significant improvement in growth parameters, specifically final weight, WG, SGR, and ADG when compared with the control diet in common lowland frog (Thummek et al., 2016). Moreover, the diets supplemented with lasia (Lasia spinosa (L.) Thwaites), an herbal plant containing flavonoids, terpenoids, phenolics, steroids, saponins, coumarins, glycosides, and anthraquinones, produced a significant increase in the growth of common lowland frog (Khambaione et al., 2021). Therefore, the increased growth performance parameters of frogs observed in this experiment might be attributed to alkaloids, flavonoids, phenolics, saponins, tannins, and steroids found in the plant extract. The results of this research support the use of SAPE as a natural feed additive to enhance the growth of frogs. However, further research is needed to elucidate the mechanism by which SAPE promotes growth performance in the frog.
The intestinal histomorphology results are considered an important indicator of the digestion and absorption process of the gut (Wongtha et al., 2019). Increased villi height, villi width, enterocyte height, and absorptive area are related to the capacity for digestion and absorption. The muscular layer plays a functional role in water retention and the contraction of the tract during digestion. Enterocytes, the absorptive cells, are columnar cells with microvilli at the apical surface. The primary function of enterocytes is to absorb digested micronutrients (Ferrara et al., 2015). Goblet cells synthesize and secrete glycoprotein mucins to form a protective mucus layer covering the intestinal epithelium and lubricating the intestinal lumen. Morphological changes in frog intestines may be due to temperature, starvation, feed ingredients, hibernation, and seasonal changes (Seliverstova and Prutskova, 2012). Previous reports have indicated that dietary supplementation with herbs containing phenolics and flavonoids can induce cell proliferation, cell division, and apoptosis by affecting the genomic pathways (Chakraborty et al., 2014). A study conducted by Wongtha et al. (2019) indicated that rice paddy herb (Limnophila aromatica (Lam.) Merr.) supplementation significantly enhanced villi heights, muscular thicknesses, goblet cells, and microvilli when compared with the basal diet in common lowland frog. The results of the present study revealed that dietary SAPE promoted villi height, villi width, enterocyte height, enterocyte height, and the absorptive area of the intestines, leading to the improvement in the utilization of nutrients. It is hypothesized that secondary metabolites found in SAPE could regulate gene expression and cell proliferation to increase villi height and villi width in the frog intestines (Mahfuz et al., 2021). It is suggested that diets containing SAPE could improve intestinal architecture, subsequently enhancing frog growth (Ferrara et al., 2015; Thummek et al., 2019). Nonetheless, further investigation is required of the exact mechanism by which SAPE improved intestinal histology.
Blood indices have been generally used as an essential tool to monitor the health status of frogs (Wongtha et al., 2019). The primary role of red blood cells is oxygen transport to the tissues and carbon dioxide transport back to the lungs and the skin of frogs by the hemoglobin molecule. Hemoglobin also serves as the buffering system of the body. A hematocrit examination provides data on the percentage of red blood cells in the blood. In this study, red blood cells, hematocrit, and hemoglobin levels showed no significant difference between frogs fed SAPE-containing diets and control frogs. Likewise, hematocrit, white blood cells, and red blood cells of frogs fed diets supplemented with lasia extract for 8 weeks were not significantly different compared with the control (Khambaione et al., 2021). Therefore, these results suggested that the application of SAPE in the diets did not have a negative effect on the hemopoietic stem cells of the frog.
Blood biochemical indices have been used to evaluate the nutritional and health status of aquatic animals (Khunchalee and Munglue, 2020). Albumin is synthesized in hepatocytes. The serum albumin level indicates protein metabolism, osmoregulation, and the immune system. The activity of ALP is present in the liver, bone, intestines, and spleen. Elevated ALP levels are related to hepatobiliary and bone disorders. ALT is an enzyme that is produced by many tissues. Increased ALT levels are found in hepatocellular disorders and myocardial injury (Coppo et al., 2001). AST is distributed in cardiac tissue, skeletal muscle, and liver. Elevation of AST activity is seen in myocardial infarction, acute hepatocellular disorder, skeletal muscle disorders, and inflammatory conditions (Coppo et al., 2005). Cholesterol is a precursor for synthesizing steroid hormones, vitamin D, and bile acids. A significant increase in serum cholesterol levels is involved in liver and kidney diseases (Coppo et al., 2005). Triglyceride is an energy source deposited in the fat body and the rest of the frog body (Zhu et al., 2019). The triglyceride levels are associated with the production of gametes, energy storage, and lipid metabolism (Zhu et al., 2019). In this research, the increase in albumin levels in frogs fed with a 10 mg SAPE /kg diet indicated a positive effect on non-specific immune response in this frog species. Reducing effects of SAPE-supplemented diets on cholesterol and triglyceride contents were observed in this experiment. These findings are similar to those of Sokooti et al. (2021), who stated that cholesterol and triglyceride concentrations significantly decreased in common carp (Cyprinus carpio L.) fed with diets supplemented with olive leaf extract. It has been reported that phenolic compounds, flavonoids, and alkaloids could modulate lipase activity and lipid metabolism (Haselgrübler et al., 2019). Therefore, a hypolipidemic effect of SAPE observed in this study might be due to the mechanism of action of flavonoids, phenolic compounds, and alkaloids.
A non-specific immune system is crucial in protecting frogs against bacterial or parasite infections. Lysozyme is one of the defensive factors in the innate immune system of the frog acting by lysing the cell walls of pathogenic bacteria and activating polymorphonuclear leukocytes and macrophages (Sharma et al., 2010). The biological functions of the complement system are to eliminate invading pathogens and modulate inflammatory responses. Superoxide and hydrogen peroxide play vital roles in the respiratory burst activity to defend the host against pathogen infections (Yousefi et al., 2019). Immunoglobulins are a component of the humoral immune system, frequently detected to monitor the immunomodulatory effects of herbal plants enriched diets (Vallejos-Vidal et al., 2016; Jahazi et al., 2020). In this study, dietary supplementation with SAPE significantly elevated lysozyme activity, complement, respiratory burst, and IgM levels in the frog. These findings are in line with a previous study that revealed increases in lysozyme, complement C3, and IgM in rugose frogs fed with diets containing 4.5% Spirulina for 8 weeks (Thip-uten et al., 2021). Similarly, Nile tilapia fingerlings fed with diets supplemented with Thai ginseng (Boesenbergia rotunda (L.) Mansf.) powder showed a significant increase in serum lysozyme, alternative complement, and respiratory burst activity (Van Doan et al., 2019). It has been stated that the administration of plant extracts improved the function of the non-specific immune system in aquatic animals by metabolic, neurological, and endocrinal pathways (Awad and Awaad, 2017; Vallejos-Vidal et al., 2016). Additionally, secondary metabolites such as flavonoids and phenolic compounds have been reported to have antioxidant, anti-inflammatory, antibacterial, and immunomodulating properties (Jahazi et al., 2020). Therefore, phytochemicals like flavonoids and phenolic compounds could activate the production of immune components present in the frog (Reverter et al., 2014; Vallejos-Vidal et al., 2016). Nevertheless, the exact mechanism by which SAPE stimulates non-specific immune responses requires further study.
CONCLUSION
In conclusion, the current research results indicated that dietary SAPE improves growth, intestinal morphology, blood biochemistry, and non-specific immune response in the common lowland frog. The appropriate dose of SAPE calculated using the second-order polynomial regression analysis was found to be 17.75 to 20.00 g/kg diet. The positive effects of SAPE on the growth rate and physiological responses of frogs observed in this study might be due to some phytochemical constituents such as alkaloids, flavonoids, phenolics, saponins, tannins, and steroids. However, further studies are needed to clarify the mode of action in which SAPE enhanced the growth rate and immune function in the frog.
ACKNOWLEDGEMENTS
The authors would like to acknowledge the Faculty of Science, Ubon Ratchathani Rajabhat University for providing the facilities for the study. This research project was financially supported by Ubon Ratchathani Rajabhat University, Ubon Ratchathani, Thailand.
CONFLICT OF INTEREST
We have no conflict of interest.
REFERENCES
Amphan, S., Unajak, S., Printrakoon, C., and Areechon, N. 2019. Feeding-regimen of ß-glucan to enhance innate immunity and disease resistance of Nile tilapia, Oreochromis niloticus Linn., against Aeromonas hydrophila and Flavobacterium columnare. Fish and Shellfish Immunity. 87: 120-128.
AOAC. 2010. Official methods of analysis of Association of Official Analytical Chemists. 18th edition. Association of Official Analytical Chemists. Washington, DC.
Arana-Argáez, V.E., Mena-Rejón, G.J., Torres-Romero, J.C., Lara-Riegos, J.C., López-Mirón, G., and Carballo, R.M. 2021. Anti-inflammatory effects of Chrysophyllum cainito fruit extract in lipopolysaccharide-stimulated mouse peritoneal macrophages. Inflammopharmacology. 29(2): 513-524.
Awad, E., and Awaad, A. 2017. Role of medicinal plants on growth performance and immune status in fish. Fish & Shellfish Immunology. 67: 40-54.
Biller-Takahashi, J.D., Takahashi, L.S., Saita, M.V., Gimbo, R.Y., and Urbinati, E.C. 2013. Leukocytes respiratory burst activity as indicator of innate immunity of pacu Piaractus mesopotamicus. Brazilian Journal of Biology. 73(2): 425-429.
Chakraborty, S.B., Horn, P., and Hancz, C. 2014. Application of phytochemicals as growth-promoters and endocrine modulators in fish culture. Reviews in Aquaculture. 6(1): 1-19.
Cole, T.G., Klotzsch, S.G., and McNamara, J. 1997. Measurement of triglyceride concentration. p.115-126. In N. Rifai, G.R. Warnick, and M.H. Dominiczak (eds.) Handbook of lipoprotein testing. AACC Press, Washington, DC.
Coppo, J.A., Mussart, N.B., and Fioranelli, S.A. 2001. Physiological variation of enzymatic activities in blood of bullfrog, Rana catesbeiana (Shaw, 1802). Revista Veterinaria. 12(13): 22-27.
Coppo, J.A., Mussart, N.B., and Fioranelli, S.A. 2005. Blood and urine physiological values in farm-cultured Rana catesbeiana (Anura: Ranidae) in Argentina. Revista de Biologia Tropical. 53(3-4): 545-559.
da Rosa, R.L., de Almeida, C.L., Somensi, L.B., Boeing, T., Mariano, L.N.B., de Medeiros Amorim Krueger, C., de Souza, P., Filho, V.C., da Silva, L.M., and de Andrade, S.F. 2019. Chrysophyllum cainito (apple-star): A fruit with gastroprotective activity in experimental ulcer models. Inflammopharmacology. 27(5): 985-996.
Dawood, M.A., Koshio, S., and Esteban, M.Á. 2018. Beneficial roles of feed additives as immunostimulants in aquaculture: A review. Reviews in Aquaculture. 10(4): 950-974.
Déciga-Campos, M., Ortiz-Andrade, R., Sanchez-Recillas, A., Flores-Guido, J.S., and Ramírez Camacho, M.A. 2017. Antinociceptive and antihyperalgesic activity of a traditional Maya herbal preparation composed of Pouteria campechiana, Chrysophyllum cainito, Citrus limonum, and Annona muricata. Drug Development Research. 78(2): 91-97.
Doan, H.V. and Le, T.P. 2020. Chrysophyllum cainito: A tropical fruit with multiple health benefits. Evidence-Based Complementary and Alternative Medicine. 2020: 7259267.
Doan, H.V., Riyajan, S., Iyara, R., and Chudapongse, N. 2018. Antidiabetic activity, glucose uptake stimulation and α-glucosidase inhibitory effect of Chrysophyllum cainito L. stem bark extract. BMC Complementary and Alternative Medicine. 18(1): 267.
Elumalai, P., Kurian, A., Lakshmi, S., Faggio, C., Esteban, M.A., and Ringø, E. 2020. Herbal immunomodulators in aquaculture. Reviews in Fisheries Science & Aquaculture. 29(1): 33-57.
Ferrara, E., Gustinelli, A., Fioravanti, M.L., Restucci, R., Quaglio, F., Marono, S., and Piccolo, G. 2015. Histological and micro-/macro-morphological evaluation of intestine in sharpsnout seabream (Diplodus puntazzo) fed soybean meal-based diets added with MOS and inulin as prebiotics. Aquaculture International. 23(6): 1525-1537.
Flegg, H.M. 1973. Ames Award Lecture 1972. An investigation of the determination of serum cholesterol by an enzymatic method. Annals of Clinical Biochemistry: An International Journal of Biochemistry and Laboratory Medicine. 10(1-6): 79-84.
Harborne, J.B. 1998. Phytochemical methods: a guide to modern techniques of plant analysis. Chapman and Hall, Ltd, London, UK.
Haselgrübler, R., Lanzerstorfer, P., Röhrl, C., Stübl, F., Schurr, J., Schwarzinger, B., Schwarzinger, C., Brameshuber, M., Wieser, S., Winkler, S. M., and Weghuber, J. 2019. Hypolipidemic effects of herbal extracts by reduction of adipocyte differentiation, intracellular neutral lipid content, lipolysis, fatty acid exchange and lipid droplet motility. Scientific Reports. 9(1): 10492.
Jahazi, M.A., Hoseinifar, S.H., Jafari, V., Hajimoradloo, A., Van Doan, H., and Paolucci, M. 2020. Dietary supplementation of polyphenols positively affects the innate immune response, oxidative status, and growth performance of common carp, Cyprinus carpio L. Aquaculture. 517: 734709.
Kamatit, W., Aoki, S., and Munglue, P. 2016. Effects of dietary waterlily (Nymphaea pubescens) stamen extract on growth performance and intestinal morphology of common lowland frog (Rana rugulosa). Asia-Pacific Journal of Science and Technology. 22(2): 30-41.
Karnjanapratum, S., Nilsuwan, K., Benjakul, S., and Sumpavapol, P. 2019. Oil from Asian bullfrong (Rana tigerina) skin: Antimicrobial activity and its application in emulsion gelatin-based film. Chiang Mai University Journal of Natural Sciences.18(1): 68-79.
Khambaione, S., Somnate, K., and Munglue, P. 2021. Effects of dietary lasia (Lasia spinosa (L.) Thwaites) extract on growth performance and physiological indices of common lowland frog (Rana rugulosa). Journal of Food Health and Bioenvironmental Science. 14(1): 51-63.
Khunchalee, J., and Munglue, P. 2020. Effects of cardamonin enriched diets on growth, intestinal histology, hematology, and biochemical parameters of hybrid catfish (Clarias macrocephalus × Clarias gariepinus). Chiang Mai University Journal of Natural Sciences.19(4): 900-916.
Klahan, R., and Pimpimol, T. 2018. Growth performance and feed utilisation of common lowland frog (Rana rugulosa Wiegmann) fed diet supplemented with protease from papaya peel. Maejo International Journal of Science and Technology. 12(3): 232-240.
Le, A.V., Parks, S.E., Nguyen, M.H., and Roach, P.D. 2018. Improving the vanillin-sulphuric acid method for quantifying total saponins. Technologies. 6(3): 84.
Lowry, O.H., Rosebrough, N.J., Farr, A.L., and Randall, R.J. 1951. Protein measurement with the Folin phenol reagent. Journal of Biological Chemistry. 193(1): 265-275.
Luo, X.-D., Basile, M.J., and Kennelly, E.J. 2002. Polyphenolic antioxidants from the fruits of Chrysophyllum cainito L. (star apple). Journal of Agricultural and Food Chemistry. 50(6): 1379-1382.
Mahfuz, S., Shang, Q., and Piao, X. 2021. Phenolic compounds as natural feed additives in poultry and swine diets: A review. Journal of Animal Science and Biotechnology. 12(1): 48.
Munglue, P., Rattana, K., Sangchanjiradet, S., and Dasri, K. 2019. Effect of dietary lasia (Lasia spinosa (L.) Thwaites) extract on growth performance and intestinal histology in hybrid catfish (Clarias macrocephalus × Clarias gariepinus). Chiang Mai University Journal of Natural Sciences. 18(2): 226-249.
Ningsih, I.Y., Sofyan, M.D., Prabandari, T., Lachtheany, V., and Hidayat, M.A. 2020. Antioxidant and α-glucosidase inhibitory activities of four types of Crysophyllum cainito L. fruit. Fabad Journal of Pharmaceutical Sciences. 45: 105-115.
Nyman, S. 1986. Mass mortality in larval Rana sylvatica attributable to the bacterium, Aeromonas hydrophila. Journal of Herpetology. 20: 196-201.
Reverter, M., Bontemps, N., Lecchini, D., Banaigs, B., and Sasal, P. 2014. Use of plant extracts in fish aquaculture as an alternative to chemotherapy: current status and future perspectives. Aquaculture. 433: 50-61.
Roy, A.M., Krishnan, M.L., and Bharadvaja, N. 2018. Qualitative and quantitative phytochemical analysis of Centella asiatica. Natural Products Chemistry and Research. 6: 1-4.
Schumann, G., Bonora, R., Ceriotti, F., Férard, G., Ferrero, C.A., Franck, P.F.H., … Schimmel, H.G. 2002. IFCC primary reference procedures for the measurement of catalytic activity concentrations of enzymes at 37°C: Part 4. Reference procedure for the measurement of catalytic concentration of alanine aminotransferase. Clinical Chemistry and Laboratory Medicine. 40: 718-724.
Seliverstova, E.V., and Prutskova, N.P. 2012. Morphofunctional changes in small intestine epithelium of frog Rana temporaria in the course of hibernation. Journal of Evolutionary, Biochemistry and Physiology. 48(3): 295-305.
Shamsa, F., Monsef, H., Ghamooshi, R., and Verdian-rizi, M. 2008. Spectrophotometric determination of total alkaloids in some Iranian medicinal plants. The Thai Journal of Pharmaceutical Sciences. 32(1): 17-20.
Sharma, A., Deo, A.D., Riteshkumar, S.T., Chanu, T.I., and Das, A. 2010. Effect of Withania somnifera (L. Dunal) root as a feed additive on immunological parameters and disease resistance to Aeromonas hydrophila in Labeo rohita (Hamilton) fingerlings. Fish & Shellfish Immunology. 29(3): 508-512.
Sofowora, A., Ogunbodede, E., and Onayade, A. 2013. The role and place of medicinal plants in the strategies for disease prevention. African Journal of Traditional, Complementary and Alternative Medicines. 10(5): 210-229.
Sokooti, R., Dezfoulnejad, M.C., and Baboli, M.J. 2021. Effects of olive leaf extract (Olea europaea Leecino) on growth, haematological parameters, immune system and carcass composition in common carp (Cyprinus carpio). Aquaculture Research. 52(6): 2415-2423.
Thip-uten, T., Tippayawat, P., Yuangsoi, B., and Wongmaneeprateep, S. 2021. Dietary spirulina (Arthrospira platensis) supplementation on growth performance, haematology, immune response and disease resistance of rugose frog (Hoplobatrachus rugulosus). Journal of Pure and Applied Microbiology. 15(3): 1139-1149.
Thummek, P., Aoki, S., and Munglue, P. 2016. Growth performance and intestinal morphology of Common lowland frog (Rana rugulosa) fed diets supplemented with lotus (Nelumbo nucifera Gaertn.) stamen extract. Asia-Pacific Journal of Science and Technology. 22(2): 18-29.
Tietz, N.W., Rinker, A.D., and Shaw, L.M. 1983. IFCC methods for the measurement of catalytic concentration of enzymes Part 5. IFCC method for alkaline phosphatase (orthophosphoric-monoester phosphohydrolase, alkaline optimum, EC 3.1.3.1). Journal of Clinical Chemistry and Clinical Biochemistry. 21(11): 731-748.
Van Doan, H., Hoseinifar, S.H., Chitmanat, C., Jaturasitha, S., Paolucci, M., Ashouri, G., Dawood, M.A.O., and Esteban, M.Á. 2019. The effects of Thai ginseng, Boesenbergia rotunda powder on mucosal and serum immunity, disease resistance, and growth performance of Nile tilapia (Oreochromis niloticus) fingerlings. Aquaculture. 513: 734388.
Vallejos-Vidal, E., Reyes-López, F., Teles, M., and MacKenzie, S. 2016. The response of fish to immunostimulant diets. Fish & Shellfish Immunology. 56: 34-69.
Wongtha, S., Rattana, K., Sangchanjiradet, S., Dasri, K., and Munglue, P. 2019. Dietary supplementation with Limnophila aromatica extract on growth performance and physiological responses in Rana rugulosa. Journal of Food Health and Bioenvironmental Science. 12(3): 1-12.
Yousefi, M., Hoseini, S.M., Vatnikov, Y.A., Kulikov, E.V., and Drukovsky, S.G. 2019. Rosemary leaf powder improved growth performance, immune and antioxidant parameters, and crowding stress responses in common carp (Cyprinus carpio) fingerlings. Aquaculture. 505: 473-480.
Zhang, C.H., Huang, K., Wang, L., Song, K., Zhang, L., and Li, P. 2015. Apparent digestibility of coefficients and amino acid availability of common protein ingredients in the diets of bullfrog, Rana (Lithobates) catesbeiana. Aquaculture. 437: 38-45.
Zhu, W., Zhang, M., Chang, L., Zhu, W., Li, C., Xie, F., Zhang, H., Zhao, T., and Jiang, J. 2019. Characterizing the composition, metabolism and physiological functions of the fatty liver in Rana omeimontis tadpoles. Frontiers in Zoology. 16: 42.
OPEN access freely available online
Natural and Life Sciences Communications
Chiang Mai University, Thailand. https://cmuj.cmu.ac.th
Aroon Jankham1, Wilawan Promprom2, 3, Wannachai Chatan2, 3, Kajita Somnate1, Somsak Khambaione2, 4, and Phukphon Munglue1, 3, *
1 Faculty of Science, Ubon Ratchathani Rajabhat University, Ubon Ratchathani 34000, Thailand.
2 Faculty of Science, Mahasarakham University, Mahasarakham 44150, Thailand.
3 Plant and Innovation Research Unit, Mahasarakham University, Mahasarakham 44150, Thailand.
4 Pakse Teachers Training College, Km 3, 13 South Road, Pakse 031212262, Laos.
Corresponding author: Phukphon Munglue, E-mail: phukphon.m@ubru.ac.th
Total Article Views
Editor: Tonapha Pusadee,
Chiang Mai University, Thailand
Article history:
Received: April 12, 2023;
Revised: December 14, 2023;
Accepted: January 2, 2024;
Online First: January 12, 2024