 ISSN: 2822-0838 Online

Determination of Critical Limit of Zinc for Lentil (Lens culinaris L.) in Diverse Soils under Intensive Cropping Systems
Mousumi Akter, Khairul Alam*, Harunur Rashid, Habib Mahammad Naser, Sarmin Sultana, Suman Biswas, Sohela Akhter, Ashraf Hossain, Akbar Hossain, and Sharif AhmedPublished Date : September 26, 2023
DOI : https://doi.org/10.12982/NLSC.2023.066
Journal Issues : Number 4, October-December 2023
Abstract Determination of the critical limit (CL) for nutritionally essential zinc (Zn) is very important in developing fertilizer recommendations for crops and soils. However, the CL of Zn for the lentil crop has not been determined yet in Bangladesh, leading to the use of a fertilizer rate for the crop estimated on the basis of old critical limit generalised for all crops. A study was conducted in the Greenhouse facilities of the Soil Science Division of BARI, Gazipur, from October to April (Rabi season) of 2018/2019 and 2019/2020, to determine Zinc CL for soils and lentil crop in soils collected at twenty locations encompassing the six Agro-Ecological Zones (AEZs) of Bangladesh. For extraction of available Zn concentrations from soils and lentil biomass, a diethylene triamine penta acetic acid (DTPA) (0.005 M) solution was used. The DTPA-extractable Zn (mg kg-1) in the soils were from 0.43 to 4.10 and from 0.52 to 4.20 in 2018/2019 and 2019/2020, respectively. In all seasons, accessible Zn had negative but substantial correlations with soil pH, soil P, Ca, and Mg in available forms, but the association between available Zn and lentil dry matter was positive and significant (DM). Soil Zn had also a positive significant correlation with Zn concentration of lentil tissue Zn (0.501**). In 2018-2019 and 2019-2020, the CL of EDTA-extractable Zn was determined to be 0.75 mg kg-1 and 0.68 mg kg-1 in soils for lentil crop (0.72 mg kg-1 on an average), respectively, while it was 48.6 mg kg-1 for lentil tissue. The revised CL can be used for fertilizer recommendation for the lentil crop in the entire Gangetic Plains and other Agro-Ecological Zones of Bangladesh.
Keywords: Pulse crop, Nutrient management, Micronutrient, Dryland crop, Sustainable agriculture
Funding: The authors are grateful for the research funding provided by the Ministry of Agriculture and IZA for the promotion of zinc fertilizer use in Bangladesh to address micronutrient malnutrition and enhance crop yield.
Citation: Akterm M., Alam, K., Rashid, H., Naser, H.M., Sultana, S., Biswas, S., Akhter, S. Hossain, A., Hossain, A., Ahmed, S. 2023. Determination of critical limit of zinc for lentil (Lens culinaris L.) in diverse soils under intensive cropping systems. Natural and Life Sciences Communications. 22(4): e2023066.
INTRODUCTION
The widely cultivated grain legume lentil (Lens culinaris L.) is renowned for its dietary advantages and contribution to agricultural systems. With a global production of roughly 4.5 million tonnes per year (FAOSTAT, 2020), it is grown in a number of nations, including Bangladesh, China, India, Canada, Iran, Nepal, Syria, Turkey, Pakistan and the United States. According to Mudryj et al. (2014), lentils are a good source of protein, fibre, and important minerals like iron (Fe), zinc (Zn), folate, and magnesium (Mg). Additionally, lentils contain phytochemicals with antioxidant and anticarcinogenic properties, such as saponins and tannins, which raise the possibility of anticancer effects (Mudryj et al., 2014). Lentils are important as a food source, but they are also valuable as palatable, nutrient-rich feed for animals (Blair, 2018). Lentils provide a protein source that is about 2.5 times higher than cereals, with a protein concentration of around 25%. They also contain a variety of vitamins and minerals, as well as lipids (0.5-4.33%), fibre (11%), carbs (63%), and a range of fats (USDA, 2015). Lentils’ delayed digestion and absorption of carbohydrates help manage diabetes and obesity (Mudryj et al., 2014). Like other leguminous plants, lentils have the extraordinary capacity to fix atmospheric nitrogen through their root nodules, improving soil fertility and making them valuable cropping system components. This improvement in soil fertility highlights the significance of using lentils in agricultural practices even more.
For normal growth and reproduction in plants, animals and human being, Zn is a crucial element. For several enzymes in plants, it functions as a structural or regulatory co-factor (Barak and Helmke, 1993; Phuphong et al., 2018). However, due to low Zn levels in soils, Zn insufficiency is a problem that affects over 30% of the population worldwide (Welch, 2002; WHO, 2016). Large portions of the agricultural land in many nations, including China, the Philippines, Bangladesh, India and Pakistan, are deficient in Zn (Alloway, 2008).
Zinc bioavailability is influenced by soil properties including pH, lime concentration, organic matter, clay type, and phosphatic fertiliser application (Adiloglu and Adiloglu, 2006). Zinc availability for crops is influenced by its shape and accessibility for plant uptake in addition to the total amount of Zn present in the soil (Kabata-Pendias and Pendias, 2001; Phuphong et al., 2018). On the other hand, back-to-back cropping in the Zn deficient soils can eventually cause human Zn deficiency resulting in health complications (Alloway, 2008). As a result, relying solely on the Zn concentration of the soil does not ensure that crops will receive enough Zn (Sims and Johnson, 1991).
Crop productivity may suffer because of soil Zn shortage. Studies have shown that Zn deficiency causes yield losses in a variety of crops, including maize, rice, chickpea and lentil, in many parts of the world (Sillanpaa, 1990; Panomjan et al., 2016). The productivity of the lentil crop has been decreasing in the Indo-Gangetic Plains, possibly as a result of a deteriorating Zn deficit and fluctuating Zn availability in cultivated soils (Hossain et al., 2020). With serious consequences for human health, Zn deficiency is particularly prevalent among Bangladesh's people and soils. Around 41% of Bangladeshi children under the age of five experience stunted growth, which has been linked to a general Zn deficiency (Rahman et al., 2016; GAIN, 2016). Optimising the Zn content of crops is essential to addressing the problem of Zn insufficiency in both individuals and crops. A promising strategy to address unmet hunger is biofortification, which raises nutritional levels in food crops and is thought to be safer than food supplements (CAST, 2020). Zinc fertilisers are frequently used to biofortify cereal grains and prevent Zn deficiency in soils (Alloway, 2008).
The use of Zn at high or low rates in the soil for crops is both the ways harmful to the soil (Singh et al., 2005). The uptake of other nutrients from the soil is regulated by the presence of Zn at optimal levels in the soil (Alloway, 2012). The indiscriminate use of fertilizer nutrients can diminish soil productivity and, eventually, crop performance. Hence, it would be desirable to establish a reasonable Zn threshold level in soils when making fertilizer recommendations for crops (BARC, 2018). Finding a practical threshold level of Zn in soils is essential to ensuring optimum Zn fertiliser application. The critical limits (CLs) of Zn for soils and crops, which might vary between soil types and crop species, are the basis for the current fertiliser recommendations (Singh, 2007). Sadly, there is no data on how lentil crops respond to applied Zn in soils with low levels of Zn, and Bangladesh has not established a specific CL for Zn in lentil agriculture across a range of soils. Therefore, the purpose of this study is to establish the Zn critical limit for lentil crops in various soil types using intensive cropping systems. We can provide accurate fertiliser recommendations that optimise the application of Zn and boost lentil output by developing suitable CLs. This study also aims to fill a knowledge gap regarding Zn treatment techniques of lentil, which will help efforts to reduce Zn deficiency in soil and human populations. This study will offer important insights into enhancing lentil production and treating Zn deficiency in agricultural systems by examining the response of lentil crops to various Zn-deficient soils and Zn application.
MATERIALS AND METHODS
Experimental location
The study was performed during October to December in 2018 and 2019 and the pot experiment was conducted in the greenhouse facility of the Soil Science Division with having GPS coordination of 23°59'38.44" N Latitude and 90°24'57.755" E Longitude in Bangladesh Agricultural Research Institute, Gazipur, Bangladesh during January to March in 2019 and 2020. The net house is a metal-framed structure enclosed by a net to pass through the necessary sunlight, moisture and air through its gaps and also to protect against animal attack. In each year, the soil was collected from the different AEZs of Bangladesh from the top 0–15 cm soil depth of a total of 20 places. The detail of the soils are tabulated below (Table 1) and the soil collection locations are shown in Figure 1.
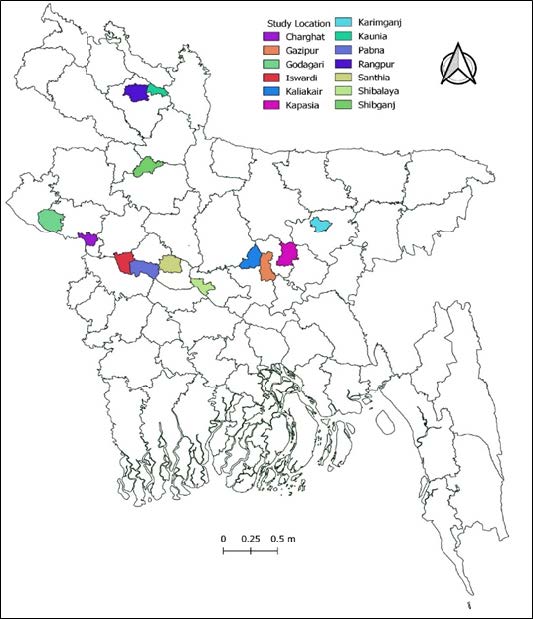
Figure 1. The locations and soil series of the collected samples.
Table 1. Locations of soil samples collected in Bangladesh.
|
Spot |
Upazila |
Soil series |
Spot |
Upazila |
Soil series |
|
1 |
Kishoregonj |
Gangachara |
11 |
Kapasia |
Sonatola |
|
2 |
Rangpur sadar |
Gangachara |
12 |
Pabna Sadar |
Sara |
|
3 |
Kaunia |
Gangachara |
13 |
Ishurdi |
Ishurdi |
|
4 |
Shibgong |
Gangachara |
14 |
Ishurdi |
Sara |
|
5 |
Shibaloy |
Gopalpur |
15 |
Ishurdi |
Gopalpur |
|
6 |
Charghat |
Sara |
16 |
Kapasia |
Tejgaon |
|
7 |
Charghat |
Gopalpur |
17 |
Kapasia |
Belabo |
|
8 |
Godagari |
Nachol |
18 |
Gazipur sadar |
Siata |
|
9 |
Godagari |
Ghior |
19 |
Gazipur sadar |
Garua |
|
10 |
Nondonpur |
Bera |
20 |
Kaliakoir |
Chiata |
Soil sample collection
The bulk amounts of soils (n = 20, 0-15cm depth) were collected from the representative soil series in a way so that they are represented in the respective AEZs and areas representing rice-based intensive triple crops production. The collection of 20 soils included six major Agro-Ecological Zones of Bangladesh, namely Tista Meander Floodplain (AEZ 3), Karatoya-Bangali Floodplain (AEZ 4), Young Brahmaputra and Jamuna Floodplain (AEZ 8), High Ganges River Floodplain (AEZ 11), Low Ganges River Floodplain (AEZ 12) and Madhupur Tract (AEZ 28) covering seven districts. At least three sites of the same soil series were covered for each of the 20 soils collections. The sampling locations had a diversified land and for laboratory analysis, individually the soils were air-dried, ground to pass through a 2 mm sieve.
Chemical analysis
Soil pH and organic matter were determined according to Jackson (1962) and Walkley and Black (1934), respectively. Determination of potassium (K), calcium (Ca), and magnesium (Mg) were carried out using the ammonium acetate (NH4OAC) extractable technique. The Bray and Kurtz method was used to calculate phosphorus (Hanlon and Johnson, 1984). Lindsay and Norvell's approach was used to extract Zn from soil (Lindsay and Norvell, 1978). In brief, 1 L of distilled water was used to dissolve 149.2 g triethanolamine (TEA) and 14.7 g CaCl2.2H2O were dissolved. Then, under steady stirring, the DTPA solution (16.67 g diethylene triamine pentaacetic acid (DTPA)) was added into the TEA–CaCl2 mixture. Upon complete dissolving of DTPA, the solution was made up to 9 L. The solution was then adjusted to pH 7.3 using HCl and diluted with distilled water to a volume of 10 L. Thus, the DTPA solution preparation was done. A hollow cathode Zn tube was used to calibrate the atomic absorption spectrophotometer (AAS) with a reference solution of 0.5 mg Zn mL-1. The standard was produced by pipetting 0.5 mL of a stock solution containing 1000 mg Zn mL-1 into a 1 L volumetric flask (Lindsay and Norvell, 1978).
Design of pot experiment
The experiment was carried out following a completely randomized design (CRD) where two Zn levels (0 and 5 mg kg-1) on soils were applied replicating thrice, resulting in a total of 6 pots for each soil. The lentil crop variety BARI moshur-6 (developed by the Pulses Research Centre, Bangladesh Agricultural Research Institute's) was used as a test crop. The pot's dimensions were 26 cm x 31 cm (height x diameter). Each pot was filled with 10 kg of soil, which was then weighed and divided into six pots. In each pot, ten lentil seeds were sown. Eight plants were allowed to grow after germination. For crop growth, each pot provided a basal dose from urea (14 mg kg-1 N), triple superphosphate (25 mg kg-1 P), muriate of potash (30 mg kg-1 K), gypsum (14 mg kg-1 S), and boric acid (1.5 mg kg-1 B). As a Zn source, zinc sulfate heptahydrate was applied along with other fertilizers. Plants were irrigated with distilled water as per the requirement to keep soil moisture. In all pots, as urea, 7 ppm N was supplied after 25 days of sowing.
Data collection
The lentil plants were harvested by uprooting at 100% flowering and clean all root-soil by the washing of distilled water. The individual pot samples were dried separately in an oven at 65°C temperature for 48 hours and then dry matter (DM) yield was recorded. Lentil plant samples (botrh roots and shoots) were collected from each pot were then ground with a grinder (stainless steel) before grinding by a Wiley Plant Sample Grinder. The samples were digested by a digester with the mixture of HNO3, HCLO4, and H2SO4 at the ratio of 10:4:1 on a hot plate and then filtered by Whatman no. 42 filter paper to determine Zn by Atomic Absorption Spectrophotometer (AAS).
CL Determination
According to the procedure described by Cate and Nelson (1965), a scattered diagram was drawn by plotting relative yields of each replicate (DM yield percent of Bray) along the Y-axis versus soil test values along the X-axis. Bray’s percent DM yield or % relative yield was estimated by the equation below. The average of the 20 relative yield data was calculated and pointed on the Y axis. A horizontal line parallel to X axis was drawn from that point. From the cut point of horizontal line and trend line a perpendicular line parallel to Y axis was drawn on the X axis. The cut point of perpendicular line on the X axis was the critical limit of the specific crop for the specific nutrient.
Bray’s percent dry matter yield (DM) or % relative yield = (Dry matter yield without Zn treatment × 100)/ (Dry matter yield with Zn treatment) .................... (1)
Data analysis
The mean data of six replications were presented with its standard errors. The critical limit was plotted using Microsoft excel.
RESULTS
Properties of soils
Soil textures differed greatly with locations (Table 2). The collected soils were clay loam to sandy loam in textural class. The concentration of extractable Zn distinctly varied. In 2019 and 2020, the DTPA Zn concentration (mg kg-1) in the soils were from 0.43 to 4.10 and from 0.52 to 4.2, respectively.
Table 2. DTPA Zn status of the collected soils.
|
Spot |
Upazila |
Soil series |
AEZs |
Textural class |
DTPA Zn (2018-2019) |
DTPA Zn (2019-2020) |
|
1 |
Kishoregonj |
Gangachara |
AEZ 3 |
Sandy clay loam |
1.94 ± 0.21 |
1.92 ± 0.15 |
|
2 |
Rangpur sadar |
Gangachara |
AEZ 3 |
Sandy clay loam |
4.10 ± 0.58 |
4.20 ± 0.40 |
|
3 |
kaunia |
Gangachara |
AEZ 3 |
Clay |
0.71 ± 0.05 |
0.65 ± 0.05 |
|
4 |
Shibgong |
Gangachara |
AEZ 4 |
Clay loam |
3.62 ± 0.77 |
1.57 ± 0.15 |
|
5 |
Shibaloy |
Gopalpur |
AEZ 8 |
Sandy clay loam |
1.10 ± 0.14 |
1.01 ± 0.10 |
|
6 |
Charghat |
Sara |
AEZ 11 |
Loam |
0.56 ± 0.06 |
0.58 ± 0.04 |
|
7 |
Charghat |
Gopalpur |
AEZ 11 |
Sandy clay loam |
0.76 ± 0.03 |
0.72 ± 0.05 |
|
8 |
Godagari |
Nachol |
AEZ 11 |
Sandy loam |
1.54 ± 0.12 |
1.51 ± 0.09 |
|
9 |
Godagari |
Ghior |
AEZ 11 |
Sandy clay loam |
1.00 ± 0.05 |
1.20 ± 0.05 |
|
10 |
Nondonpur |
Bera |
AEZ 12 |
Sandy clay loam |
0.48 ± 0.02 |
0.80 ± 0.08 |
|
11 |
Kapasia |
Sonatola |
AEZ 12 |
Clay loam |
0.89 ± 0.05 |
1.01 ± 0.10 |
|
12 |
Pabna Sadar |
Sara |
AEZ 12 |
Loam |
0.87 ± 0.07 |
1.20 ± 0.14 |
|
13 |
Ishurdi |
Ishurdi |
AEZ 12 |
Clay loam |
0.43 ± 0.03 |
0.49 ± 0.05 |
|
14 |
Ishurdi |
Sara |
AEZ 12 |
Sandy clay loam |
0.55 ± 0.09 |
0.52 ± 0.10 |
|
15 |
Ishurdi |
Gopalpur |
AEZ 12 |
Sandy clay loam |
0.79 ± 0.06 |
0.91 ± 0.08 |
|
16 |
Kapasia |
Tejgaon |
AEZ 28 |
Sandy clay loam |
0.64 ± 0.06 |
0.81 ± 0.06 |
|
17 |
Kapasia |
Belabo |
AEZ 28 |
Clay loam |
1.20 ± 0.10 |
1.11 ± 0.15 |
|
18 |
Gazipur sadar |
Siata |
AEZ 28 |
Clay loam |
1.03 ± 0.12 |
1.01 ± 0.09 |
|
19 |
Gazipur sadar |
Garua |
AEZ 28 |
Sandy clay loam |
0.53 ± 0.05 |
0.63 ± 0.07 |
|
20 |
Kaliakoir |
Chiata |
AEZ 28 |
Sandy loam |
0.79 ± 0.08 |
1.07 ± 0.12 |
|
Mean |
1.18 |
1.15 |
||||
|
Range |
0.43-4.10 |
0.49-4.20 |
||||
AEZ, Agro-Ecological Zone
The soils which were collected from Shibgonj and Rangpur Sadar belong to the Gangachara series under textural classes of clay loam and sandy clay loam, respectively, displayed the highest Zn concentration (mg kg-1), such as 3.62 and 4.20. Conversely, soils of Ishurdi, Bera, Gerua, Sara and Tejgaon soils series were clay loam, sandy clay loam, sandy clay loam, loam and sandy clay loam in texture, respectively. The pH of soils varied from slightly acidic to slightly alkaline in reactions while the organic matter content was low (70% soils) and very low (30% soils) (data not shown).
Correlation among soil properties and plant dry matter
Tables 3 and 4 show the relationship between soil parameters and lentil DM yield. In 2019, DTPA-Zn had negative correlations with soil pH (r = – 0.606), available P (r = – 0.505), exchangeable Ca (r = – 0.553), exchangeable Mg (r = – 0.537), and sand (r = – 0.100). On the other hand, positive correlations were observed between DTPA-Zn and the rest of the properties recorded in the study. Soil pH, available P, Ca, Mg, and relative DM yield all had a significant association with extractable Zn. In 2020, the DTPA-Zn had a negative correlation with soil reaction (pH) (r = – 0.511), available P (r = – 0.526), Ca (r = – 0.40), and Mg (r = – 0.516) in exchangeable forms, as well as a positive correlation with other properties. Significant but negative correlations were found between DTPA-Zn and soil pH, Mg (exchangeable), Ca (exchangeable form), P (available form), and relative dry matter yield.
Table 3. Relationship between DTPA-Zn and chemical properties of soils in 2018-2019 and 2019-2020.
|
Year |
Extractable Zn |
pH |
OM |
Available P |
Extractable K |
Extractable Ca |
Extractable Mg |
|
2018-19 |
DTPA–Zn |
-0.606** |
0.112ns |
-0.505** |
0.231ns |
-0.553** |
-0.537** |
|
2019-20 |
DTPA–Zn |
-0.511** |
0.163ns |
-0.526** |
0.095ns |
-0.400* |
-0.516** |
Note: ns, not significant,*= 5% level of significant, **=1% level of significant
Table 4. Relationship between DTPA-Zn and soil physical properties and lentil dry matter in 2018-2019 and 2019-2020.
|
Year |
Extractable Zn |
Relative DM yield |
Sand |
Silt |
Clay |
|
2018-19 |
DTPA–Zn |
0.516** |
-0.100ns |
0.014ns |
0.082ns |
|
2019-20 |
DTPA–Zn |
0.508** |
0.082ns |
0.037ns |
-0.109ns |
Note: ns, not significant,*=5% level of significance, **=1% level of significance.
Zn Concentration in plant biomass
The findings showed that the content of Zn in lentil dry matter was significantly affected by the addition of Zn to the soil. The amount of Zn in plant biomass increased when Zn was supplied to the soil, whereas the amount of Zn in lentil dry matter decreased when Zn was not added (Table 5).
The Bera series, characterized as sandy clay loam soil in the Low Ganges River Floodplain (AEZ), had the highest accumulation in Zn (81.5%) in biomass (sandy clay loam, AEZ: Low Ganges River Floodplain). The increase in Zn concentrations for Gopalpur (location: Charghat; Texture: sandy clay loam, and AEZ: High Ganges River Floodplain) and Gangachara series (location: Kaunia, texture: clay, AEZ: Tista Meander Floodplain) was 46% and 44.5%, respectively. The lentil is grown at Kishoregonj under the Gangachara series, Kapasia under Tejgaon series, and Godagari under Ghior series showed the slight increments of Zn, such as 1.3%, 1% and 0.8%, respectively due to added Zn (Table 5). The applied Zn boosted the DM yield of lentils in most of the soils. During 2018-2019, DM yield of lentils with added Zn ranged from 0.15 to 2.23 g pot-1 and for control 0.14 to 2.37 g Zn pot-1 (Table 5). For the soils examined, Bray's percent relative yield ranged from 66.4 to 108. (Table 5). In soils with poor Zn availability, adding Zn improved DM yield (0.79 to 1.10 mg kg-1 DTPA-Zn).
Table 5. DM yield and Zn concentration of lentil plants at 100% flowering stage after application of zinc during 2018-2019.
|
Sl. No. |
Soil location |
Soil series |
AEZs |
Zn concentration (mg kg-1) |
Total dry matter yield (g pot-1) |
% Relative yield |
|||
|
Zn+ |
Zn- |
Zn+ |
Zn- |
||||||
|
1 |
Kishoregonj |
Gangachara |
AEZ 3 |
68.40 |
67.10 |
2.23 ± 0.15 |
2.37 ± 0.13 |
107.00 ± 4.92 |
|
|
2 |
Rangpur sadar |
Gangachara |
AEZ 3 |
75.60 |
67.00 |
1.83 ± 0.11 |
1.86 ± 0.08 |
102.00 ± 4.33 |
|
|
3 |
Kaunia |
Gangachara |
AEZ 3 |
65.90 |
45.60 |
0.78 ± 0.09 |
0.71 ± 0.08 |
91.10 ± 6.47 |
|
|
4 |
Shibgong |
Gangachara |
AEZ 4 |
75.80 |
74.10 |
1.41 ± 0.05 |
1.53 ± 0.09 |
108.00 ± 2.23 |
|
|
5 |
Shibaloy |
Gopalpur |
AEZ 11 |
50.60 |
48.10 |
0.96 ± 0.09 |
0.90 ± 0.07 |
93.80 ± 5.68 |
|
|
6 |
Charghat |
Sara |
AEZ 11 |
27.40 |
20.10 |
0.96 ± 0.10 |
0.75 ± 0.12 |
78.40 ± 6.51 |
|
|
7 |
Charghat |
Gopalpur |
AEZ 11 |
78.60 |
53.80 |
1.40 ± 0.11 |
1.32 ± 0.07 |
94.30 ± 5.11 |
|
|
8 |
Godagari |
Nachol |
AEZ 8 |
57.40 |
53.10 |
0.49 ± 0.02 |
0.48 ± 0.04 |
98.00 ± 8.84 |
|
|
9 |
Godagari |
Ghior |
AEZ 11 |
61.20 |
60.40 |
2.01 ± 0.07 |
1.85 ± 0.05 |
92.20 ± 4.32 |
|
|
10 |
Nondonpur |
Bera |
AEZ 12 |
38.30 |
21.10 |
0.67 ± 0.09 |
0.48 ± 0.06 |
71.8 ± 7.60 |
|
|
11 |
Kapasia |
Sonatola |
AEZ 12 |
77.80 |
60.80 |
0.58 ± 0.07 |
0.54 ± 0.04 |
93.01 ± 7.01 |
|
|
12 |
Pabna Sadar |
Sara |
AEZ 12 |
34.40 |
33.40 |
0.64 ± 0.08 |
0.58 ± 0.05 |
90.60 ± 6.46 |
|
|
13 |
Ishurdi |
Ishurdi |
AEZ 12 |
67.00 |
47.10 |
0.72 ± 0.06 |
0.51 ± 0.10 |
71.20 ± 6.89 |
|
|
14 |
Ishurdi |
Sara |
AEZ 12 |
27.10 |
22.30 |
0.49 ± 0.05 |
0.35 ± 0.07 |
71.20 ± 8.61 |
|
|
15 |
Ishurdi |
Gopalpur |
AEZ 12 |
71.40 |
57.40 |
1.22 ± 0.05 |
1.13 ± 0.09 |
92.10 ± 7.56 |
|
|
16 |
Kapasia |
Tajgaon |
AEZ 28 |
68.40 |
67.40 |
0.65 ± 0.14 |
0.59 ± |
91.30 ± 8.93 |
|
|
17 |
Kapasia |
Belabo |
AEZ 28 |
69.60 |
67.20 |
0.19 ± 0.14 |
0.15 ± 0.05 |
80.40 ± 8.92 |
|
|
18 |
Gazipur sadar |
Siata |
AEZ 28 |
67.20 |
63.00 |
0.15 ± 0.13 |
0.14 ± 0.06 |
89.10 ± 6.23 |
|
|
19 |
Gazipur sadar |
Garua |
AEZ 28 |
75.10 |
68.20 |
0.50 ± 0.12 |
0.33 ± 0.07 |
66.40 ± 5.85 |
|
|
20 |
Kaliakoir |
Chiata |
AEZ 28 |
55.20 |
46.40 |
0.71 ± 0.04 |
0.66 ± 0.11 |
93.40 ± 3.97 |
|
|
Mean |
0.93 |
0.86 |
88.80 |
||||||
|
Range |
0.15-2.23 |
0.14-2.37 |
66.40-108.00 |
||||||
In 2019-2020, lentil DM yield ranged from 0.43 to 8.69 g pot-1 in Zn-supplied pots, and 0.28 to 7.66 g Zn pot-1 in control pots. The biomass output of lentils (Bray's percent yield) varied from 64.4 to 97.8% depending on the soils, demonstrating a wide range of soil types and fertility levels (Table 6). In soils with poor Zn fertility (0.65–1.2 mg kg-1 DTPA-Zn), adding Zn significantly increased DM yield.
Table 6. DM yield and Zn content of lentil plants at 100% flowering stage after application of zinc during 2019-2020.
|
Sl. No. |
Soil location |
Soil series |
AEZs |
Total dry matter yield (g pot-1) |
% Relative yield |
|
|||||
|
|
|
Zn+ Zn- |
|
||||||||
|
1 |
Kishoregonj |
Gangachara |
AEZ 3 |
68.40 |
67.10 |
2.23 ± 0.15 |
|
||||
|
2 |
Rangpur sadar |
Gangachara |
AEZ 3 |
75.60 |
67.00 |
1.83 ± 0.11 |
|
||||
|
3 |
Kaunia |
Gangachara |
AEZ 3 |
65.90 |
45.60 |
0.78 ± 0.09 |
|
||||
|
4 |
Shibgong |
Gangachara |
AEZ 4 |
75.80 |
74.10 |
1.41 ± 0.05 |
|
||||
|
5 |
Shibaloy |
Gopalpur |
AEZ 11 |
50.60 |
48.10 |
0.96 ± 0.09 |
|
||||
|
6 |
Charghat |
Sara |
AEZ 11 |
27.40 |
20.10 |
0.96 ± 0.10 |
|
||||
|
7 |
Charghat |
Gopalpur |
AEZ 11 |
78.60 |
53.80 |
1.40 ± 0.11 |
|
||||
|
8 |
Godagari |
Nachol |
AEZ 8 |
57.40 |
53.10 |
0.49 ± 0.02 |
|
||||
|
9 |
Godagari |
Ghior |
AEZ 11 |
61.20 |
60.40 |
2.01 ± 0.07 |
|
||||
|
10 |
Nondonpur |
Bera |
AEZ 12 |
38.30 |
21.10 |
0.67 ± 0.09 |
|
||||
|
11 |
Kapasia |
Sonatola |
AEZ 12 |
77.80 |
60.80 |
0.58 ± 0.07 |
|
||||
|
12 |
Pabna Sadar |
Sara |
AEZ 12 |
34.40 |
33.40 |
0.64 ± 0.08 |
|
||||
|
13 |
Ishurdi |
Ishurdi |
AEZ 12 |
67.00 |
47.10 |
0.72 ± 0.06 |
|
||||
|
14 |
Ishurdi |
Sara |
AEZ 12 |
27.10 |
22.30 |
0.49 ± 0.05 |
|
||||
|
15 |
Ishurdi |
Gopalpur |
AEZ 12 |
71.40 |
57.40 |
1.22 ± 0.05 |
|
||||
|
16 |
Kapasia |
Tajgaon |
AEZ 28 |
68.40 |
67.40 |
0.65 ± 0.14 |
|
||||
|
17 |
Kapasia |
Belabo |
AEZ 28 |
69.60 |
67.20 |
0.19 ± 0.14 |
|
||||
|
18 |
Gazipur sadar |
Siata |
AEZ 28 |
67.20 |
63.00 |
0.15 ± 0.13 |
|
||||
|
19 |
Gazipur sadar |
Garua |
AEZ 28 |
75.10 |
68.20 |
0.50 ± 0.12 |
|
||||
|
20 |
Kaliakoir |
Chiata |
AEZ 28 |
55.20 |
46.40 |
0.71 ± 0.04 |
|
||||
|
Mean |
4.43 |
3.75 |
84.8 |
||||||||
|
Range |
0.32-8.69 |
0.28-7.66 |
64.4-97.8 |
||||||||
Note: Zn+ = with Zn, Zn– = without Zn.
Critical limit of Zn in soil and lentil
The Cate and Nelson method, which makes use of a graphical procedure, was used to establish the critical limit (CL) of DTPA-Zn for lentil. The CL values for the two successive growth seasons of 2018–2019 and 2019–2020 were, respectively, 0.75 mg kg–1 and 0.68 mg kg–1 (Figure 2). In the soil, these values correspond to an average CL of roughly 0.72 mg kg-1 (Figure 2).
Additionally, 48.6 mg kg-1 of Zn was found to be the critical limit in lentil tissue (Figure 3). The Zn level at which the lentil plant must be for optimum growth and productivity is shown by this number.
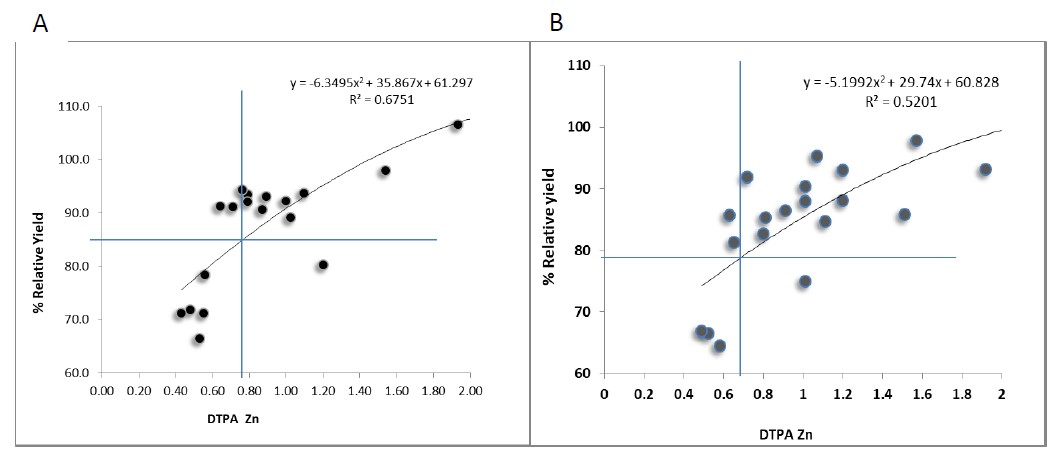
Figure 2. DTPA–Zn (mg kg-1) vs. % of the relative yield of lentils in different soils in 2018-2019 (A) and 2019-2020 (B).
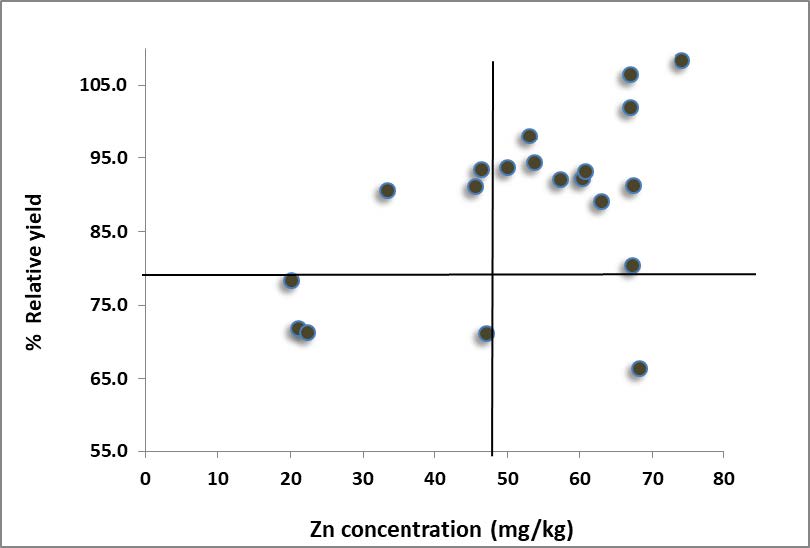
Figure 3. Zn content of lentil tissue (mg kg-1) vs. % of relative yield of lentil in some Bangladesh soils in 2018-2019
The CL values represent the lowest levels of DTPA-Zn in the soil and Zn in lentil tissue below which it is anticipated that zinc fertiliser applications will have a substantial impact on lentil crop growth. In other words, it is likely that the lentil crops will show signs of insufficiency, suffer from reduced growth, and yield when the DTPA-Zn concentration in the soil goes below 0.72 mg kg-1 or the Zn concentration in lentil tissue falls below 48.6 mg kg-1.
For precise fertiliser recommendations for Zn application in lentil agriculture, these established CL values are essential. Farmers may maximise lentil output and reduce the risk of zinc deficiency in both the crop and human being by making sure that the levels of zinc in the soil and plants stay above the critical limits.
DISCUSSION
This study determines the low Zn status in soils where lentils may respond to added Zn fertilizer. CL values in soil for lentil crop were 0.75 mg kg-1 in 2019 and 0.68 mg kg-1 in 2020, respectively (Figure 2). The 0.6 mg Zn kg-1 soil is now used as the CL in all versions of Bangladesh's fertilizer recommendation guide. So, the CL of Zn determined in this investigation is different to the value used nowadays (BARC, 2018). In cultivated valley fields of India, Indira Sarangthem et al. (2018) found that the CL of Zn was 0.69 mg kg-1 in soils and 0.21% for pea tissue. The critical level of Zn for wheat crop was also determined by Akhter et al. (2020) which was 0.82 mg kg-1 soil. Mehra et al. (2005) reported that both graphical and statistical methods indicated 0.95 mg kg-1 as the critical value of Zn in soils for maize. Madhavi et al. (2013) reported that CL of Zn in soils was 0.75mg kg-1. In another report, Mahata et al. (2014) reported that CL of DTPA–Zn in soils was 0.82 mg kg-1. On the other hand, the CL reported in the present study was also close to the critical level of Zn (0.82 and 0.83 mg kg-1) as observed by Akhter et al. (2020) for maize and Rahman et al. (2007) for rice. At present, CL of Zn in soils is 0.72 mg kg-1 (BARC 2018) and Zn status in many soils is below the CL. The established CL of Zn in the present study is higher than the value used currently (BARC, 2018) and lower than the other values as referred above. The findings showed that soils with low Zn content in representative soil series will respond well to external Zn supply. Because the soils of the Ganges River Floodplain (AEZ-11 and 12), Madhupur Tract (AEZ-28), Tista Meander Floodplain, and Karatoya-Bangali Floodplain (AEZ-4) have below 0.72 mg kg-1 DTPA-Zn, crops growing in these soils will respond to an external source of Zn (Table 2).
Twenty distinct soils from various soil series were used in this investigation. The soils used in this investigation represented diverse soil series. According to Rahman et al. (2007) and Kausadikar (2015), diverse soils in terms of a particular nutrient, such as Zn, had a larger chance of estimating the more correct CL. Variations in containing DTPA–Zn were observed as presented in Table 2. Soil reactions (pH), P, Ca and Mg in available forms were significantly correlated with Zn concentration (DTPA-Zn) in soils in both 2019 and 2020 (Tables 3 and 4). Jahiruddin et al. (1992) and Agarwal (1995) documented negative relationships between soil DTPA-Zn and other soil properties (pH and others). Lentil crops respond differently to different soils depending on their Zn status as evidenced by the significant correlation between DM yield DTPA-Zn concentration in soil.
As soils of the present study showed differences in properties, the plants demonstrated varied Zn concentrations with and without Zn supply. When Zn was added to the soil, lentil biomass yield showed an upward trend, corresponding to an increase in Zn concentration in plant tissues. The response was more pronounced in soils with low initial Zn content. Similar result was reported for rice, where the addition of Zn to Zn-deficient soils resulted in increased biomass yield (Sakal et al., 1982). Soil testing is one of the good indicators to determine the Zn in the extractable form in the soil so that crop performance in response to an external supply of Zn as Zn containing fertilizers can be forecasted. The response of the crop in terms of yield to the application of a particular nutrient decreases as the soil test value of that nutrient increases (Akter et al., 2020). In a wider variety of soils, a proper soil test is critical for predicting the amount of plant-available nutrients and the crop's response to fertilizers. In this regard, the measurement of CL is essential in determining a crop’s optimal fertilizer demand (Singh, 2007). The deficiency of Zn and other essential macronutrients in soils in the Indo-Gangetic plains and Bangladesh has been widely established (Singh, 2007). For the purpose of developing appropriate fertiliser recommendations and maximising crop yield output, the CL values determined in this study are crucial information.
To reduce the detrimental effects on grain output and nutritional quality, it is crucial to address Zn deficiency in crops. Global efforts are being made to prevent widespread hunger and enhance human health through biofortification, which entails raising nutrient concentrations in crops. Globally, a sizable fraction of soils are deficient in Zn, which lowers the amount of Zn in diets based on cereal and increases the risk of malnutrition. (Welch, 2002). It is the 5th leading cause of diseases in developing countries (WHO, 2016). The determination of CL values for Zn (0.68-0.75 mg kg-1 for soil and 48.6 mg/kg in lentil tissues in this study) emphasises the significance of Zn supplementation to improve Zn accumulation in plants. These findings have significance for biofortification initiatives and can direct researchers and policymakers in putting methods into practise to increase Zn availability in crops and alleviate nutritional deficiencies in population.
CONCLUSION
In several soil types with intensive cropping methods, this study established CL values for the Zn concentration in soil and lentil tissue. The findings showed that the soils had low Zn levels and that lentil crops responded well to Zn supplemental. The critical limits were 0.75 mg Zn kg-1 and 0.68 mg Zn kg-1 soil (0.6 mg Zn kg-1) for soil and 48.6 mg Zn kg-1 for lentil tissue in experiments done in 2018-2019 and 2019-2020, demonstrating that lentil responded to external Zn supplementation at/or below the amount of Zn in soils (threshold limits). As a result of the findings, the CL value of DTPA-Zn for soil was recommended to be 0.72 mg kg-1 (average of the two years), which was higher than the current value (0.60 mg kg-1). The crops grown in these soils containing <0.72 mg DTPA Zn kg-1 soil will show responding to Zn added in fertilizer or other forms in terms of growth and production. In addition, more soils will be brought under deficient category of Zn fertility in Bangladesh. The study’s CL values offer important insights for enhancing fertiliser recommendations and managing Zn deficiency in lentil crops in the Gangetic plains, including Bangladesh. To increase crop yield and alleviate micronutrient deficiency in population, additional study and the application of biofortification techniques are required.
ACKNOWLEDGMENTS
The authors thank the Ministry of Agriculture, Chemistry Labs of Soil Science Division at Bangladesh Agricultural Research Institute and farmers who helped us during field works. The authors also appreciate the contribution of the International Zinc Association (IZA) for the collaborative research project with BARI for the promotion of zinc fertilizer use in Bangladesh to address micronutrient malnutrition and enhance crop yield.
AUTHOR CONTRIBUTIONS
Mousumi Akter and Khairul Alam designed and carried out the experiment. They also prepared the first draft. Ashraful Alam, Harunur Rashid, Sharif Ahmed, HM Naser, S Sultana, S Biswas, Sohela Akhter, Akbar Hossain, Sharif Ahmed assisted in pot experiments, field works and laboratory analysis. They also performed the statistical analysis and data visualization, edited and corrected the manuscript. All authors have read and approved of the final manuscript.
CONFLICT OF INTEREST
The authors declare that they hold no competing interests.
REFERENCES
Adiloglu, A., and Adiloglu, S. 2006. The effect of boron (B) application on the growth and nutrient contents of maize in zinc deficient soil. Bulgarian Journal of Agricultural Science. 12(3): 387.
Agarwal, B., and Sastry, T.G. 1995. EDTA-an extraction for iron and zinc from different soils. Journal of Indian Society of Soil Science. 43(1): 126-127.
Akter, M., Alam M. K., Rashid, M. H., Akhter S., Naser, H., Sultana, S., and et al. 2020. Correction and standardization of critical limit of zinc for maize (Zea mays L.) crop: Bangladesh perspective. Journal of Plant Nutrition. 43(3): 371-383.
Alloway, B.J. 2008. Zinc in soils and crop nutrition. 2nd edition, IZA and IFA, Brussels, Belgium and Paris, France.
Alloway, B.J. 2012. Sources of heavy metals and metalloids in soils. p.11-50. In alloway BJ (ed) heavy metals in soils: Trace metals and metalloids in soils and their bioavailability, environmental pollution. Vol. 22, Springer, Dordrecht.
Barak, P., and Helmke, P.A. 1993. The chemistry of zinc. p.1-13. In Robson AD (ed) Zinc in soils and plants. Dordrecht: Kluwer Academic Publishers, Springer.
BARC. 2018. Fertilizer recommendation guide. Bangladesh Agricultural Research Council, Farmgate, Dhaka, Bangladesh.
Blair, R. 2018. Nutrition and feeding of organic poultry. 2nd edition, CABI, Wallingford, Oxfordshire OX10 8DE, United Kingdom.
CAST. 2020. Council for Agricultural Science and Technology (CAST). Food biofortification—reaping the benefits of science to overcome hidden hunger— a paper in the series on the need for agricultural innovation to sustainably feed the world by 2050. Issue Paper 69. CAST, Ames, Iowa.
Cate, R.B., and Nelson, L.A. 1965. A rapid method for correlation of soil test analysis with plant response data. International soil testing series technical Bulletin No.1 North Caroline State University, Agricultural Experiment Statistics, Releigh, USA, pp.135–136.
FAOSTAT. 2020. Agricultural data on primary crop. Retrieved from https://www.fao.org/faostat [Accessed on 5 July 2022]
GAIN. 2016. Dalberg Global Development Advisors, U.S. Agency for International Development. Embedding Nutrition in the Rice Value Chain in Bangladesh. GAIN Working Paper. Geneva: GAIN.
Hanlon, E., and Johnson, G. 1984. Bray/Kurtz, Mehlich III, AB/D and ammonium acetate extractions of P, K and Mg in four Oklahoma soils. Communications in Soil Science and Plant Analysis. 15(3): 277-294.
Hossain, A., Quddus, A., Alam, M.K., Naser, H.M., Anwar, B., Khatun, F., Rashid, H., Khatun, F., and Siddiky, A. 2020. Application of zinc, boron, and molybdenum in soil increases lentil productivity, nutrient uptake, and apparent balance. Canadian Journal of Soil Science. 101(1): 113-124.
Indira Sarangthem, L., Sharma, D., Oinam, N., and Punilkumar, L. 2018. Evaluation of critical limit of zinc in soil and plant. International Journal of Current Research in Life Sciences. 7(08): 2584-2586.
Jackson, M. 1962. Soil chemical analysis, constable and Co. Ltd., London, 496.
Jahiruddin, M., Chambers, B., Cresser, M., and Livesey, N. 1992. Effects of soil properties on the extraction of zinc. Geoderma. 52(3-4): 199-208.
Kabata-Pendias, A., and Pendias, H. 2001. Trace elements in soils and plants. CRC Press: Boca Raton, London, New York, Washington.
Kausadikar, H.K., Waikar S.L., and Dhamak A.L. 2015. Establishment of critical level of zinc in soil and soybean crop grown on Vertisol by graphical method. IOSR Journal of Agriculture and Veterinary Science. 8(1): 66-69.
Lindsay, W.L., and Norvell, W.A. 1978. Development of a DTPA soil test for zinc, iron, manganese, and copper 1. Soil Science Society of America Journal. 42(3): 421-428.
Madhavi, K., Yadav, K., and Kumari, N. 2013. Critical limits of zinc in soil and plants for maize in Diaraland soils of Bihar. Environment and Ecology. 31: 1107–1110.
Mahata, M., Debnath, P., and Ghosh S. 2014. Critical limits of zinc in soil and rice plant grown in alluvial soils of West Bengal, India. SAARC Journal of Agriculture. 10 (2): 137–46.
Mehra, R., Sharma, M.K., Jat, J., and Dadheech, R. 2005. Critical limits of zinc and iron in soil and plants for maize in Haplustalfs of sub-humid southern plain and Aravalli hills of Rajasthan. Journal of the Indian Society of Soil Science. 53: 227–231.
Mudryj, A.N., Yu, N., and Aukema, H.M. 2014. Nutritional and health benefits of pulses. Applied Physiology, Nutrition, and Metabolism. 39(11): 1197-1204.
Panomjan, N., Jamjod, S., Rerkasem, B., Dell, B., and Prom-u-thai, C. 2016. Variation of zinc concentration in rice caryopsis and husk among southern rice varieties grown in southern and northern Thailand. Chiang Mai University Journal of Natural Science. 15: 1-10.
Phuphong, P., Cakmak, I., Dell, B. and Prom-U-Thai, C. 2018. Effects of foliar application of zinc on grain yield and zinc concentration of rice in farmers’ fields. Chiang Mai University Journal of Natural Sciences. 17 (3): 181–90.
Rahman, M., Jahiruddin, M., and Islam, M. 2007. Critical limit of zinc for rice in calcareous soils. Journal of Agriculture & Rural Development. 5: 43-47.
Rahman, S., Ahmed, T., Rahman, A.S., Alam N., Ahmed A.S., Ireen S., Chowdhury, I.A., Chowdhury, F.P., and Rahman, S.M. 2016. Status of zinc nutrition in Bangladesh: the underlying associations. Journal of Nutritional Science. 5: e25.
Sakal, R., Singh, B., and Singh, A. 1982. Determination of critical limit of zinc in soil and plant for predicting response of rice to zinc application in calcareous soils. Plant and Soil, 66(1): 129-132.
Sillanpaa, M. 1990. Micronutrient assessment at the country level: an international study. 216 pp.
Sims, J., and Johnson, G. 1991. Micronutrient soil tests. Micronutrients in Agriculture. 4: 427-476.
Singh, B., Natesan, S.K.A., Singh, B., and Usha, K. 2005. Improving zinc efficiency of cereals under zinc deficiency. Current Science. 88(1): 6-44.
Singh, M. 2007. Efficiency of seed treatment for ameliorating zinc deficiency in crops. In Cakmak I (ed) Zinc Crops 2007, Improving Crop Production and Human Health, Istanbul, Turkey.
USDA. 2015. National nutrient database for standard reference, release 28. Nutrients: Vitamin C, total ascorbic acid. Retrieved from USDA National Nutrient Database-Vitamin C [Accessed on 7 August 2022].
Walkley, A., and Black, I.A. 1934. An examination of the Degtjareff method for determining soil organic matter, and a proposed modification of the chromic acid titration method. Soil Science. 37(1): 29-38.
Welch, R.M. 2002. The impact of mineral nutrients in food crops on global human health. Plant and Soil. 247(1): 83-90.
WHO. 2016. Vitamin and Mineral Nutrition Information System. World Health Organization〈www.who.int〉.
OPEN access freely available online
Natural and Life Sciences Communications
Chiang Mai University, Thailand. https://cmuj.cmu.ac.th
Mousumi Akter1, Khairul Alam2, 3, *, Harunur Rashid1, 4, Habib Mahammad Naser1, Sarmin Sultana1, Suman Biswas5, Sohela Akhter6, Ashraf Hossain1, Akbar Hossain7, and Sharif Ahmed8
1 Soil Science Division, Bangladesh Agricultural Research Institute, Joydebpur, Gazipur, Bangladesh.
2 Environment, CSIRO, Private Bag 5, Wembley, WA-6913, Australia.
3 Future Food Institute, Murdoch University, Perth, WA-150, Australia.
4 Global Centre for Environmental Remediation (GCER), University of Newcastle, Callaghan, New South Wales, Australia.
5 ASICT Division, Bangladesh Agricultural Research Institute, Joydebpur, Gazipur, Bangladesh.
6 Tuber Crops Research Centre, Bangladesh Agricultural Research Institute, Joydebpur, Gazipur, Bangladesh.
7 Department of Agronomy, Bangladesh Wheat and Maize Research Institute, Dinajpur 5200, Bangladesh.
8 International Rice Research Institute, Bangladesh Office, Dhaka 1213, Bangladesh.
Corresponding author: Khairul Alam E-mail: Khairul.Alam@csiro.au, khairul.krishi@gmail.com
Total Article Views
Editor: Wipawadee Yooin
Chiang Mai University, Thailand
Article history:
Received: July 27, 2023;
Revised: September 4, 2023;
Accepted: September 18, 2023;
Online First: September 26, 2023