 ISSN: 2822-0838 Online

Steroids from Toona sureni-derived Endophytic Fungi Stemphylium sp. MAFF 241962 and Their Heme Polymerization Inhibition Activity
Risyandi Anwar*, Galih Bayu Pratama, Unang Supratman*, Desi Harneti, Azmi Azhari, Sofa Fajriah, Mohamad Nurul Azmi, and Yoshihito ShionoPublished Date : July 10, 2023
DOI : https://doi.org/10.12982/NLSC.2023.055
Journal Issues : Number 3, July-September 2023
Abstract Antimalarial drug resistance is a major cause of the increasing incidence of malaria worldwide, necessitating an urgent demand for the development of new antimalarial drugs. However, the availability of bioactive natural compounds derived from plants is often limited. To address this issue, continuous exploration of bioactive secondary metabolites from endophytic fungi derived from medicinal plants has been recognized as a viable alternative. Therefore, this research aimed to isolate and characterize three ergosteroids, namely isocyathisterol (1), ergosterol-5,8-peroxide (3), cerevisterol (4), and a phytosterol, β-sitosterol (2), from the rice cultures of endophytic fungus Stemphylium sp. MAFF 241962, derived from Toona sureni. Endophytic fungi species were determined using molecular analysis of the internal transcribed region (ITS) of the ribosomal DNA. After comparing the sequence data to the NCBI database using BLAST, endophytic fungi were identified as Stemphylium sp. 241962 with 100% similarity. The chemical structures were elucidated using spectroscopic methods, including 1D and 2D NMR. Antimalarial activities of compounds 1-4 were evaluated using heme polymerization inhibition activity (HPIA) method. The results showed moderate inhibition activities with IC50 values of 7.70 ± 0.11, 9.48 ± 0.09, 7.88 ± 0.10, and 8.36 ± 0.56 mg/mL, respectively, compared to positive control chloroquine diphosphate with IC50 values of 1.59 ± 0.03 mg/mL.
Keywords: Steroid, Stemphylium sp., Toona sureni, Antimalarial activity, Heme polymerization inhibition
Funding: The authors are grateful to the Universitas Muhammadiyah, Semarang, Indonesia for the Research Grant for International Collaboration Grant, 2022, No. 0001/UNIMUS.L/PT/PJ.INT/2022 by Risyandi Anwar
Citation: Anwar, R., Pratama, G. B., Supratman, U., Harneti, D., Azhari, A., Fajriah, S., Azmi, M. N., and Shiono, Y. 2023. Steroids from Toona sureni-derived Endophytic Fungi Stemphylium sp. MAFF 241962 and Their Heme Polymerization Inhibition Activity. Natural and Life Sciences Communications. 22(3): e2023055.
INTRODUCTION
Malaria is still the most serious public health problem and lethal parasite infection globally due to the emergence and spread of its drug resistance (Ouattara et al., 2014; Fitriastuti et al., 2017). In 2020, the number of malaria cases worldwide increased to 241 million, with an estimated 627.000 deaths, of which 77% were children under the age of five (World Health Organization, 2021). Therefore, there is an urgent need to investigate new sources of antimalarial drugs.
Endophytic fungi are renowned as valuable sources of bioactive natural products with a wide spectrum of biological and pharmacological properties (Zhou et al., 2014; Deshmukh et al., 2018; Supratman et al., 2021a). These fungi live symbiotically inside the plant tissues without harming the plant and provide bioactive substances that may give the host plant advantages for survival and protection (Shiono et al., 2013). The host plants receive antimicrobials, growth regulators, insecticides, antivirals, and tolerance to abiotic stresses from endophytes (Ibrahim et al., 2018; Rana et al., 2020). Based on previous research, endophytic fungi that live inside medicinal plants have acquired the capacity to generate biologically active metabolites similar to those produced by their host plants (Supratman et al., 2021b; Suzuki et al., 2019). Some notable examples include taxol from Taxomyces andreanae and the host plant Taxus brevifolia (Uzma et al., 2018), which is also produced from Stemphylium sedicola SBU-16 and the host plant Taxus baccata (Mirjalili et al., 2012). These also include the antimalarial compounds artemisinin from Pseudonocardia sp. and the host plant Artemisia annua (Li et al., 2012), and quinine from Diaporthe sp. and Cinchona ledgeriana (Maehara et al., 2010). Therefore, endophytic fungi can be an alternative, dependable, and efficient way to produce bioactive secondary metabolites originating from plants (Uzma et al., 2018). Endophytic fungi, mostly found inside medicinal plants, have been recognized for their capability to produce a variety of bioactive compounds (Aly et al., 2010; Moussa et al., 2016; Li et al., 2020; Stricker et al., 2021).
Toona sureni is a medicinal plant from the Meliaceae family that contains a variety of secondary metabolites with a wide range of bioactivities and is popularly used for the conventional treatment of several illnesses, including malaria (Chen et al., 2009; Ekaprasada et al., 2015; Chini et al., 2016). This plant also produces some antimalarial compounds with potential activity (Cuong et al., 2007). A previous report described the isolation of a new steroid, (22E)-3α,6α,9a-ergosta-7,22-diene-3,6,9-triol from Periconia pseudobyssoides K5, an endophytic fungus derived from Toona sureni (Azhari et al., 2023). In further exploration for antimalarial substances, the chemical investigation of other endophytic fungi derived from Toona sureni, Stemphylium sp. MAFF 241962, was conducted. In this research, the isolation and structure elucidation of three ergosteroid, isocyathisterol (1), ergosterol-5,8-peroxide (3), and cerevisterol (4), as well as phytosterol, β-sitosterol (2), along with antimalarial activity using in vitro assay, the heme polymerization inhibition activity (HPIA) method, are described.
MATERIALS AND METHODS
General experimental procedures
IR spectra were recorded in a KBr plate using PerkinElmer Spectrum 100 FT-IR spectrometer (PerkinElmer, Shelton, USA). High resolution of mass spectra (HR-TOFMS) was determined on a Water Xevo Q-TOF direct probe/MS system, using ESI mode and microchannel plates MCPs detector (Milford, MA, USA). NMR spectra were recorded on JEOL JNM-ECX500R/S1 spectrometer (JEOL, Tokyo, Japan) and Bruker Topspin spectrometer (Karlsruhe, Germany) using 500 MHz for 1H and 125 MHz for 13C with TMS as an internal standard. Subsequently, column chromatography (CC) was conducted on silica gel 60 (70-230 and 230-400 mesh, Merck, Darmstadt, Germany) and octa desylsilane (Chromatorex® C18 DM1020 M, 200-400 mesh, Fuji Sylisia, Tokyo, Japan). Thin-layer chromatography (TLC) plates were precoated with silica gel GF254 (0.25 mm, Merck, Darmstadt, Germany), and spot detection was obtained by spraying with 10% H2SO4 in EtOH, followed by heating.
Materials
The stem of Toona sureni was collected from a residential garden in Kuningan, West Java, Indonesia, in September 2019. Plant determination was conducted at Herbarium Jatinangor, Plant Taxonomy/Biosystematics Laboratory, Department of Biology, Universitas Padjadjaran, Indonesia. Endophytic fungi were isolated from the inner tissues of the Toona sureni stem using a surface sterilization method based on a previously reported method (Shiono et al., 2014). Subsequently, the fresh mycelia from the single endophytic fungi strain were cultivated on 5.5 kg of unpolished red rice (25 g/flask x 220) at room temperature for 4 weeks.
Identification of endophytic fungi species
Fungi species were identified by Genetika Science Indonesia using molecular analysis of the internal transcribed region (ITS) of the ribosomal DNA with several steps, namely (1) Genomic DNA extraction with Quick-DNA Fungi/Bacterial Miniprep Kit (Zymo Research, D6005), (2) PCR amplification with MyTaq HS Red Mix (Bioline, BIO-25048), and (3) Bi-directional sequencing. The resulting sequences were compared for similarity to the NCBI database known as Basic Local Alignment Search Tool (BLAST). Based on the comparison of the sequence data with the NCBI database using BLAST, endophytic fungus K2 was identified as Stemphylium sp. 241962 with 100% similarity.
Extraction and isolation
The cultured rice was macerated using ethyl acetate (EtOAc), and the extract was concentrated under a vacuum to yield EtOAc extract (258 g). The concentrated extract was mixed with 500 mL of distilled water and partitioned using n-hexane, followed by EtOAc. The n-hexane extract (101 g) was subjected to vacuum liquid chromatography (VLC) using a gradient elution of n-hexane, EtOAc, and MeOH, which was concentrated separately to yield 10 fractions (A – J) based on TLC profiles. Fraction D (4.87 g) was separated with silica gel column chromatography using n-hexane:EtOAc 10% stepwise to yield 9 sub-fractions (D1 – D9) that were combined according to TLC profiles. Sub-fraction D5 (659 mg) was separated using silica gel column chromatography with n-hexane:EtOAc 5% stepwise (100:0 to 1:1) to yield 12 sub-fractions (D5A – D5L). Subsequently, sub-fraction D5F (101 mg) was separated using silica gel column chromatography with n-hexane:EtOAc (10:1) to yield D5F1 as 2 (8.3 mg) and D5F7 (17 mg), which was further separated using silica gel column chromatography with n-hexane:EtOAc (7:3) to give 1 (4.4 mg). D5I (113 mg) was subjected to separation using column chromatography with n-hexane:EtOAc (9:1) to give 3 (23.2 mg). Fraction G (710 mg) was also subjected to separation using column chromatography with n-hexane: CH2Cl2 10% stepwise to yield 10 subfractions (G1 – G10). This was followed by the separation of subfraction G7 (93 mg) using column chromatography on ODS (200 – 400 mesh) eluted with MeOH:water (7:3) to yield G7E as 4 (5.7 mg).
Heme polymerization inhibitory activity assay
The heme polymerization inhibitory activity test was conducted following the previously reported method (Tjitraresmi et al., 2020). 100 µL of sample was prepared with a series of concentrations of 5.0, 2.5, 1.25, 0.625, and 0.3125 mg/mL diluted in 50 µL of each sample was added to an Eppendorf tube containing 100 µL of 1 mM hematin dissolved in 0.2 M NaOH. Chloroquine diphosphate was prepared as the positive control and DMSO 10% as the negative control. All samples and controls were added to 50 µL of glacial acetic acid (pH 2.6) to start the polymerization reaction and incubated at 37°C for 24 hours. Subsequently, all samples were centrifugated at 8000 rpm for 10 minutes, and the precipitate was separated from the supernatant. The precipitate from each sample was washed using DMSO and centrifugated at 8000 rpm for 10 minutes with four repetitions. The washed precipitate was diluted with 200 µL of 0.1 M NaOH. Each 100 µL of the solution obtained was added to a 96-well microplate, and the absorbance was recorded by a microplate reader at λ 405 nm. Values for heme polymerization inhibitory activity were presented as IC50, or a concentration that can reduce heme polymerization by 50% compared to the negative control. A standard curve of hematin was constructed by making a series of concentrations, namely 500, 250, 125, 62.5, 31.25, 15.625, 7.8125, and 3.9063 mM. 100 µL of each concentration was added to a 96-well microplate, and the absorbance was recorded by a microplate reader at λ 405 nm (Figure 1). The percentage of inhibition was calculated using Equation (1) and the IC50 was determined using the linear equation from each sample. The standard curve of hematin is shown in Figure 1.
% Inhibition= (Control Absorbance - Sample Absorbance) x 100% (1)
Control Absorbance
RESULTS
Isocyathisterol (1). White powder; UV (CHCl3) λmax 275 nm; IR (KBr) vmax 3414, 2920 & 2850, 1651, and 1463 cm-1. 1H-NMR (CDCl3, 500 MHz): δH 6.13 (1H, d, J = 9.5 Hz, H-7), 6.06 (1H, d, J = 9.5 Hz, H-6), 5.70 (1H, s, H-4), 5.16 (1H, dd, J = 8.0, 16 Hz, H-23), 5.12 (1H, dd, J = 8.0, 16 Hz, H-22), 1.31 (3H, s, Me-19), 1.00 (3H, s, Me-18), 0.97 (3H, d, J = 7.0 Hz, Me-21), 0.89 (3H, d, J = 7.0 Hz, Me-28), 0.81 (3H, d, J = 7.0 Hz, Me-26), 0.80 (3H, d, J = 7.0 Hz, Me-27), 13C-NMR (CDCl3, 125 MHz), see Table 1; HR-TOFMS m/z found 411.3263 [M+H]+, (calculated for C28H43O2+, m/z 411.3263).
β-sitosterol (2). White crystalline powder; IR (KBr) vmax 3421, 2937 & 2867, and 1462 cm-1; 1H-NMR (CDCl3, 500 MHz): δH 5.35 (1H, m, H-6), 3.51 (1H, m, H-3), 0.99 (3H, s, Me-18), 0.90 (3H, d, J = 6.0 Hz, Me-21), 0.83 (3H, d, J = 6.0 Hz, Me-26), 0.81 (3H, d, J = 6.0 Hz, Me-27), 0.80 (3H, t, J = 7.2 Hz, Me-29), 0.66 (3H, s, Me-19), 13C-NMR (CDCl3, 125 MHz), see Table 1; HR-TOFMS m/z found 397.4008 [M+H]+, (calculated for C29H49-, m/z 397.4046).
ergosterol-5,8-peroxide (3). White crystalline powder; IR (KBr) vmax 3471, 2955 & 2869, 1458, dan 967 cm-1; 1H-NMR (CDCl3, 500 MHz): δH 6.48 (1H, d, J = 8.5 Hz, H-7), 6.22 (1H, d, J = 8.5 Hz, H-6), 5.20 (1H, dd, J = 8.0, 15.2 Hz, H-23), 5.11 (1H, dd, J = 8.0, 15.2 Hz, H-22), 3.95 (1H, tt, J = 5.0, 10.5 Hz, H-3), 0.97 (3H, d, J = 6.5 Hz, Me-21), 0.89 (3H, d, J = 6.8 Hz, Me-28), 0.86 (3H, s, Me-19), 0.81 (3H, d, J = 6.8 Hz, Me-27), 0.79 (3H, d, J = 6.7 Hz, Me-26), 0.79 (3H, s, Me-18), 13C-NMR (CDCl3, 125 MHz), see Table 1; HR-TOFMS m/z found 451,3184 [M+Na]+, (calculated for C28H44O3Na, m/z 451.3188).
cerevisterol (4). White powder; IR (KBr) vmax 3295, 2955 & 2870, dan 1458 cm-1; 1H-NMR (CDCl3, 500 MHz): δH 5.25 (1H, m, H-7), 5.21 (1H, m, H-23), 5.16 (1H, m, H-22), 4.84 (1H, d, J = 6.5 Hz, H-6), 4.07 (1H, m, H-3), 1.05 (3H, s, Me-19), 1.03 (3H, d, J = 6.6 Hz, Me-21), 0.91 (3H, d, J = 6.8 Hz, Me-28), 0.83 (3H, dd, J = 6.8, 9.3 Hz, Me-27), 0.81 (3H, dd, J = 6.8, 9.3 Hz, Me-26), 0.58 (3H, s, Me-18), 13C-NMR (CDCl3, 125 MHz), see Table 1; HR-TOFMS m/z found 429.3346 [M+Na]+, (calculated for C28H45O3- m/z 429.3346).
Table 1. 13C-NMR data of Compounds 1-4 (125 MHz, in CDCl3).
|
Position Carbon |
Compounds |
|||
|
1 |
2 |
3 |
4 |
|
|
δc |
Δc |
δc |
δc |
|
|
1 |
35.1 |
37.3 |
34.7 |
32.5 |
|
2 |
33.7 |
31.7 |
30.1 |
30.7 |
|
3 |
199.9 |
71.8 |
66.5 |
67.5 |
|
4 |
125.2 |
42.3 |
36.9 |
39.3 |
|
5 |
163.4 |
140.8 |
82.2 |
75.4 |
|
6 |
128.0 |
121.7 |
135.5 |
73.5 |
|
7 |
139.3 |
31.7 |
130.8 |
114.2 |
|
8 |
71.8 |
31.9 |
79.4 |
145.8 |
|
9 |
53.1 |
50.2 |
51.1 |
43.5 |
|
10 |
36.2 |
36.5 |
37.0 |
37.4 |
|
11 |
17.9 |
21.1 |
23.4 |
22.1 |
|
12 |
40.8 |
39.8 |
39.4 |
39.2 |
|
13 |
44.1 |
42.3 |
44.6 |
43.9 |
|
14 |
57.0 |
24.3 |
51.7 |
55.0 |
|
15 |
22.7 |
28.3 |
20.7 |
22.9 |
|
16 |
28.2 |
56.1 |
28.7 |
28.0 |
|
17 |
56.4 |
11.9 |
56.2 |
56.1 |
|
18 |
14.5 |
19.8 |
12.9 |
12.4 |
|
19 |
18.9 |
36.2 |
18.2 |
18.3 |
|
20 |
39.8 |
18.8 |
39.7 |
40.5 |
|
21 |
20.6 |
34.0 |
20.9 |
19.7 |
|
22 |
135.3 |
26.1 |
135.2 |
135.5 |
|
23 |
132.2 |
45.9 |
132.3 |
132.3 |
|
24 |
42.8 |
29.2 |
42.8 |
42.9 |
|
25 |
33.1 |
19.1 |
33.1 |
33.2 |
|
26 |
20.0 |
19.4 |
19.7 |
20.1 |
|
27 |
19.7 |
23.1 |
20.0 |
21.2 |
|
28 |
17.7 |
12.0 |
17.6 |
17.6 |
|
29 |
- |
24.3 |
- |
22.9 |
Table 2. The IC50 values of compound 1 – 4, n-hexane extract, and positive control chloroquine diphosphate according to HPIA assay.
|
Samples |
IC50 (mg/mL) |
|
Isocyathisterol (1) |
7.70 ± 0.11 |
|
β-sitosterol (2) |
9.48 ± 0.09 |
|
Ergosterol-5,8-peroxide (3) |
7.88 ± 0.10 |
|
Cerevisterol (4) |
8.36 ± 0.56 |
|
n-hexane extract |
2.46 ± 0.04 |
|
*Chloroquine diphosphate |
1.59 ± 0.03 |
Note: * Positive control
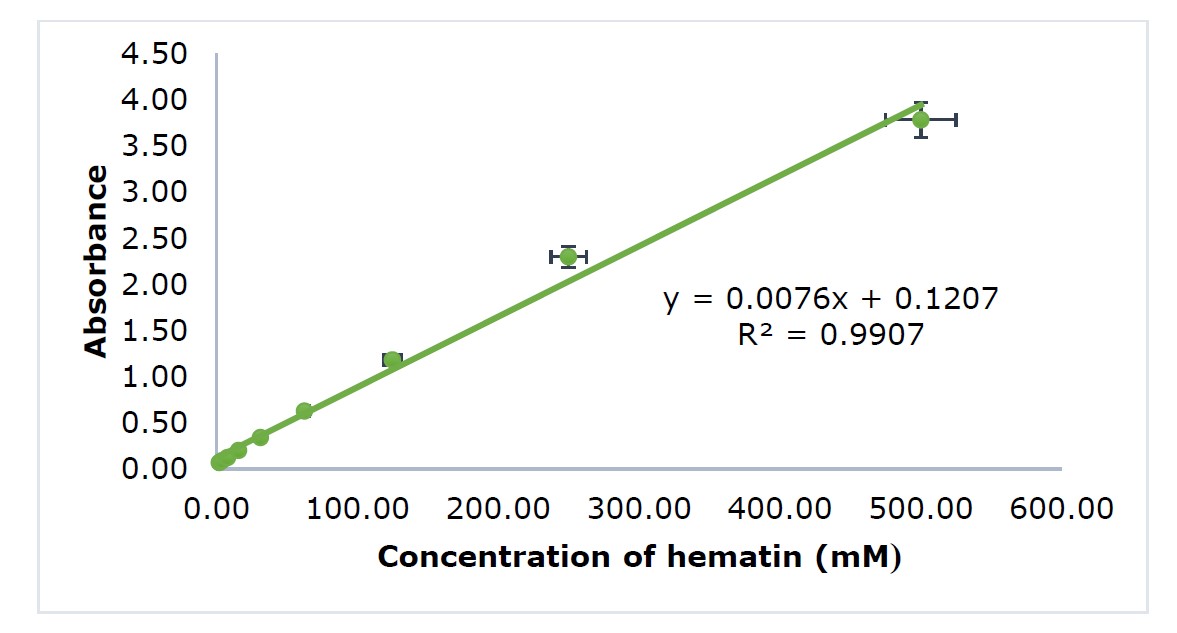
Figure 1. Hematin standard curve.
DISCUSSION
Compound 1 was obtained as a white powder. The molecular formula was identified by HR-ESI-TOFMS measurement using positive-ion-high-resolution as C28H42O2 with the presence of [M+H]+ molecular ion peak at m/z 411.3263 (calculated for C28H43O2+, m/z 411.3263) indicated as eight degrees of unsaturation. The IR absorption bands implied the presence of hydroxyl (3414 cm-1), aliphatic (2920 cm-1 and 2850 cm-1), conjugated carbonyl (1651 cm-1), and alkene (1463 cm-1) groups. The 1H-NMR spectrum exhibited proton resonances related to six methyl signals, including two methyl singlets at δH 1.00 (3H, s) and 1.31 (3H, s) and four methyl doublets at δH 0.80 (3H, d, 7 Hz), 0.81 (3H, d, 7 Hz), 0.89 (3H, d, 7 Hz) and 0.97 (3H, d, 7 Hz). Furthermore, methines and methylene signals accumulated in δH 1.10 – 2.50 ppm, which were indicated as characteristics of steroid groups. There were also five olefinic proton signals assigned as four typical ergosterol olefinic proton with two doublets at δH 6.07 (1H, d, 9.5 Hz) and 6.14 (1H, d, 9.5 Hz), two double doublets at δH 5.10 (1H, dd, 8 Hz, 16 Hz) and 5.20 (1H, dd, 8 Hz, 16 Hz), and one additional singlet olefinic signal at δH 5.70 (1H, s). The 13C NMR and DEPT-135 spectrum analysis revealed 28 signals defined as six methyl, six methylenes, 11 methines, and five quaternary carbons, with one oxygenated quaternary carbon and one typical carbonyl signal. Based on HMQC experiments, compound 1 was confirmed to have an ergostane-type steroid skeleton. Therefore, the eight degrees of unsaturation can be attributed to the presence of three pairs of C sp2, one C carbonyl group, and the remaining tetracyclic ergostane-type steroid.
The carbonyl group position was determined by the HMBC correlation of δH 2.06 (H-1) to 2.41 ppm (H-2) and δH 5.70 ppm (H-4) to δC 199.9 ppm (C-3). The HMBC correlation of δH 6.13 ppm (H-7) with δC 71.8 ppm (C-8) revealed the hydroxyl group was attached to C-8. Additionally, the HMBC and 1H-1H COSY correlations also revealed sp2 carbon positions forming conjugated double bonds from C-4 to C-7 (δC 125.2, 163.4, 128.0, and 139.3 ppm, respectively), as well as the double bond between C-22 (δC 135.3 ppm) and C-23 (δC 132.2 ppm). The 1H-1H COSY and HMBC correlation analysis, as shown in Figure 2, confirmed the identity of compound 1 as 8-hydroxyergosta-4,6,22-trien-3-one. Based on the literature comparison, compound 1 had the same planar structure as cyathisterol and isocyathisterol, the previously reported ergosteroid from Calvatia cyathiformis and Aspergillus ustus, respectively (Kawahara et al., 1994; Liu et al., 2014).

Figure 2. HMBC and 1H-1H COSY correlations of compounds 1.
Based on the difference in NMR chemical shifts around C-8, the isocyathisterol, and cyathisterol were expected to be pairs of isomers in C-9 and/or C-14. The specific optical rotation([α]) of isocyathisterol was +61.3, while that of the cyathisterol was +133 (Liu et al., 2014). Compound 1 was expected to be isocyathisterol according to the similarity between the C-8 chemical shift andwith previously reported NMR data (δC-8 71.8 ppm for isocyathisterol and δC-8 82.0 ppm for cyathisterol) (Kawahara et al., 1994; Liu et al., 2014). The structure of isocyathisterol in Figure 3 was isolated from Stemphylium sp. MAFF 241962 for the first time.

Figure 3. Structures of compounds 1-4
Compound 2 was obtained as a white crystalline powder, and the molecular formula of C29H50O was determined using HR-ESI-TOFMS analysis. The results showed a [M-OH]+ molecular ion peak at m/z 397.4008 (calculated for C29H49- m/z 397.4046), indicating five degrees of unsaturation. The IR spectrum analysis showed similar absorption as 1, but with the absence of carbonyl absorption, indicating the presence of hydroxyl (3421 cm-1), aliphatic (2937 and 2867 cm-1), and alkene groups (1462 cm-1). The 1H NMR spectrum revealed similar methine and methylene signals as 1 accumulated in δH 1.00 – 2.30 ppm and six methyl resonances, indicating the characteristics of steroid group (Jaeger & Aspers, 2012). However, the difference was identified with the presence of one methyl triplet at δH 0.80 (3H, t, 7.2 Hz), which showed the possibility of stigmastane steroid structure. Furthermore, the presence of one multiplet signal from an olefinic proton (δH 3,51, 1H, m) and one signal from oxymethine (δH 5,35, 1H, m) supported the presence of double bond and hydroxyl groups in the structure, respectively. The 13C NMR and DEPT-135 spectra revealed 29 carbon signals ascribed as six methyls, 11 methylenes, nine methines, including one oxymethine and one unsaturated methine, and three quaternary carbons with one unsaturated quaternary carbon. The presence of one pair of unsaturated carbons in 13C NMR supported by IR absorption indicated one double bond group corresponding to one degree of unsaturation, leaving the remaining four degrees of unsaturation related to tetracyclic structure as a typical steroid group characteristic. Compound 2 showed spectral data that was similar to the known phytosterol, β-sitosterol, isolated from Rubus suavissimus S. Lee by Chaturvedula & Prakash (2012). The phytosterols were originally biosynthesized from plants, although their occurrence in fungi was found to be relatively unusual, especially in endophytic fungi (Carvalho et al., 2016; Jiang et al., 2020). This occurred due to the ability of plant-associated endophytic fungi to produce the same class of compounds known as horizontal gene transfer (HGT), which played an important role in the evolution and adaptation of microorganisms (Tiwari & Bae, 2020). Based on these results, further investigation is recommended to understand HGT signatures and their potential effects on related organisms due to the limited research on gene transfer between plants and endophytes. Therefore, this is the first report of β-sitosterol isolated from Stemphylium sp. MAFF 241962.
Compound 3 was isolated as a white crystalline powder with a molecular formula of C28H44O3 corresponding to HR-ESI-TOFMS analysis with a [M+Na]+ molecular ion peak at m/z 451,3184 (calculated for C28H44O3Na m/z 451.3188), indicating seven degrees of unsaturation. The IR spectra exhibited similar functional groups as 2, with an additional absorption of C-O-O stretching at 967 cm-1 as a typical peroxide group. The 1H NMR spectral data showed similarities to 1 with six methyl signals and four typical olefinic signals for ergosterol derivatives, but with the absence of one additional olefinic proton observed in 1. Although the same total of 28 carbons as in 1 was observed in 13C NMR and DEPT-135 spectral data, the differences were also identified with the absence of carbonyl from 1 and the appearance of two oxygenated quaternary carbons, indicating the presence of a peroxide functional group, and one oxymethine suggested to be the attached hydroxyl group. Based on the analysis, the presence of two pairs of C sp2 was responsible for two degrees of unsaturation. The peroxide group identified in the spectral data was also suggested to form one cyclic with one degree of unsaturation, resulting in a total of four degrees of unsaturation corresponding to tetracyclic skeletal ergosterol derivatives. A comparison of compound 3 spectral data with those of isolated compounds from Eunicella cavolini and Trididemnum inarmatum by Ioannou et al. (2009) revealed a similar structure of compound 3 as ergosterol-5,8-peroxide in Figure 3, which was isolated for the first time from Stemphylium sp. MAFF 241962.
Compound 4 was obtained as a white powder with a molecular formula of C28H46O3 according to HR-ESI-TOFMS experiments of molecular ion peak at m/z 429.3346 [M-H]+ (calculated C28H45O3- m/z 429.3346), which indicated six degrees of unsaturation. The IR spectrum of 4 revealed a similar absorption as that of 2, originating from the presence of hydroxyl, aliphatic, and alkene groups. The NMR spectrum of 4 showed the typical ergosterol derivatives with a typical proton and a total of 28 carbon signals, as shown in 1 and 3 NMR data. However, the differences were observed as the presence of two oxygenated methine signals at δH 4.07 (1H, m) and 4.84 (1H, d, 6.5 Hz) as well as one oxygenated quaternary carbon from 13C NMR and DEPT-135. This was suggested to be attached to hydroxyl groups as described in IR absorption and the molecular formula. Therefore, the six degrees of unsaturation were defined as two pairs of C sp2 responsible for two degrees of unsaturation and a tetracyclic skeletal ergosterol structure responsible for the remaining four degrees of unsaturation. The chemical shifts of 4 were further compared with the isolated compound from Cladosporium sp. CYC38 by Jiang et al. (2018). Based on the results, compound 4 was identified as ergosta-7,22-diene-3,5,6-triol or cerevisterol (Figure 3), which was first isolated in Stemphylium sp. MAFF 241962.
Compounds 1 – 4 and the n-hexane extract were tested for their antimalarial activity using a simple colorimetric in vitro assay, namely HPIA. Based on their chemical structures, the carbonyl, hydroxyl, and methyl groups were suggested to exhibit good antimalarial activity in the HPIA assay. This heme polymerization inhibition assay mimics the degradation of hemoglobin into globin and free heme, which occurs in the food vacuole of plasmodium when it infects human erythrocytes. During this process, the globin component will be degraded into amino acids, which are valuable for protein synthesis in plasmodium. Meanwhile, free heme is a toxic substance because it can form oxygen radical species that have the potential to kill plasmodium. For protection, plasmodium detoxifies the free heme through the polymerization reaction to convert the free heme into hemozoin, an insoluble substance that can be excreted through the secretion system (Fitriastuti et al., 2017). This method inhibits this reaction using a polymer analog to hemozoin, namely β-hematin.
Polymerization was conducted in incubation at 37°C for 24 hours, which was the optimum condition for hematin to crystallize. Hematin was used as a substrate in the polymerization reaction, with the isoelectric point at pH 5, similar to the pH in the plasmodium food vacuole. To start polymerization, glacial acetic acid was used as an acidity regulator in the reaction (Fitriastuti et al., 2017). After the incubation, all samples were centrifuged to separate the precipitate from the supernatant. The precipitate was washed four times using DMSO 10% to remove the unreacted hematin entrapped in the β-hematin precipitate. Subsequently, the amount of β-hematin polymer formed was measured with colorimetric quantification using a microplate reader in absorption at λ 405 nm, which correlated contrary to the inhibition activity of heme polymerization by antimalarial compounds. The result of the hematin standard curve measurement is shown in Figure 1, with a coefficient of determination (R2) value of 0.9907.
The IC50 values of the compounds, n-hexane extract, and negative and positive controls are shown in Table 2. According to the results, the IC50 values for compounds 1–4, n-hexane extract, and chloroquine phosphate were 7.70 ± 0.11, 9.48 ± 0.09, 7.88 ± 0.10, 8.36 ± 0.56, 2.46 ± 0.04, and 1.59 ± 0.03 mg/mL, respectively. These results indicated that all the isolated compounds and the extract were less active in inhibiting β-hematin crystal formation than the positive control, chloroquine diphosphate. However, the n-hexane extract had greater activity than the isolated compounds. The IC50 values of the compounds varied according to the difference in functional groups, where compound 4 had greater activity than compound 2, according to the number of hydroxyl groups. Based on previous research (Fitriastuti et al., 2017; Ignatushchenko et al., 1997), the proposed interaction between the β-hematin and 1 was described in Figure 4, which displayed significant interactions between the carbonyl oxygen and heme iron as well as the carboxylate side-groups of heme and the hydroxyl group of 1.

Figure 4. Proposed interaction between β-hematin and compound 1 (Ignatushchenko et al., 1997; Fitriastuti et al., 2017).
CONCLUSION
Isocyathisterol (1), β-sitosterol (2), ergosterol-5,8-peroxide (3), and cerevisterol (4) have been isolated from Stemphylium sp. MAFF 241962, the endophytic fungus of T. sureni. The finding of phytosterol, β-sitosterol (2), might indicate a significant role of HGT between endophytic fungi and the host plant, but further investigation is still needed. The heme polymerization inhibition activity of compounds 1-4 showed moderate activity, with IC50 values of 7.70 ± 0.11, 9.48 ± 0.09, 7.88 ± 0.10, and 8.36 ± 0.56 mg/mL, respectively, compared to the positive control, chloroquine diphosphate, with IC50 value of 1.59 ± 0.03 mg/mL. This result provides new leads about the antimalarial properties of compounds 1-4. To optimize the compounds’ potential as antimalarial agents, additional antimalarial activity assay, such as in vitro assays against Plasmodium falciparum, need to be performed.
ACKNOWLEDGMENTS
The authors are grateful to Sofa Fajriah at the Research Center for Chemistry, National Innovative and Research Council, Indonesia for NMR measurements.
AUTHOR CONTRIBUTIONS
Risyandi Anwar, Galih Bayu Pratama, Sofa Fajriah, and Unang Supratman assisted in conducting the experiments, performed the spectral analysis, and wrote the manuscript. Risyandi Anwar, Galih Bayu Pratama. Desi Harneti, Azmi Azhari, and Yoshihito Shiono designed and conducted all experiments, as well as wrote the manuscript. All authors have read and approved the final manuscript.
CONFLICT OF INTEREST
The authors declare that there are no competing interests.
REFERENCES
Aly, A.H., Debbab, A., Edrada-Ebel, R.A., Müller, W.E.G., Kubbutat, M.H.G., Wray, V., Ebel, R., and Proksch, P. 2010. Protein kinase inhibitors and other cytotoxic metabolites from the fungal endophyte Stemphylium botryosum isolated from Chenopodium album. Mycosphere. 1: 153–162.
Azhari, A., Naini, A.A., Harneti, D., Wulandari, A.P., Mulyani, Y., Purbaya, S., Sari, A.P., Pratama, G.B., Anwar, R., Fajar, M., Abdullah, F.F., Farabi, K and Supratman, U. 2023. New steroid produced by Periconia pseudobyssoides K5 isolated from Toona sureni (Meliaceae) and its heme polymerization inhibition activity. Journal of Asian Natural Products Research, 1: 1-7.
Carvalho, J.M., da Paixão, L.K.O., Dolabela, M.F., Marinho, P.S.B., and Marinho, A.M.D.R. 2016. Phytosterols isolated from endophytic fungus Colletotrichum gloeosporioides (Melanconiaceae). Acta Amazonica. 46(1): 69–72.
Chen, H.M., Wu, Y.C., Chia, Y.C., Chang, F.R., Hsu, H.K., Hsieh, Y.C., Chen, C.C., and Yuan, S.S. 2009. Gallic acid, a major component of Toona sinensis leaf extracts, contains a ROS-mediated anti-cancer activity in human prostate cancer cells. Cancer Letters. 286(2): 161–171.
Chini, M.G., Malafronte, N., Vaccaro, M.C., Gualtieri, M.J., Vassallo, A., Vasaturo, M., Castellano, S., Milite, C., Leone, A., Bifulco, G., De Tommasi, N., and Dal Piaz, F. 2016. Identification of limonol derivatives as heat shock protein 90 (Hsp90) inhibitors through a multidisciplinary approach. Chemistry - A European Journal. 22(37): 13236–13250.
Cuong, P. Van, Minh, N.T., and Hung, N. Van 2007 Triterpenes from Toona sureni Moora (Meliacea). Journal of Chemistry. 45: 214–219.
Deshmukh, S.K., Gupta, M.K., Prakash, V., and Saxena, S. 2018 Endophytic fungi: A source of potential antifungal compounds. Journal of Fungi. 4(3): 7.
Ekaprasada, M.T., Nurdin, H., Ibrahim, S., and Dachriyanus 2015. Antibacterial activity of methyl gallate isolated from the leaves of Toona sureni. International Journal on Advanced Science, Engineering and Information Technology. 5(4): 280–282.
Fitriastuti, D., Jumina, and Priatmoko 2017. Heme polymerization inhibition activity (HPIA) assay of synthesized xanthone derivative as antimalarial compound. AIP Conference Proceedings. 1823.
Ibrahim, S., Alhaidari, R., Zayed, M.F., and Arabia, S. 2018. Potential anti-malarial agents from endophytic fungi: A review. Mini-Reviews in Medicinal Chemistry. 18: 1110–1132.
Ignatushchenko, M. V., Winter, R.W., Bächinger, H.P., Hinrichs, D.J., and Riscoe, M.K. 1997. Xanthones as antimalarial agents; Studies of a possible mode of action. FEBS Letters. 409(1): 67–73.
Ioannou, E., Abdel-Razik, A.F., Zervou, M., Christofidis, D., Alexi, X., Vagias, C., Alexis, M.N., & Roussis, V. (2009) 5α,8α-epidioxysterols from the gorgonian Eunicella cavolini and the ascidian Trididemnum inarmatum: Isolation and evaluation of their antiproliferative activity. Steroids. 74(1): 73–80.
Jaeger, M. and Aspers, R.L.E.G. 2012. Steroids and NMR. In Annual Report on NMR Spectroscopy. Elsevier, pp. 115–258.
Jiang, Q., Wei, N., Huo, Y., Kang, X., Chen, G., and Wen, L. 2020. Secondary metabolites of the endophytic fungus Cladosporium sp. CYC38. Chemistry of Natural Compounds. 56(6): 1166–1169.
Kawahara, N., Sekita, S., and Satake, M. 1994. Steroids from Calvatia cyathiformis. Phytochemistry. 37(1): 213–215.
Li, J., Zhao, G.Z., Varma, A., Qin, S., Xiong, Z., Huang, H.Y., Zhu, W.Y., Zhao, L.X., Xu, L.H., Zhang, S., and Li, W.J. 2012. An endophytic Pseudonocardia species induces the production of artemisinin in Artemisia annua. PLoS One. 7(12): e51410.
Li, J., Zheng, Y.B., Kurtán, T., Liu, M.X., Tang, H., Zhuang, C.L., and Zhang, W. 2020. Anthraquinone derivatives from a coral associated fungus Stemphylium lycopersici. Natural Product Research. 34(15): 2116-2123.
Liu, X.H., Miao, F.P., Liang, X.R., and Ji, N.Y. 2014. Ergosteroid derivatives from an algicolous strain of Aspergillus ustus. Natural Product Research. 28(15): 1182–1186.
Maehara, S., Simanjuntak, P., Ohashi, K., and Shibuya, H. 2010. Composition of endophytic fungi living in Cinchona ledgeriana (Rubiaceae). Journal of Natural Medicines. 64(2): 227–230.
Mirjalili, M.H., Farzaneh, M., Bonfill, M., Rezadoost, H., and Ghassempour, A. 2012. Isolation and characterization of Stemphylium sedicola SBU-16 as a new endophytic taxol-producing fungus from Taxus baccata grown in Iran. FEMS Microbiology Letters. 328: 122–129.
Moussa, M., Ebrahim, W., El-Neketi, M., Mándi, A., Kurtán, T., Hartmann, R., Lin, W., Liu, Z., and Proksch, P. 2016. Tetrahydroanthraquinone derivatives from the mangrove-derived endophytic fungus Stemphylium globuliferum. Tetrahedron Letters. 57(36): 4074–4078.
Ouattara, L.P., Sanon, S., Mahiou-Leddet, V., Gansané, A., Baghdikian, B., Traoré, A., Nébié, I., Traoré, A.S., Azas, N., Ollivier, E., & Sirima, S.B. (2014) In vitro antiplasmodial activity of some medicinal plants of Burkina Faso. Parasitology Research. 113(1): 405–416.
Rana, K.L., Kour, D., Kaur, T., Devi, R., Negi, C., Yadav, A.N., Yadav, N., Singh, K., and Saxena, A.K. 2020. Endophytic fungi from medicinal plants: Biodiversity and biotechnological applications. Microbial Endophytes. 11: 273-305
Shiono, Y., Sasaki, T., Shibuya, F., Yasuda, Y., Koseki, T., & Supratman, U. 2013. Isolation of a phomoxanthone a derivative, a new metabolite of tetrahydroxanthone, from a Phomopsis sp. Isolated from the mangrove, Rhizhopora mucronata. Natural Product Communications. 8(12): 1735–1737.
Shiono, Y., Shibuya, F., Koseki, T., Harizon, Supratman, U., Uesugi, S., and Kimura, K.I. 2014. A new α-pyrone metabolite from a mangrove plant endophytic fungus, Fusarium sp. Journal of Asian Natural Products Research. 17(4): 403–408.
Stricker, S.M., Gossen, B.D., and McDonald, M.R. 2021. Risk assessment of secondary metabolites praoduced by fungi in the genus Stemphylium. Canadian Journal of Microbiology. 67: 445–450.
Supratman, U., Suzuki, T., Nakamura, T., Yokoyama, Y., Harneti, D., Maharani, R., Salam, S., Abdullah, F.F., Koseki, T., and Shiono, Y. 2021a. New metabolites produced by endophyte Clonostachys rosea B5 − 2. Natural Product Research. 35(9): 1525–1531.
Supratman, U., Hirai, N., Sato, S., Watanabe, K., Malik, A., Annas, S., Harneti, D., Maharani, R., Koseki, T., and Shiono, Y. 2021b. New naphthoquinone derivatives from Fusarium napiforme of a mangrove plant. Natural Product Research. 35(9): 1406–1412.
Suzuki, T., Ariefta, N.R., Koseki, T., Furuno, H., Kwon, E., Momma, H., Harneti, D., Maharani, R., Supratman, U.,Kimura, K., and Shiono, Y. 2019 New polyketides, paralactonic acids A–E produced by Paraconiothyrium sp. SW-B-1, an endophytic fungus associated with a seaweed, Chondrus ocellatus Holmes. Fitoterapia. 132: 75-81.
Tiwari, P. and Bae, H. 2020. Horizontal gene transfer and endophytes: An implication for the acquisition of novel traits. Plants. 9(3): 305.
Tjitraresmi, A., Moektiwardoyo, M., and Susilawati, Y. 2020. Inhibition of heme polymerization invitro assay of extract of sirih leaf (Piper betle linn.) and sun flower leaves (Helianthus annuus L.). Indonesian Journal of Pharmaceutical Science and Technology. 7(1): 22.
Uzma, F., Mohan, C.D., Hashem, A., Konappa, N.M., Rangappa, S., Kamath, P. V., Singh, B.P., Mudili, V., Gupta, V.K., Siddaiah, C.N., Chowdappa, S., Alqarawi, A.A., and Abd-Allah, E.F. 2018. Endophytic fungi-alternative sources of cytotoxic compounds: A review. Frontiers in Pharmacology. 9(APR): 1–37.
World Health Organization 2021. World Malaria report 2021. WHO Press Geneva. 22–24. https://www.who.int/teams/global-malaria-programme/reports/world-malaria-report-2021
Zhou, X.M., Zheng, C.J., Chen, G.Y., Song, X.P., Han, C.R., Li, G.N., Fu, Y.H., Chen, W.H., and Niu, Z.G. 2014. Bioactive anthraquinone derivatives from the mangrove-derived fungus Stemphylium sp. 33231. Journal of Natural Products. 77(9): 2021–2028.
OPEN access freely available online
Natural and Life Sciences Communications
Chiang Mai University, Thailand. https://cmuj.cmu.ac.th
Supplementary Data
Fungal Species Identification
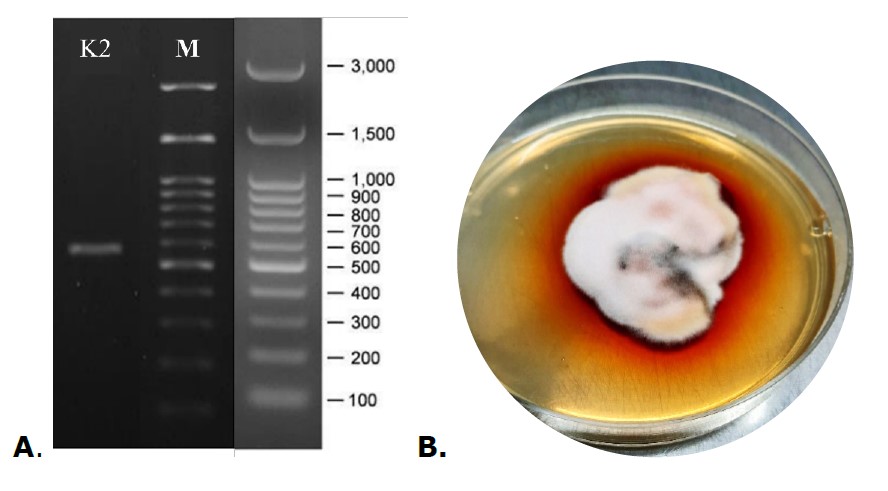
Figure S1. (A) The Gel Photo – PCR Product of Endophytic Fungal K2; (B) The Physical Appearance of Endophytic Fungal K2 in PDA
Table S1. The Sequence Assembly Result – PCR Product of Endophytic Fungal K2
|
Endophytic Fungal K2 Sequence Assembly (570bp) |
|||||
|
1 |
TGAACCTGCG |
GAGGGATCAT |
TACACAATAT |
GAAAGCGGGT |
TGGGACCTCA |
|
51 |
CCTCGGTGAG |
GGCTCCAGCT |
TGTCTGAATT |
ATTCACCCAT |
GTCTTTTGCG |
|
101 |
CACTTCTTGT |
TTCCTGGGCG |
GGTTCGCCCG |
CCACCAGGAC |
CAAACCATAA |
|
151 |
ACCTTTTTGT |
AATTGCAATC |
AGCGTCAGTA |
AACAATGTAA |
TTATTACAAC |
|
201 |
TTTCAACAAC |
GGATCTCTTG |
GTTCTGGCAT |
CGATGAAGAA |
CGCAGCGAAA |
|
251 |
TGCGATACGT |
AGTGTGAATT |
GCAGAATTCA |
GTGAATCATC |
GAATCTTTGA |
|
301 |
ACGCACATTG |
CGCCCTTTGG |
TATTCCAAAG |
GGCATGCCTG |
TTCGAGCGTC |
|
351 |
ATTTGTACCC |
TCAAGCTTTG |
CTTGGTGTTG |
GGCGTCTTTG |
TCTCTCACGA |
|
401 |
GACTCGCCTT |
AAAATGATTG |
GCAGCCGACC |
TACTGGTTTC |
GGAGCGCAGC |
|
451 |
ACAATTCTTG |
CACTTTGAAT |
CAGCCTTGGT |
TGAGCATCCA |
TCAAGACCAC |
|
501 |
ATTTTCTTAA |
CTTTTGACCT |
CGGATCAGGT |
AGGGATACCC |
GCTGAACTTA |
|
551 |
AGCATATCAA |
TAAGCGGAGG |
|
|
|
NMR Data Compound 1 – 4
Table S2 NMR Data of Compound 1 compared with isocyathisterol (Liu et al., 2014)
|
Position |
Compound 1 * |
isocyathisterol * |
||
|
13C NMR δC |
1H NMR δH (ΣH, m, J = Hz) |
13C NMR δC |
1H NMR δH (ΣH, m, J = Hz) |
|
|
1 |
35.1 |
2.06 (1H, m); 2.12 (1H, m) |
35.1 |
1.70 (1H, m); 2.11 (1H, m) |
|
2 |
33.7 |
2.41 (1H, m); 2.45 (1H, m) |
33.7 |
2.44 (1H, brdd, 18.2, 5.1) 2.61 (1H, ddd, 18.2, 5.5) |
|
3 |
199.9 |
- |
199.7 |
- |
|
4 |
125.2 |
5.70 (1H, s) |
125.2 |
5.72 (1H, s) |
|
5 |
163.4 |
- |
163.3 |
- |
|
6 |
128.0 |
6.06 (1H, d, 9.8) |
128.0 |
6.09 (1H, d, 9.8) |
|
7 |
139.3 |
6.13 (1H, d, 9.8) |
139.3 |
6.16 (1H, d, 9.8) |
|
8 |
71.8 |
- |
71.8 |
- |
|
9 |
53.1 |
1.47 (1H, m) |
53.1 |
1.44 (1H, dd, 12.9, 2.8) |
|
10 |
36.2 |
- |
36.2 |
- |
|
11 |
17.9 |
1.24 (2H, m) |
17.8 |
1.88 (1H, dddd, 13.0, 13.0, 3.0) |
|
12 |
40.8 |
1.28 (1H, m) 2.09 (1H, m) |
40.8 |
1.28 (1H, m); 2.09 (1H, m) |
|
13 |
44.1 |
- |
44.1 |
- |
|
14 |
57.0 |
1.39 (1H, m) |
57.0 |
1.39 (1H, dd, 13.1, 6.9) |
|
15 |
22.7 |
1.48 (1H, m); 1.61 (1H, m) |
22.3 |
1.49 (1H, m); 1.63 (1H, m) |
|
16 |
28.2 |
1.23 (1H, m); 1.70 (1H, m) |
28.1 |
1.32 (1H, m); 1.73 (1H, m) |
|
17 |
56.4 |
1.11 (1H, m) |
56.5 |
1.12 (1H, dd, 9.6, 9.6, 9.6) |
|
18 |
14.5 |
1.00 (3H, s) |
14.4 |
1.02 (3H, s) |
|
19 |
18.9 |
1.31 (3H, s) |
18.9 |
1.33 (3H, s) |
|
20 |
39.8 |
2.33 (1H, m) |
39.7 |
2.03 (1H, m) |
|
21 |
20.6 |
0.97 (3H, d, 6.5) |
20.6 |
0.99 (3H, d, 6.6) |
|
22 |
135.3 |
5.12 (1H, dd, 15.2, 8.2) |
135.3 |
5.13 (1H, dd, 15.3, 8.4) |
|
23 |
132.2 |
5.16 (1H, dd, 15.2, 8.2) |
132.2 |
5.22 (1H, dd, 15.3, 7.7) |
|
24 |
42.8 |
1.82 (1H, m) |
42.8 |
1.85 (1H, m) |
|
25 |
33.1 |
1.25 (1H, m) |
33.1 |
1.46 (1H, m) |
|
26 |
20.0 |
0.80 (3H, d, 6.7) |
20.0 |
0.82 (3H, dd, 9.3, 6.8) |
|
27 |
19.7 |
0.80 (3H, d, 6.8) |
19.6 |
0.84 (3H, d, 6.8) |
|
28 |
17.7 |
0.89 (3H, d, 6.8) |
17.6 |
0.91 (3H, d, 6.8) |
Table S3. NMR Data of Compound 2 compared with β-sitosterol (Chaturvedula & Prakash, 2012)
|
Position |
Compound 2 * |
β-sitosterol ** |
||
|
13C NMR δC |
1H NMR δH (ΣH, m, J = Hz) |
13C NMR δC |
1H NMR δH (ΣH, m, J = Hz) |
|
|
1 |
37.3 |
|
37.5 |
|
|
2 |
31.7 |
|
31.9 |
|
|
3 |
71.8 |
3.51 (1H, m) |
72.0 |
3.53 (1H, tdd, 4.5, 4.2, 3.8) |
|
4 |
42.3 |
|
42.5 |
|
|
5 |
140.8 |
|
140.9 |
|
|
6 |
121.7 |
5.35 (1H, m) |
121.9 |
5.36 (1H, t, 6.4) |
|
7 |
31.7 |
|
32.1 |
|
|
8 |
31.9 |
|
32.1 |
|
|
9 |
50.2 |
|
50.3 |
|
|
10 |
36.5 |
|
36.7 |
|
|
11 |
21.1 |
|
21.3 |
|
|
12 |
39.8 |
|
39.9 |
|
|
13 |
42.3 |
|
42.6 |
|
|
14 |
56.8 |
|
56.9 |
|
|
15 |
24.3 |
|
26.3 |
|
|
16 |
28.3 |
|
28.5 |
|
|
17 |
56.1 |
|
56.3 |
|
|
18 |
11.9 |
0.99 (3H, s) |
12.0 |
0.99 (3H, s) |
|
19 |
19.8 |
0.66 (3H, s) |
19.0 |
0.68 (3H, s) |
|
20 |
36.2 |
|
36.3 |
|
|
21 |
18.8 |
0.90 (3H, d, 6.0) |
19.2 |
0.93 (3H, d, 6.5) |
|
22 |
34.0 |
|
34.2 |
|
|
23 |
26.1 |
|
26.3 |
|
|
24 |
45.9 |
|
46.1 |
|
|
25 |
29.2 |
|
29.4 |
|
|
26 |
19.1 |
0.83 (3H, d, 4.0) |
19.0 |
0.83 (3H, d, 6.4) |
|
27 |
19.4 |
0.81 (3H, d, 6.0) |
19.6 |
0.81 (3H, d, 6.4) |
|
28 |
23.1 |
|
23.3 |
|
|
29 |
12.0 |
0.80 (3H, t, 7.2) |
12.0 |
0.84 (3H, t, 7.2) |
Note: *CDCl3, 1H NMR 500 MHz, 13C NMR 125 MHz; **CDCl3, 1H NMR 600 MHz, 13C NMR 150 MHz
Table S4. NMR Data of Compound 3 compared with ergosterol-5,8-peroxide (Ioannou et al., 2009).
|
Position |
Compound 3 * |
ergosterol -5,8-peroxide** |
||
|
13C NMR δC |
1H NMR δH (ΣH, m, J = Hz) |
13C NMR δC |
1H NMR δH (ΣH, m, J = Hz) |
|
|
1 |
34.7 |
1.92 (1H, m); 1.68 (1H, m) |
34.7 |
1.93 (1H, m); 1.67 (1H, m) |
|
2 |
30.1 |
1.82 (1H, m); 1.52 (1H, m) |
30.7 |
1.82 (1H, m); 1.52 (1H, m) |
|
3 |
66.5 |
3.95 (1H, tt, 10.5, 5.0) |
66.5 |
3.95 (1H, tt, 11.3, 5.0) |
|
4 |
36.9 |
2.10 (1H, m); 1.89 (1H, m) |
36.9 |
2.10 (1H, m); 1.89 (1H, m) |
|
5 |
82.2 |
- |
82.2 |
- |
|
6 |
135.5 |
6.22 (1H, d, 8.5) |
135.5 |
6.22 (1H, d, 8.5) |
|
7 |
130.8 |
6.48 (1H, d, 8.5) |
130.7 |
6.48 (1H, d, 8.5) |
|
8 |
79.4 |
- |
79.4 |
- |
|
9 |
51.1 |
1.47 (1H, m) |
51.1 |
1.48 (1H, m) |
|
10 |
37.0 |
- |
36.9 |
- |
|
11 |
23.4 |
1.49 (1H, m); 1.20 (1H, m) |
23.4 |
1.50 (1H, m); 1.20 (1H, m) |
|
12 |
39.4 |
1.94 (1H, m); 1.22 (1H, m) |
39.3 |
1.94 (1H, m); 1.22 (1H, m) |
|
13 |
44.6 |
- |
44.5 |
- |
|
14 |
51.7 |
1.55 (1H, m) |
51.7 |
1.54 (1H, m); |
|
15 |
20.7 |
1.58 (1H, m); 1.38 (1H, m) |
20.7 |
1.58 (1H, m); 1.38 (1H, m) |
|
16 |
28.7 |
1.75 (1H, m); 1.34 (1H, m) |
28.9 |
1.75 (1H, m); 1.34 (1H, m) |
|
17 |
56.2 |
1.18 (1H, m) |
56.1 |
1.19 (1H, m) |
|
18 |
12.9 |
0.79 (3H, s) |
12.8 |
0.79 (3H, s) |
|
19 |
18.2 |
0.86 (3H, s) |
18.2 |
0.86 (3H, s) |
|
20 |
39.7 |
2.00 (1H, m) |
39.8 |
1.99 (1H, m) |
|
21 |
20.9 |
0.97 (3H, d, 6.5) |
20.9 |
0.97 (3H, d, 6.6) |
|
22 |
135.2 |
5.11 (1H, dd, 15.2, 8.2) |
135.4 |
5.10 (1H, dd, 15.2, 8.2) |
|
23 |
132.3 |
5.20 (1H, dd, 15.2, 8.2) |
132.4 |
5.17 (1H, dd, 15.2, 8.0) |
|
24 |
42.8 |
1.80 (1H, m) |
43.0 |
1.81 (1H, m) |
|
25 |
33.1 |
1.46 (1H, m) |
33.2 |
1.44 (1H, m) |
|
26 |
19.7 |
0.79 (3H, d, 6.7) |
19.6 |
0.79 (3H, d, 6.7) |
|
27 |
20.0 |
0.81 (3H, d, 6.8) |
20.1 |
0.81 (3H, d, 6.8) |
|
28 |
17.6 |
0.89 (3H, d, 6.8) |
18.0 |
0.89 (3H, d, 6.8) |
Table S5. NMR Data of Compound 4 compared with cerevisterol (Jiang et al., 2018)
|
Position |
Compound 4 * |
cerevisterol ** |
||
|
13C NMR δC |
1H NMR δH (ΣH, m, J = Hz) |
13C NMR δC |
1H NMR δH (ΣH, m, J = Hz) |
|
|
1 |
32.5 |
|
32.9 |
|
|
2 |
30.7 |
|
30.8 |
|
|
3 |
67.5 |
4.07 (1H, m) |
67.7 |
4.06 (1H, m) |
|
4 |
39.3 |
|
39.2 |
|
|
5 |
75.4 |
|
75.9 |
|
|
6 |
73.5 |
4.84 (1H, d, 6.5) |
73.6 |
3.60 (1H, m) |
|
7 |
114.2 |
5.25 (1H, m) |
117.5 |
5.36 (1H, m) |
|
8 |
145.8 |
|
144.0 |
|
|
9 |
43.5 |
|
43.4 |
|
|
10 |
37.4 |
|
37.1 |
|
|
11 |
22.1 |
|
22.0 |
|
|
12 |
39.2 |
|
39.2 |
|
|
13 |
43.9 |
|
43.7 |
|
|
14 |
55.0 |
|
54.7 |
|
|
15 |
22.9 |
|
22.9 |
|
|
16 |
28.0 |
|
27.9 |
|
|
17 |
56.1 |
|
56.0 |
|
|
18 |
12.4 |
0.58 (3H, s) |
12.3 |
0.58 (3H, s) |
|
19 |
18.3 |
1.05 (3H, s) |
18.8 |
1.07 (3H, s) |
|
20 |
40.5 |
|
40.4 |
|
|
21 |
19.7 |
1.02 (3H, d, 6.7) |
19.6 |
1.00 (3H, d, 6.6) |
|
22 |
135.5 |
5.16 (1H, m) |
135.4 |
5.16 (1H, dd, 7.2, 15) |
|
23 |
132.3 |
5.21 (1H, m) |
132.2 |
5.20 (1H, dd, 7.2, 15) |
|
24 |
42.9 |
|
42.8 |
|
|
25 |
33.2 |
|
33.1 |
|
|
26 |
20.1 |
0.81 (3H, dd, 9.3; 6.8) |
19.9 |
0.80 (3H, d, 6.6) |
|
27 |
21.2 |
0.83 (3H, dd, 9.3; 6.8) |
21.1 |
0.82 (3H, d, 6.6) |
|
28 |
17.6 |
0.91 (3H, d, 6.8) |
17.6 |
0.90 (3H, d, 7.2) |
Note: *CDCl3, 1H NMR 500 MHz, 13C NMR 125 MHz; **CDCl3, 1H NMR 600 MHz, 13C NMR 150 MHz
Compound 1 Structure Elucidation
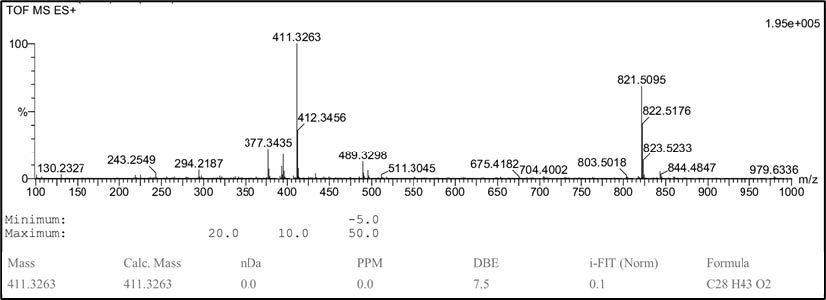
Figure S2. HR-TOFMS spectrum of compound 1.
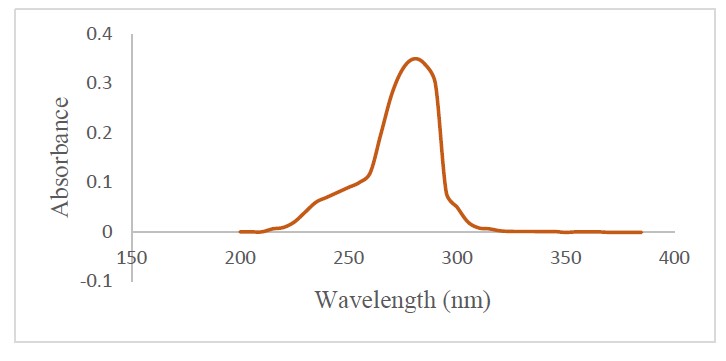
Figure S3. UV spectrum of compound 1
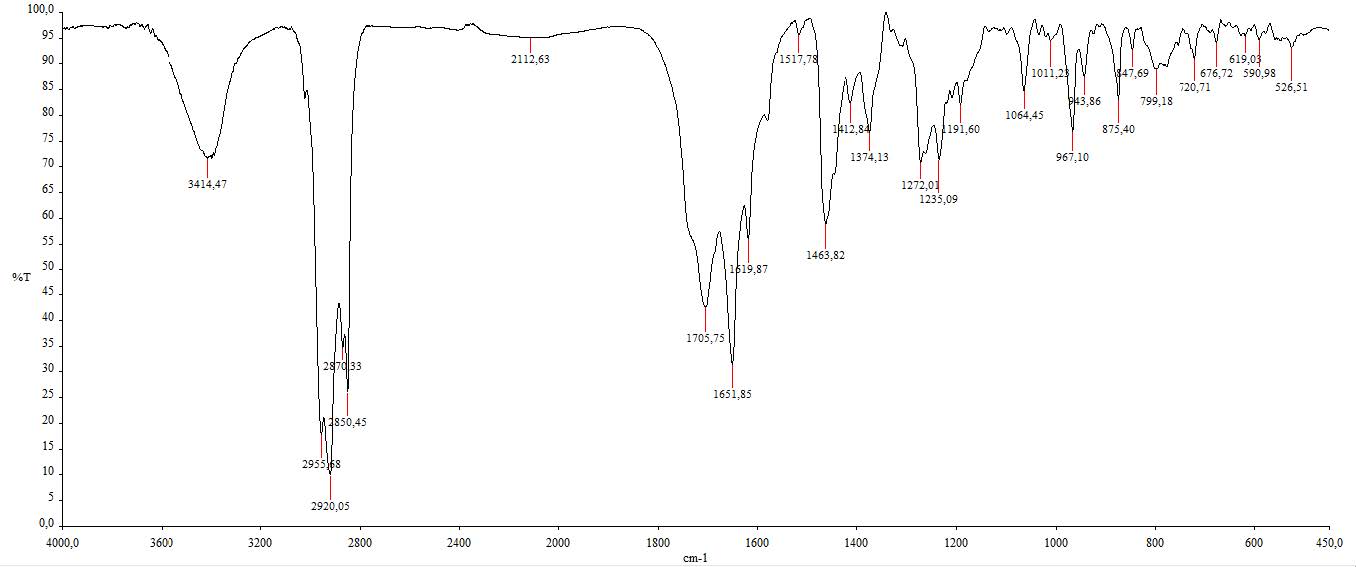
Figure S4. IR spectrum of compound 1.

Figure S5. 1H-NMR spectrum of compound 1 (500 MHz, CDCl3).
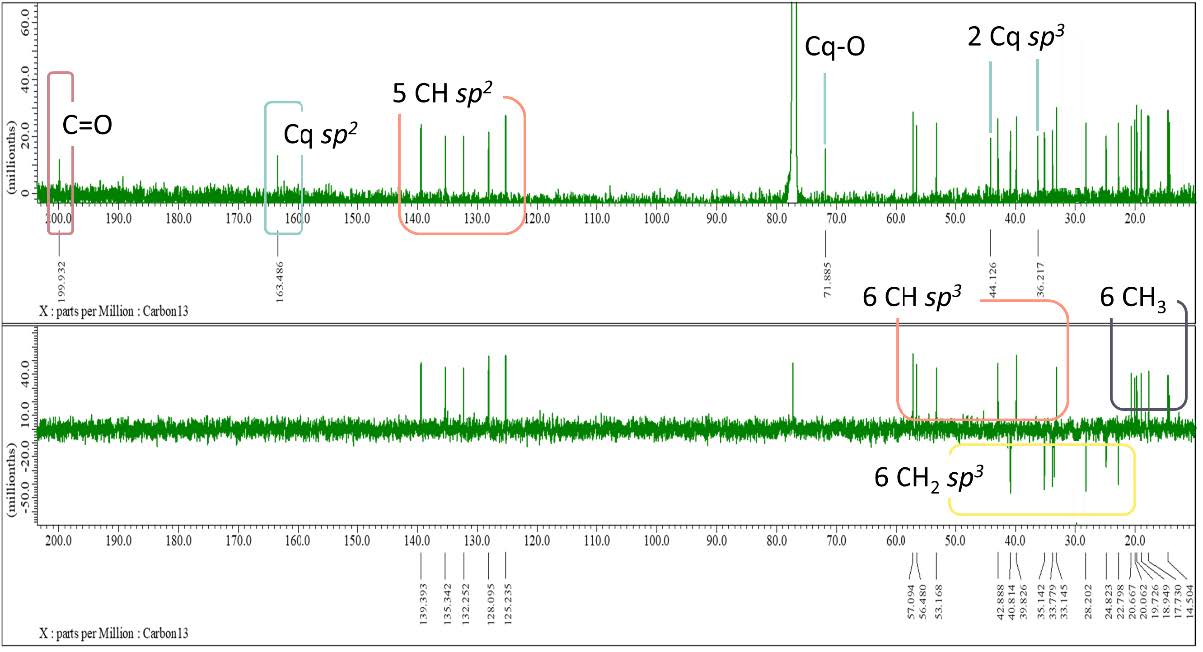
Figure S6. 13C-NMR and DEPT-135 spectrum of compound 1 (125 MHz, CDCl3)
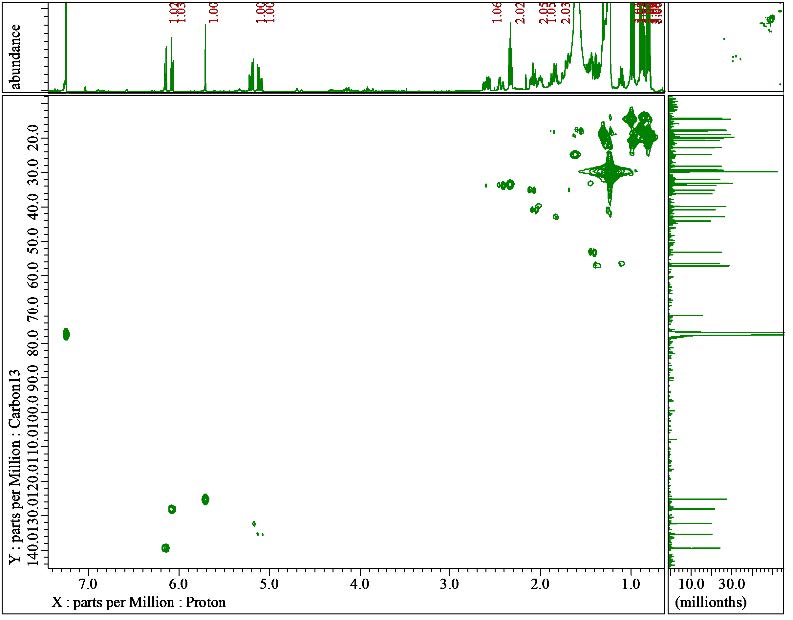
Figure S7. HMQC correlation of compound 1.

Figure S8. HMBC correlation of compound 1.

Figure S9. 1H-1H COSY correlation of compound 1.
Compound 2 Structure Elucidation
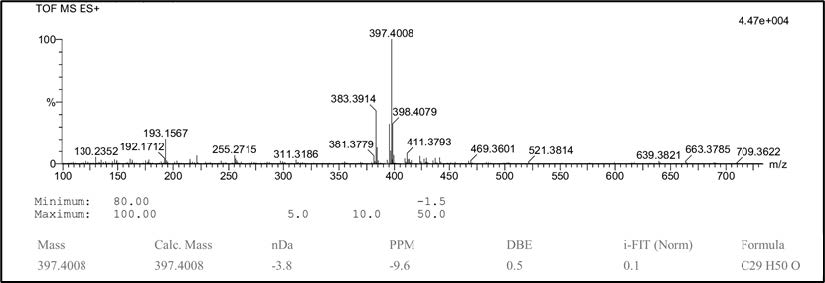
Figure S10. HR-TOFMS spectrum of compound 2.
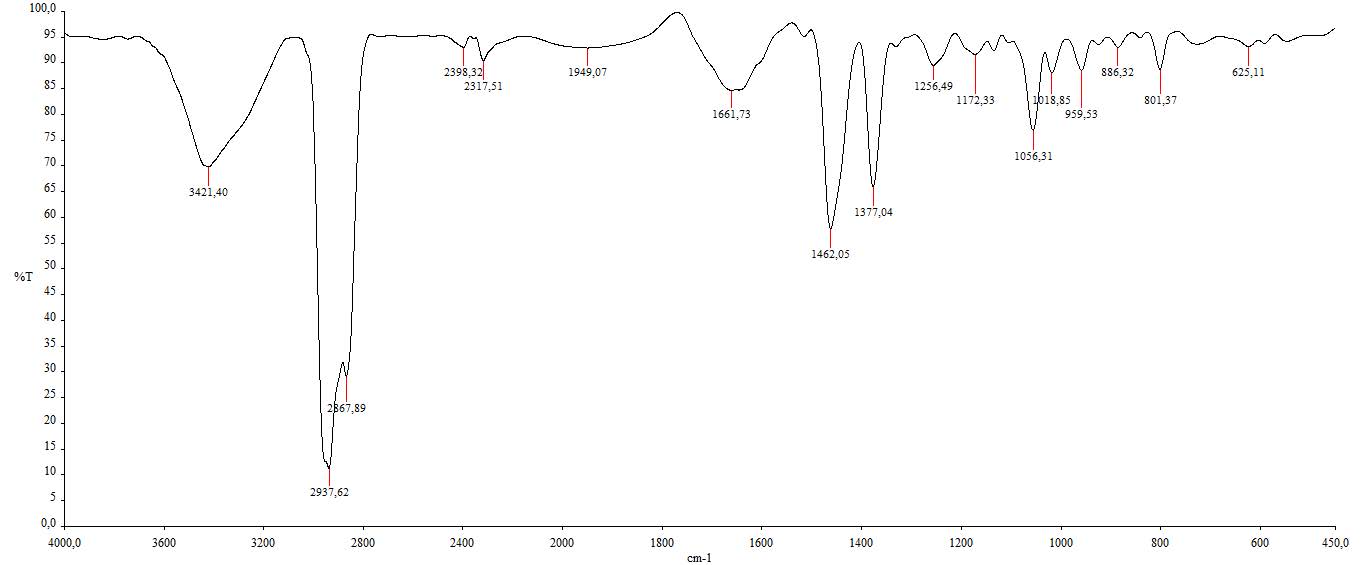
Figure S11. IR spectrum of compound 2.

Figure. S12. 1H-NMR spectrum of compound 2 (500 MHz, CDCl3).
Figure S13. 13C-NMR and DEPT-135 spectrum of compound 2 (125 MHz, CDCl3).
Compound 3 Structure Elucidation

Figure S14. HR-TOFMS spectrum of compound 3.

Figure S15. IR spectrum of compound 3.
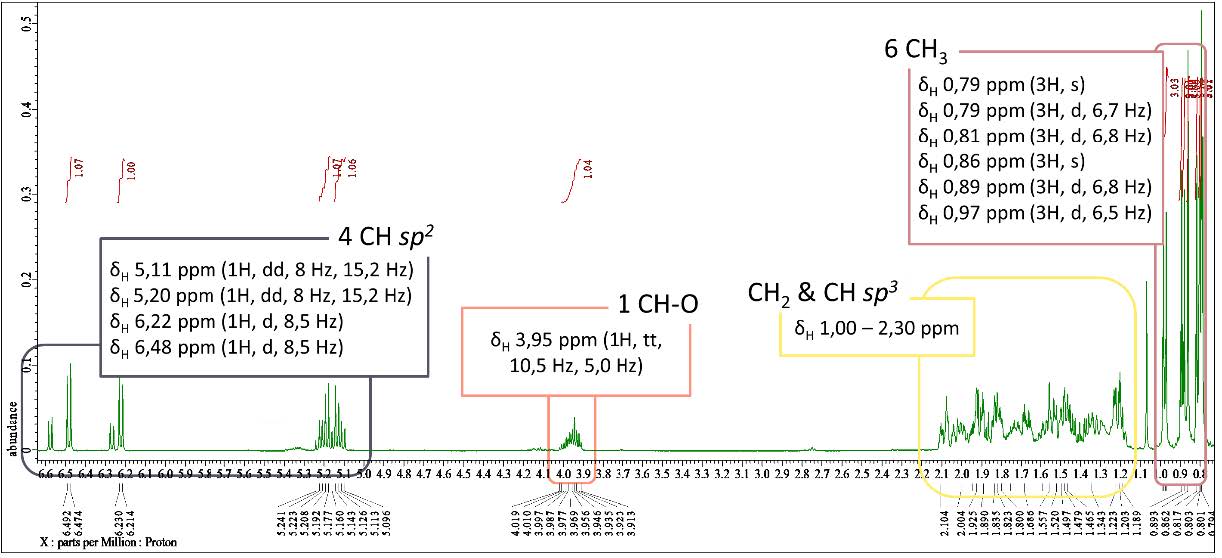
Figure S16. 1H-NMR spectrum of compound 3 (500 MHz, CDCl3).
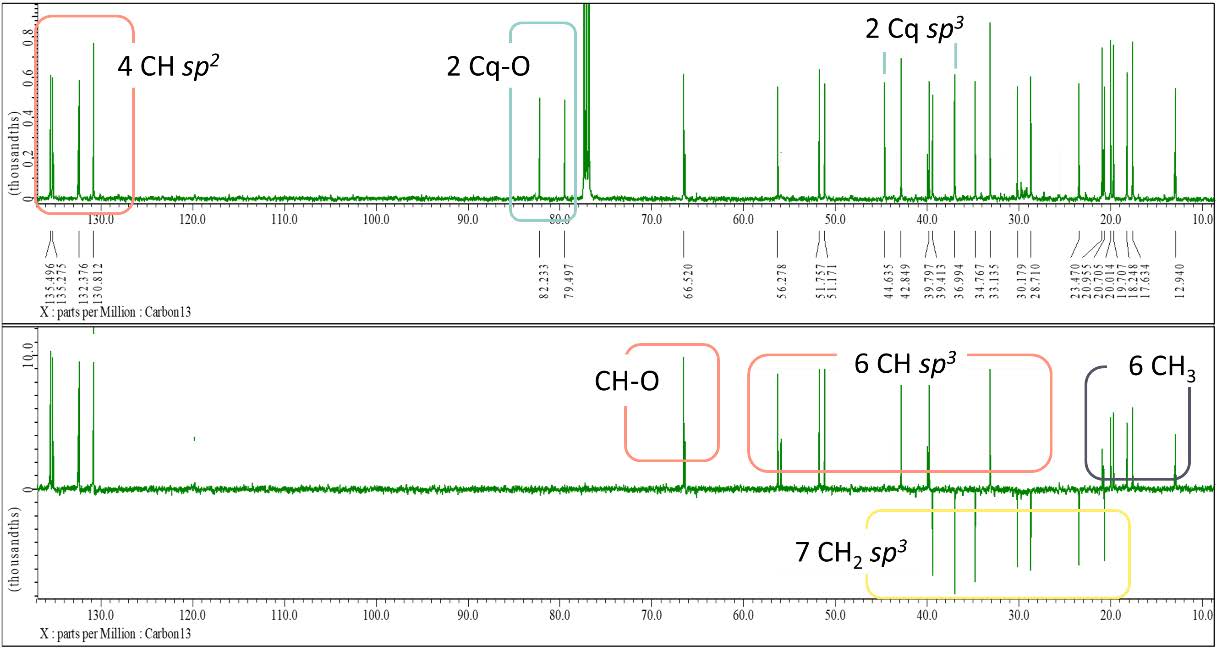
Figure S17. 13C-NMR and DEPT-135 spectrum of compound 3 (125 MHz, CDCl3).
Compound 4 Structure Elucidation
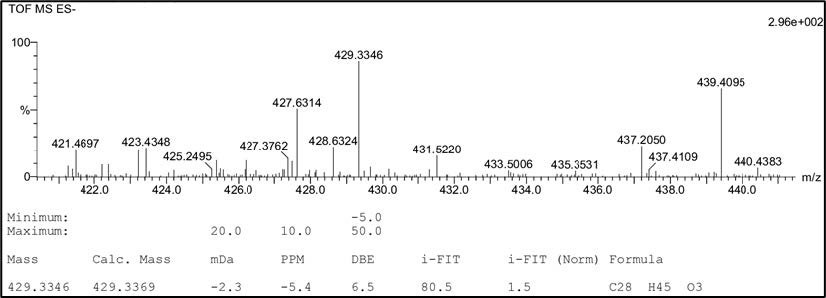
Figure S18. HR-TOFMS spectrum of compound 4.
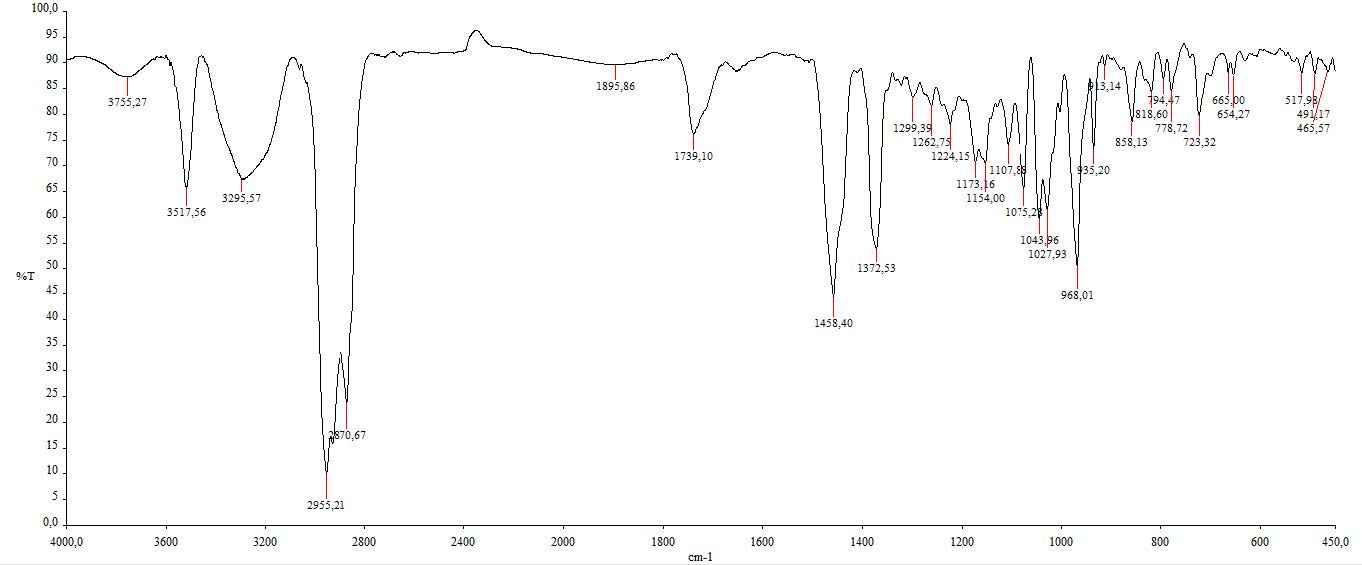
Figure S19. IR spectrum of compound 4.
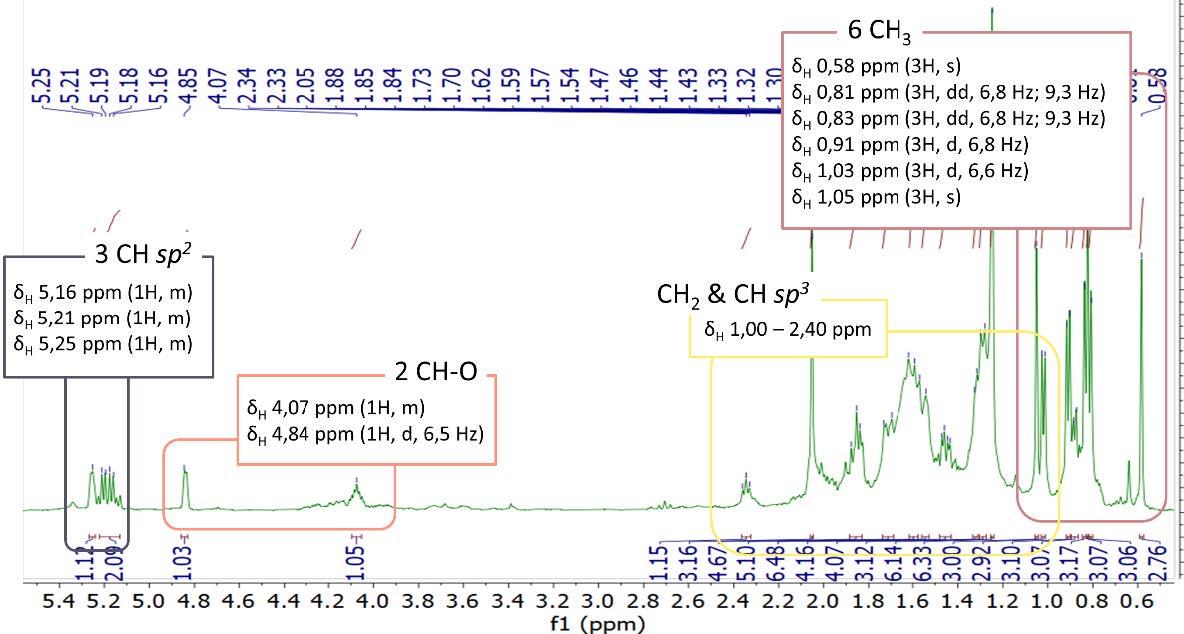
Figure S20. 1H-NMR spectrum of compound 4 (500 MHz, CDCl3).
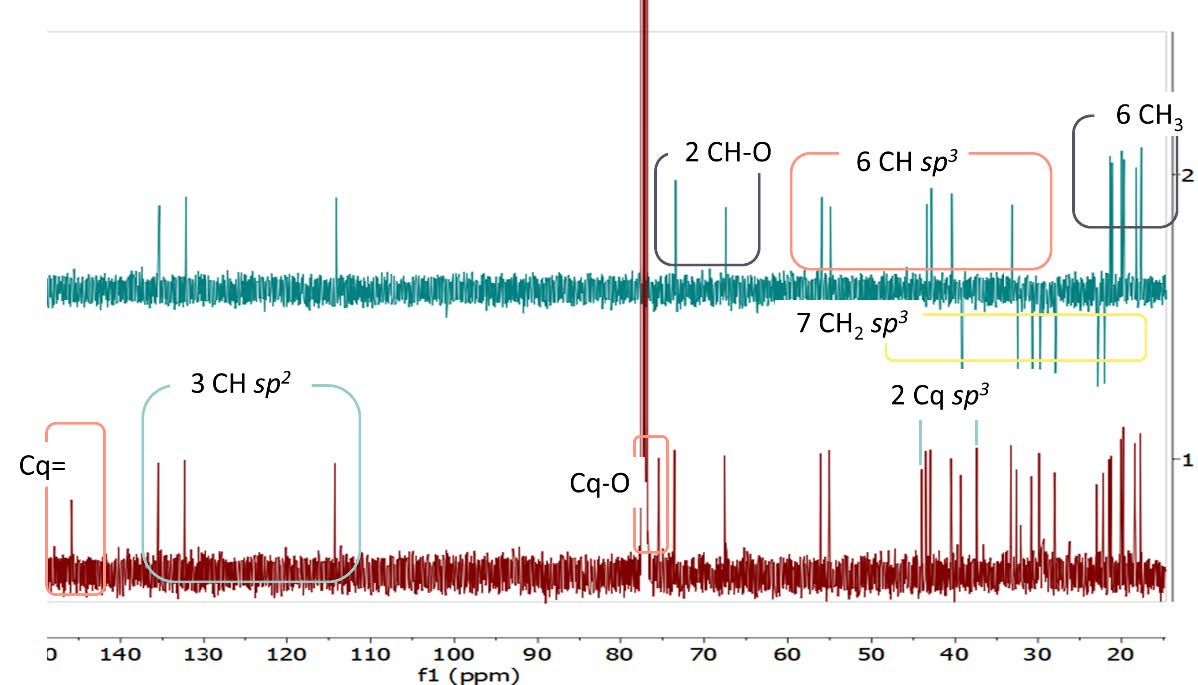
Figure S21. 13C-NMR and DEPT-135 spectrum of compound 4 (125 MHz, CDCl3).
Heme Polymerization Inhibition Activity of Compound 1 – 4
Table S6. The IC50 values of compound 1 – 4, n-hexane extract, and positive control chloroquine diphosphate according to HPIA assay
|
Samples |
Concentration (mg/mL) |
Percentage of inhibition |
IC50 (mg/mL) |
|
Isocyathisterol (1) |
10 5 2.5 1.25 0.63 |
62.73 ± 0.51 37.05 ± 0.84 16.86 ± 2.02 4.24 ± 1.11 -5.32 ± 2.04 |
7.70 ± 0.11 |
|
β-sitosterol (2) |
10 5 2.5 1.25 0.63 |
50.51 ± 0.52 26.78 ± 0.96 11.43 ± 2.15 5.15 ± 2.11 -5.09 ± 2.83 |
9.48 ± 0.09 |
|
Ergosterol-5,8-peroxide (3) |
10 5 2.5 1.25 0.63 |
55.89 ± 0.92 42.82 ± 1.17 27.72 ± 1.40 15.35 ± 0.96 8.57 ± 1.69 |
7.88 ± 0.10 |
|
Cerevisterol (4) |
10 5 2.5 1.25 0.63 |
54.08 ± 2.40 40.57 ± 3.13 24.90 ± 5.28 13.69 ± 4.47 8.04 ± 5.67 |
8.36 ± 0.56 |
|
n-hexane extract |
5 2.5 1.25 0.63 0.31 |
81.21 ± 0.21 61.86 ± 0.56 41.61 ± 0.08 21.79 ± 0.02 1.03 ± 2.04 |
2.46 ± 0.04 |
|
Chloroquine diphosphate |
5 2.5 1.25 0.63 0.31 |
95.63 ± 0.05 72.54 ± 0.01 52.99 ± 0.28 34.53 ± 0.33 20.54 ± 0.98 |
1.59 ± 0.03 |
Risyandi Anwar1, *, Galih Bayu Pratama2, Unang Supratman2, 3, *, Desi Harneti2, Azmi Azhari2, Sofa Fajriah4, Mohamad Nurul Azmi5, and Yoshihito Shiono6
1 Herbal Medicine Research, Department of Pediatric Dentistry, Faculty of Dental Medicine, University of Muhammadiyah Semarang, Semarang 50272, Indonesia
2 Department of Chemistry, Faculty of Mathematics and Natural Sciences, Universitas Padjadjaran, Jl. Raya Bandung-Sumedang Km 21, Jatinangor 45363, West Java, Indonesia
3 Central Laboratory, Universitas Padjadjaran, Jl. Raya Bandung-Sumedang Km 21, Jatinangor 45363, West Java, Indonesia
4 Research Center for Chemistry, National Research and Innovation Agency (BRIN) Kawasan PUSPIPTEK Serpong, Tangeran Selatan, 15314, Banten, Indonesia
5 School of Chemical Sciences, Universiti Sains Malaysia, 11800 Minden, Penang, Malaysia
6 Department of Bioresources Engineering, Faculty of Agriculture Yamagata University, Tsuruoka-shi, Yamagata 997-8555, Japan.
Corresponding author: Risyandi Anwar E-mail: riezdrgms@gmail.com,
Unang Supratman E-mail: unang.supratman@unpad.ac.id
Total Article Views
Editor: Nisit Kittipongpatana,
Chiang Mai University, Thailand
Article history:
Received: October 18, 2022;
Revised: June 16, 2023;
Accepted: June 26, 2023;
Published online: July 3, 2023