 ISSN: 2822-0838 Online

In vitro Assessment of Total Bioactive Contents and Antioxidant Capacity of Grape Juices Extracts of Table and Wine Varieties from Algeria and Their Correlations
Yacine Meziane, Rima Yakoubi *, Smain Megateli, and Cherifa ChaouiaPublished Date : July 10, 2023
DOI : https://doi.org/10.12982/NLSC.2023.050
Journal Issues : Number 3, July-September 2023
Abstract Vitis vinífera L. is an important source of phenolic compounds, which can prevent disease if included as a part of a diet. In this study, table grape (Cardinal, Muscat, Italia, Gros noir and Red globe) and wine grape juices extracts (Cinsault, Merlot and Syrah) were regarded as studied subject and a reliable method was established to predict their polyphenol, flavonoid, flavonol, condensed tannin, hydrolysable tannin, anthocyanin, ascorbic acid and carotenoids contents. Their antioxidant capacity was determined by using DPPH and reducing power assays. Then chemometrics methods including principal component analysis (PCA) and hierarchical cluster analysis (HCA) were used to select the most significant and responsible characteristics for discrimination of grape varieties. Black grape extracts had significantly the highest concentration of ascorbic acid (from 10.09 ± 0.14 to 15.38 ± 0.42 mg/100g), carotenoids (from 0.11 ± 0.01 to 0.58 ± 0.04 mg/100g), total phenols (from 1330.91 ± 9.24 to 1406.7 ± 10.7 mg/100g) and flavonoids (from 165.53 ± 4.7 to 393.22 ± 30.36 mg/100g). Black grape extracts showed the highest antioxidant activity [IC50 varied from 26.44 ± 1.56 to 32.62 ± 0.66 mg/mL] followed by red ones [IC50 ranged from 69.56 ± 7.61 to 80.62 ± 6.58 mg/mL]. Statistics analysis indicated that the levels of bioactive components and antioxidant activity were positively correlated. The PCA applied to the bioactive contents allowed a high degree of grape variety differentiation according to their antioxidant activity. These results showed that grape extracts, can be used in food and pharmaceutical industries as natural antioxidants agents.
Keywords: Vitis vinífera L, Grape variety, Extract, Phenolic compounds, Antioxidant activity, Multivariate analysis
Citation: Meziane, Y., Yakoubi, R., Megateli, S., and Chaouia, C. 2023. In vitro assessment of total bioactive contents and antioxidant capacity of grape juices extracts of table and wine varieties from algeria and their correlations. Natural and Life Sciences Communications. 22(3): e2023050
INTRODUCTION
Over the past decade the important roles of reactive oxygen species (ROS) and free radicals in cellular injury and diseases related to aging process, as well as health effects of natural antioxidants have been the object of many studies (Farhadi et al., 2016; Yakoubi et al., 2021a). It is proved that antioxidants compounds play an important role in preventing or inhibiting the generating of ROS in many biological systems, thus they are proven to have good effects on preventing the incidence of degenerative processes like cancer, cardiovascular disease, diabetes (Mirbagheri et al., 2018; Zhu et al,. 2019).
Generally, antioxidants can be grouped into synthetic and natural species. Whereas, the synthetic antioxidants such as butylated hydroxyanisole and butylated hydroxytolune are commonly used as additive in food products to increase shelf life, natural ones are of greater benefit for human body in comparison to synthetic ones which were found to have undesirable secondary effects (Farhadi et al., 2016; Bendjedid et al., 2020). The use of synthetic antioxidants has been the target of safety concerns due to the possibility of toxic activities to consumer’s health. Studies reported that they can lead to negative implications, such as mutagenic and carcinogenic effects (Boeira et al., 2020). Recently, the importance of natural antioxidants to cure illnesses such as cancer, Alzheimer’s, and diabetes, either by inhibition of key enzymes implicated in such metabolic disorders, or scavenging of free radicals has attracted much research attention as nutritionists through the last 20 years (Benouchenne et al., 2022). Natural antioxidant compounds include vitamins, phenols, carotenoids, and flavonoids (Farhadi et al., 2016). Among the last group, flavanols, anthocyanins, flavonols, stilbenes and tannins are the most important (more than half of the total phenolic compounds) and exhibit substantial antioxidant activity (Van leeuw et al., 2014).
Nowadays, with the current upsurge of interest in the efficacy and use of natural antioxidants, foods of plant origin have received much attention (Zeghad et al., 2019). Among them, various fruits and vegetables play an important role in human nutrition and health because of their nutritional properties and bioactive principles including phenolic compounds, vitamin C, vitamin E and β-carotene. The regular intake of them in our diet is associated with reduced risk of chronic diseases. Phenolic compounds are the main classes of natural antioxidant compounds in nature, especially those of fruits and vegetables (Zhu et al., 2019). The potential beneficial health effects attributed to the phenolic compounds showed a high correlation with antioxidant activity (Farhadi et al., 2016).
Grapes (Vitis vinifera L.) are one of the large fruit crops cultivated in the Mediterranean area and are appreciated for their peculiar flavor and sensorial properties (Mollica et al., 2021). They contain several dietary constituents essential for human health such as fiber, carotenoids and vitamins (C and E), as well as bioactive phytochemicals including different phenolic compounds in leaves, skins, pulp and seeds which may show biological properties of interest, related to their antioxidant properties (Farhadi et al., 2016 ; Pardo-Mates et al., 2017). Furthermore, anthocyanins as one of the major groups of flavonoids, are exclusively present in the cell walls and vacuoles of grape skins, and are directly responsible for the red color in grapes (Kanha and Laokuldilok, 2014; Aubert and Chalot, 2018).
Products made from grape berries such as wine and grape juice are all known to contain a diverse array of potent antioxidants in the form of phenolic compounds (Eshghi et al., 2014). Importantly, the composition in bioactives in grape and consequently in grape juice is mainly dependent on grape variety thus allowing their differentiation. Each variety has an individual phenolic composition (Van leeuw et al., 2014; Da silva et al., 2019). Red juice are considered to have more antioxidant effect than white and rose´ juice, due to their higher content in antioxidant substances released from the grape skin and pulp (Moreno-Montoro et al., 2015). In view of this, evaluating such effect could be informative and useful.
Although, several studies reported the major phenolic contents and antioxidant activities (Mirbagheri et al., 2018; Zeghad et al., 2019), but the available information on the detailed phenolics composition and antioxidant capacities from Algerian grape juices from different varieties is still scarce, hindering their valorization. The only work was carried out by Derradji-Benmeziane et al. (2014) focusing on the study of antioxidants and antioxidant activity of table grapes those of the region with low viticultural activity EL-Tarf in the north-east of Algeria. This study represent one of the few attempts to measure the phenolic compounds content and antioxidant activity in native grape cultivars in our country and, consequently, in their juices.
Taking into account that grapes composition seems to be related to food features such as variety, their classification need a statistical approach capable of interpreting patterns in multivariate data. Principal component analysis (PCA) and cluster analysis (CA) are the most commonly used multivariate analysis techniques to examine the entire data of various grapes and to classify them (Bari et al., 2021). Thus, multivariate analysis might be useful for differentiated grapes, taking into account the type and concentration of the antioxidants as well as the antioxidant activity.
Considering this background, the aims of this study comes within the antioxidants composition and antioxidant activity of grape juice of some table and wine varieties growing in the region of Tipaza, Algeria. As a first step, we were interested in the quantification of different antioxidants contained in the grape juices. As a second step, we studied their antioxidant activity in terms of the reducing power and the DPPH radical scavenging activity. To classify the samples, based on type and concentrations of antioxidant content, a multivariate analysis was finally applied using PCA followed by hierarchical cluster analysis (HCA).
MATERIALS AND METHODS
Grape sample and site description
Our study carried out on eight different grape juices varieties (Vitis vinifera L.): black grapes (Gros noir, Cinsault, Merlot, Syrah), red grapes (Cardinal and Red Globe) and white grapes (Muscat and Italia) (Figure 1). These samples have been harvested at optimal maturity, during August 2019, from two daïra; Cherchell (Latitude: 36.6085, Longitude: 2.19718 36° 36′ 31″ North, 2° 11′ 50″ East) and Ahmer El Aïn (Latitude: 36.4782, Longitude: 2.56393 36° 28′ 42″ North, 2° 33′ 50″ East) located in Tipaza region. These places were selected according to the following criteria: (i) the existence of a deep-rooted cultural tradition for the local consumption of the table and wine grape varieties; (ii) an intense cultivation and production of the different grape varieties used to prepare the drink; (iii) an easy differentiation, in terms of number and types, of the different grape varieties present in these places. The samples were clearly identified and the berries were manually separated and placed in clean, dry, rigid and hermitic containers until used.
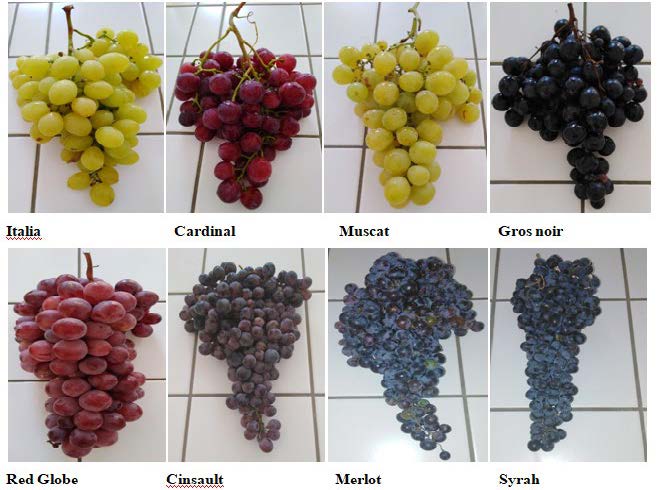
Figure 1. Color appearance of the grape varieties examined in this study (Original).
Sample preparation
To prepare whole grape juice, an equal portion of fresh grapes from each variety was washed manually with a tap water. After removing the seeds, a blender (Retsch GM 200) composed of a cylindrical basket and an abrasive disc in the center was used to obtain the grape juice. The juice was centrifuged for 20 min, the supernatant was then filtered through a filter and the filtered juices were kept at −18°C until preparing methanolic extracts the following day.
Determination of vitamin C (Vit C) content
The back titration method was used to determine the amount of vitamin C according to Pourmaghi-Azar and Ojani (1997). A known excess of diiodine in grape juice will react with the ascorbic acid until it is all consumed. The excess diiodine, which did not react with ascorbic acid will then be titrated with sodium thiosulfate solution Na2S2O3 (sodium thiosulfate pentahydrate, 99+ % extra pure, ACROS Organics™). Results were expressed as mg of vitamin C/100 mg of grape juice.
Determination of total carotenoid content (TCC)
The TCC was determined spectrophotometrically using the method described by Sass-Kiss et al. (2005). Briefly, 20 mL of mixed extraction solvents (hexane/acetone/ethanol, 2:1:1) was added to 10 g of fresh crushed grapes. After stirring for 30 min the upper phase was recovered. 10 mL of hexane was added for a second extraction. The mixture of the two hexane phases was used to determine the TCC at 480 nm. The quantification was estimated by reference to the calibration curve using β-carotene as standard; y = 6.21 x + 0.032, R2=0.998). Values were expressed in mg β-carotene equivalent per 100g of grape juice.
Methanolic extracts preparation
Each crushed sample (10 g) was extracted by stirring with 20 mL of methanol into conical flasks until uniform consistency. The samples were then shaken for 24 h at 4°C, and achieved extracts were filtered through a filter paper, and evaporated under vacuum to dryness and properly protected and stored in a fridge (4°C) until further analysis within a maximum period of one week. The extraction Procedure was repeated three times successively on the solid residues obtained by centrifugation at 3,000rpm/15min.
Determination of phenolic compounds
Total polyphenol index (TPI). The used method consist on measuring absorbance at 280 nm of grape juice treated with ethanol and hydrochloric acid and then diluted 100 times in distilled water (Delso et al., 2022) . A volume of 50 g of grape juice was mixed with 15 mL of ethanol (95%) and 85 mL of HCl solution (37% diluted to 0.1% in distilled water). After maceration at room temperature for 1h, the grinding was filtered on glass wool. Subsequently, the filtrate was diluted to 1/100th with demineralised water which was used to determine the absorbance at 280 nm. TPI was estimated using the following formula:
TPI(%) = DO280 ×100 × [(crusher weight + 100) / (crusher weight]
Where 100 represent the volume of the solution added to the crusher
Total phenolic content (TPC). The TPC of methanolic extracts was determined calorimetrically using the Folin Denis method (Singleton et al., 1999; Teow et al., 2007). 0.5 mL of the methanolic extracts was diluted with 5 mL of distilled water, and then 0.5 mL of Folin–Ciocalteau 1 N reagent (50% v/v) was added. After 3 minutes, 0.5 mL of sodium carbonate (20%) was added and the mixture was allowed to stand in the dark at room temperature for 1h. The absorbance of the reaction was measured at 765 nm. The TPC was calculated from the linear regression equation of standard curve of gallic acid (y = 6.67x + 0.0099, R2=0.999) and expressed as milligrams of gallic acid equivalent (GAE) per 100 g of extract (mg GAE/100g of extract).
Total flavonoid content (TFC). The TFC was quantified applying the colorimetric method reported by Djeridane et al. (2006). 1 mL of the extract solution from each sample was added to 1 ml of 2% aluminum chloride solution (prepared in methanol). After 10 minutes of incubation at room temperature, the absorbance was read at 430 nm. The TFC was calculated from the linear regression equation of the standard quercetin curve (y = 6x + 0.0003, R2 = 0.997) and expressed as quercetin equivalents in milligrams per 100g of extract (mg QE/100g of extract).
Total flavonol content (FLC). The content of these compounds was quantified using the colorimetric method reported by Djeridane et al. (2006). A volume of 500 µL of extract was added to 500 µL of distilled water, 500 µL of aluminum chloride (2%) and 500 µL of sodium acetate (50 mg/L). After 30 min, the absorbance was read at 440 nm. The FLC was calculated from the linear regression equation of the standard rutin curve (y = 4.77x + 0.0024, R2=0.999) and expressed as rutin equivalents in milligrams per 100g of extract (mg RE/100g of extract).
Total hydrolysable tannin content (THTC). The determination of total tannins was assayed using the spectrophotometric method according to Cayla et al. (2002). In an acidic medium, tannins were transformed to anthocyannins that after heating give a red pigment. 2 mL of the extract diluted to 1/50 was mixed with 3 mL of HCl (12 N) and 1 mL of ethanol (95%). When heated to 97°C and after 30 minutes of incubation, the absorbance of the obtained solutions was read at 550 nm. The THTC was calculated from the linear regression equation of standard curve of tannic acid (y=4.5x + 0.024, R2=0.998) and expressed as tannic acid equivalents milligrams per 100 g of extract (mg TAE/100g of extract).
Total condensed tannin content (TCTC). The analysis of TCTC was carried out using the spectrophotometric method according to Škerget et al. (2005). In the presence of the "butanol + iron sulphate" reagent, the tannins precipitate more or less quickly, depending on their condensation state (the less condensed compounds remain in solution). For that, 0.2 mL of extract solution was added to 2 mL of iron butanol sulphate reagent and the mixture was incubated in a 95°C water bath for 20 minutes. The absorbance was measured at 530 nm. The TCTC was calculated from the linear regression equation of standard curve of catechin catechin acid (y=3.92x-0.09, R2=0.990) and expressed as catechin acid equivalent in milligrams per 100g of extract (mg CAE) /100g of extract).
Total anthocyanin content (TAC) and total anthocyanin potential (TAP). The method was investigated according to the procedure described by Delso et al. (2022). A volume of 50 g of grape juice was mixed with 15 mL of ethanol (95%) and 85 mL of HCl solution (37% diluted to 0.1% in distilled water). After maceration at room temperature for one hour with a manual agitation of one minute every quarter of an hour, the grinding was filtered on glass wool. Subsequently, this filtrate was diluted to 1/20th with a 1% HCl solution and the absorbance at 520 nm was measured against a distilled water white under 1 cm of optical path. TAC and total TAP were estimated as follows:
TAC (mg/L) = DO520 x 22.75 x 20
Where: 22.75 is slope of the calibration line obtained from cyanidin -3-glucoside.
TAP = Anthocyanins (mg/L) x 100 x [(grape juice weight +100)/ grape juice weight].
The results were expressed as mg cyanidin-3-glucoside equivalent per 1Kg of extract.
Determination of the antioxidant activity
DPPH assay. The 2,2-diphenyl radical 1-picrylhydrazyl (DPPH) assay was determined by the method described previously (Molyneux, 2004). The DPPH scavenger effect assay based on the existence of natural phenolic compounds and their activity to donate a hydrogen ion to convert DPPH radicals from stable free radical (DPPH•) to non-radical (DPPH-H). This changing depends on the number of hydrogen atoms absorbed, which can be monitored spectrophotometrically by measuring the bleaching of DPPH• color from purple to yellow. So the loss of absorbance reflects radical scavenging activity. In this method, 2.9 mL of the DPPH• solution was mixed with 0.1 mL of each extract at different concentrations. After an incubation period (30 min) at room temperature in the dark, the absorbance was measured at 515 nm. The concentration of the sample reducing the initial absorbance of the DPPH solution by 50%, called the IC50, was determined from the curve of the percentages of inhibition obtained at different concentrations (mg/mL). Tannic acid and rutin were used as antioxidant standards to compare the activity. The free radical scavenging activity of the extracts, expressed as percent inhibition of DPPH, was calculated according to the formula:
% inhibition of DPPH•= (Absblank – Abssample / Absblank) x 100
Reductive power (RP). The reducing power was performed according to the method of Oyaizu (1986), reported by Kumar et al. (2005). The reductive ability of methanolic extracts of grape juices was based on their ability to reduce ferric chloride/ferricyanide complex ions to the ferrous form. To perform the assay, 1mL of each extract at different concentration was mixed with 2.5 mL of phosphate buffer (pH 6.6; 0.2M and 2.5mL of 1% Potassium ferricyanide (K3Fe (CN)6). After 20 min of incubation at 50°C, 10% of trichloracetic acid was added to the mixture and centrifuged at 3,000 rpm. Then, 2.5 mL of distilled water and 0.5 mL of ferric chloride (0.1%) were added to 2.5 mL of the supernatant. After 10 min the absorbance was read at 700 nm and the results were expressed in mg gallic acid equivalent/g of extract (mg GAEA/g of extract).
Statistical analysis
All the experiments were repeated tree times and the results were expressed as means ± SD. The obtained results were analyzed by ANOVA. Multiple group comparison was undertaken by ANOVA and Tukey’s test using XLSTAT 1.1.1089 2021 software (P < 0.05). PCA and HCA were also performed with XLSTAT 1.1.1089 2021 software to classify and discriminate among the grape cultivars.
RESULTS
Ascorbic acid and total carotenoid contents
The results obtained for the vitamin C and carotenoid total contents of the analyzed juices were recorded in Figure 2. The vitamin C and carotenoid total contents were significantly different (P < 0.05) amongst the various extracts investigated in the present study. The trend observed showed that, the TCC and vitamin C content were higher in black grape varieties; They ranged from 10.09 ± 0.14 (Cardinal) to 15.38 ± 0.42 mg/100g (Syrah) for the vitamin C content and ranged from 0.11 ± 0.01 (Red Glob) to 0.58 ± 0.04 mg/100g (Syrah) for TCC.
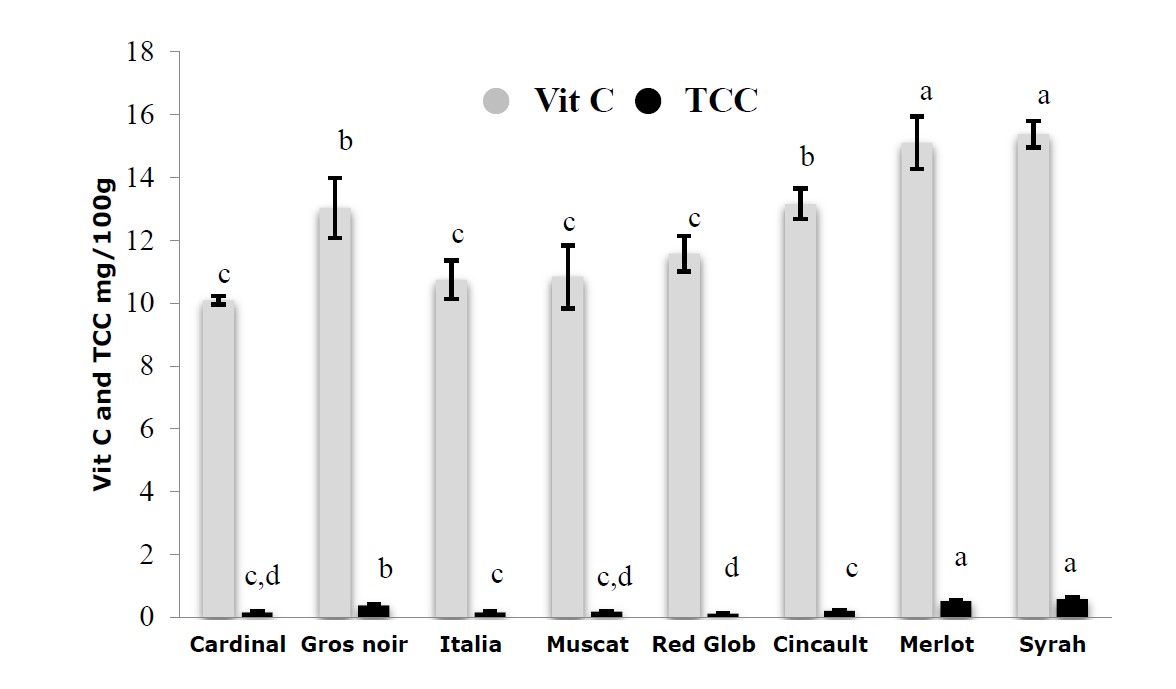
Figure 2. Vitamin C and total carotenoids contents of grape juices extracts. Values are expressed as Mean ± SD (n=3). The data shown in different characters in the same column indicate statistically significant differences (P < 0.05).
Phenolic compounds content
The TPI and TPC of grape juice extracts are presented in Figures 3 and 4. For the black grape extracts, the TPI was higher and near in all extracts, especially for Merlot and Cinsault extracts (145 ± 14 and 146 ± 21%, respectively). Concerning red grape extracts, the Cardinal showed a high TPI (119.75 ± 13%) followed by the Red Globe (104.00 ± 14%). However, for the Muscat and Italia white varieties, the percentage of TPI was the lowest and closest in the two extracts comparing to other varieties (112. 91 ± 19 and 97.50 ± 3%, respectively).
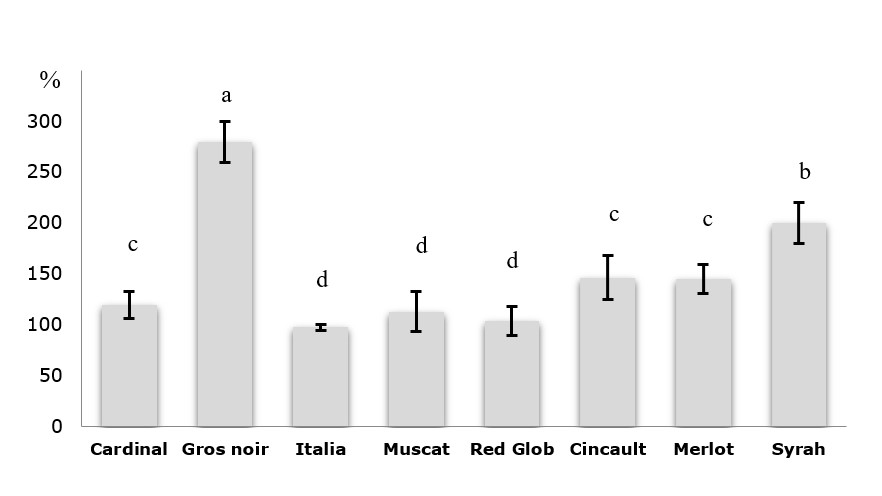
Figure 3. Total polyphenols index of grape juices extracts. Values are expressed as Mean ± SD (n=3). The data shown in different characters in the same column indicate statistically significant differences (P < 0.05). Basic concept of Raman spectroscopy
Furthermore, TPC of grape extracts varied between varieties and ranged from 347 ± 5.84 (Red glob) to 1406.7 ± 10.7 mg100g (Gros noir). Among varieties, black grape extracts had the higher phenolic amount (>900 mg/100g) than white one (Muscat and Italia with content of 452.78 ± 5.8 and 442.70 ± 3.02 mg/100g, respectively). Red Globe presented only 347 ± 6.84 mg/100g.

Figure 4. Total polyphenols contents of grape juices extracts. Values are expressed as Mean ± SD (n=3). The data shown in different characters in the same column indicate statistically significant differences (P < 0.05).
The results obtained for TFC, FLC, THTC and TCTC are presented in Figure 5. We noted that the total flavonoid content of the analyzed extracts varied with the cultivar and ranged from 49.58 ± 5.72 (Italia) and 393.22 ± 30.36 mg/100g (Gros Noir). However, black grape extracts have the highest amount of flavonoids (165.53 ± 4.7-393.22 ± 30.36 mg/100g) followed by red grape extracts (67.60 ± 8.37-145.32 ± 15.86 mg/100g), while white grape extracts have shown the lowest values (49.58 ± 5.72-64.92 ± 8.37 mg/100g). As regards flavonols, the results showed significant differences (P < 0.05) between all the studied extracts. The Gros noir variety presented considerably higher flavonol content (106.56 ± 3.46 mg/100g) than the rest of the varieties, and the Red glob variety showed the lowest content (13.16 ± 2.92 mg/100g).
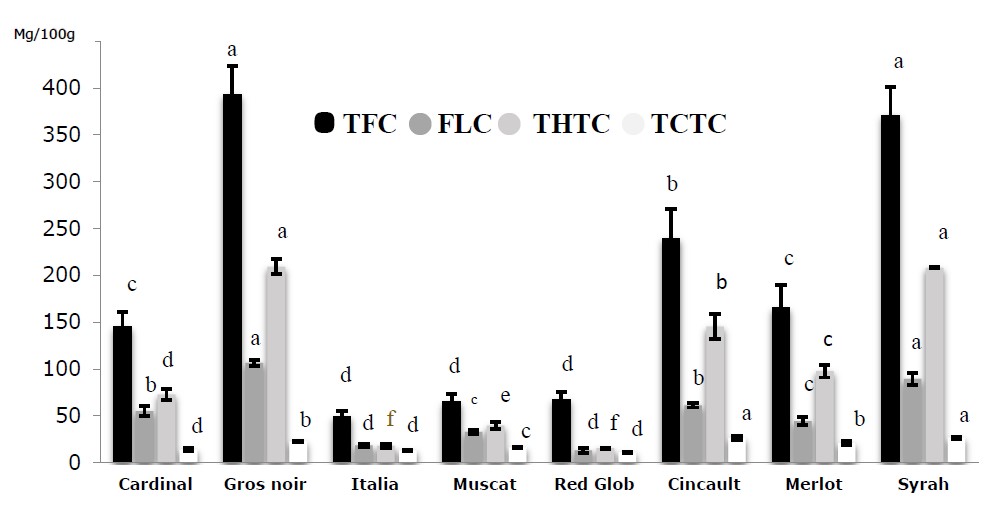
Figure 5. Total flavonoid, total flavonol, and total hydrolysable and condensed tannin contents of grape juices extracts. Values are expressed as Mean ± SD (n=3). The data shown in different characters in the same column indicate statistically significant differences (P < 0.05).
By considering the results contained in Figure 5, THTC and TCTC were concentrated differently according to variety (P < 0.05). THTC ranged from 15.48 ± 0.77 for Red glob variety to 209.28 ± 7.9 mg/100g for Gros noir variety and TCTC from 11.07 ± 0.51 for Red glob to 26.76 ± 0.25 mg/100g for Syrah variety. Among varieties, the results showed that THTC and TCTC were found being usually more abundant in black grape extracts than in red and white ones. However, in Red glob variety, THTC and TCTC exhibited the lowest concentration compared to the other varieties
The total anthocyanin potential and anthocyanin content of the grape extracts obtained are presented in Figure 6. As can be seen, the TAP and TAC varied widely among the grape varieties, ranging from 54.30 ± 1.31 (Italia) to 1455.9 ± 4.13 mg/Kg (Syrah) and from 1.81 ± 0.04 to 48.53 ± 1.80 mg/100g, respectively, for the same grape varieties. Consequently, it is notable that all varieties showed similar proportions of the TAC, although Muscat and Italia extracts stood out because of its relatively low percentage of these compounds. Similarly, Syrah stood out for its high anthocyanin contribution to total anthocyanin. For the TAP, it was insufficient for the Italia, Muscat, Red Glob, Cinsault and Cardinal varieties with values of 54.30 ± 1.31, 81.60 ± 2.40, 358.71 ± 9.92, 412.21 ± 12.31 and 462 ± 28.61 mg/Kg respectively; it was average for the Merlot variety with 731.11 ± 2.66 mg/Kg, and excellent for the Gros Noir and Syrah varieties with values of 1353.6 ± 8.6 and 1455.9 ± 5.13 mg/Kg respectively.
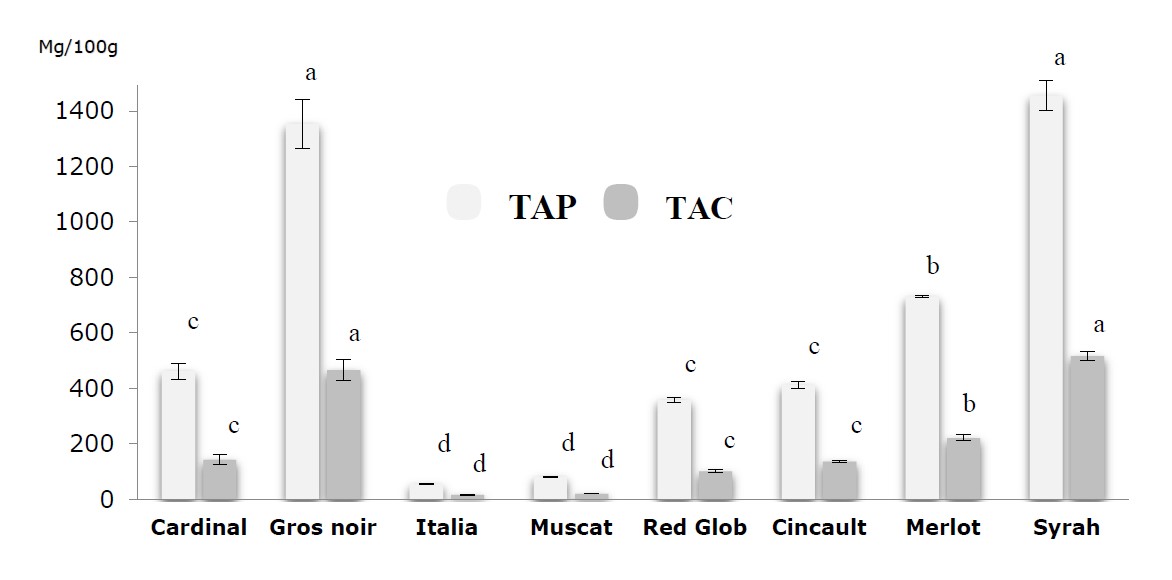
Figure 6. The total anthocyanic potential and anthocyanins contents of the grape juices extracts. Values are expressed as Mean ± SD (n=3). The data shown in different characters in the same column indicate statistically significant differences (P < 0.05).
Antioxidant activity
The results of the antioxidant activity using DPPH and reducing power assays are given in Table 1. The inhibition percentage of the radical DPPH and the IC50 values of the analyzed extracts ranged between 11.67 ± 1.60 (Italia) and 65.39 ± 3.76% (Gros noir) and between 26.44 ± 1.56 (Gros noir) and 149.78 ± 13.44 mg/mL (Italia), respectively. It is worth noting that at a concentration lower than 60 mg/mL, black grape varieties showed the highest capacity to scavenge the DPPH radical with close IC50 values followed by red grape varieties. Whereas white grape varieties, which had lower polyphenol content, displayed the lowest DPPH• inhibition and the highest IC50 value so that the weakest antioxidant capacity requiring a concentration higher than 100 mg/mL. However, it should be born in mind that the scavenging activity of DPPH radical obtained for the two flavonoids "rutin and tannic acid" is comparable to that observed in the black grape extracts. In reducing power, the antioxidant activity of black grape varieties ranged from 14.38 ± 1.38 (Cinsault) to 16.65 ± 0.44 mg/g (Gros noir), which is higher reducing power when compared to white varieties (Muscat and Italia: 9.96 ± 1.27 and 9.84 ± 1.16 mg/g, respectively). Red grape varieties (Cardinal and Red Glob) tend to have an intermediate reducing power of 12.28 ± 0.96 and 10.26 ± 0.63 mg/g, respectively).
Table 1. Antioxidant activity of the different studied extracts.
|
Varieties |
Antioxidant activity |
||
|
Reducing power (mg/g) |
DPPH % |
IC50 (mg/mL) |
|
|
Cardinal |
12.28 ± 0.96bc |
25.00 ± 2.73c |
69.56 ± 7.61b |
|
Gros noir |
16.65 ± 0.43a |
65.39 ± 3.76b |
26.44 ± 1.56a |
|
Italia |
9.84 ± 1.16c |
11.67 ± 1.60d |
149.78 ± 13.44d |
|
Muscat |
9.96 ± 1.27c |
16.60 ± 2.94cd |
106.05 ± 10.15c |
|
RedGlob |
10.26 ± 0.63c |
21.60 ± 2.53cd |
80.62 ± 6.58b |
|
Cinsault |
14.38 ± 1.38ab |
52.89 ± 1.08b |
32.62 ± 0.66a |
|
Merlot |
15.59 ± 1.45a |
53.43 ± 5.70b |
32.53 ± 3.54a |
|
Syrah |
15.99 ± 1.51a |
56.49 ± 3.87b |
30.63 ± 2.12a |
|
Tannic acid |
- |
83.82 ± 2.21a |
20.58 ± 0.54a |
|
Rutin |
- |
77.11 ± 4.65a |
22.42 ± 1.32a |
Note: Values are expressed as Mean ± SD (n=3). The data shown in different characters in the same column indicate statistically significant differences (P < 0.05).
Chemometric analysis
Investigation of the correlation between the measured trails of the samples was analyzed by means of the PCA (Figure 7) to identify the factors influencing each one. The position of each variable in the loading plot describes its relationship with the other variables. Variables that are close to each other have high correlations. The PCA accounted 82.90% of the total variance (89.72%) on the first axis while the second axis accounted 6.81%. The first PCA circle identified the studied variables (Figure 7a). As can also be seen in Figure 6, most of the information of the dataset is in the first axis explaining the positive correlations; including antioxidants, reducing power and DPPH assays. The IC50 value of the DPPH radical had an obvious contrast with the measured variables (distributed on the axis 2). The antioxidant activity of the studied methanolic extracts had good linear correlations with the levels of phenolic compounds, flavonoids, carotenoids and vitamin C with respective r² correlation coefficients of 0.887, 0.859, 0.749 and 0.802 for the reducing capacity and 0.940, 0.894, 0.729 and 0.810 for the DPPH assay (Table 2). Unlike the composition in antioxidants, the IC50 values of DPPH were negatively correlated with the antioxidants contents.

Figure 7. The distribution and correlation between the studied variables (a). Plot of the principal component analysis (b) performed on all varieties based on different phytochemical compounds analyzed in juices extracts of five Algerian grape varieties and their antioxidant activity (DPPH and reducing power).
The PCA based on all the traits evaluated showed a high variation among varieties. As indicated in the loading plot (Figure 7b), the plot according to axes 1 and 2 (66% of the total variation) revealed three groups of grape variety aggregates. The Gros noir and Syrah grape varieties formed the first group on the positive side of axis 1. The second group, on the positive side of the same axis, includes the Merlot and Cinsault grape varieties. The remaining varieties (Italia, Muscat, Red glob and Cardinal) formed the third group on the negative side of axis 1.
Table 2. Correlation coefficients between the studied variables on studied grape juices extracts.
|
Variables |
vit C |
TCC |
TAC |
TAP |
TPC |
THTC |
TFC |
FLC |
TPI |
RP |
DPPH |
TCTC |
IC50 |
|
vit C |
1 |
||||||||||||
|
TCC |
0.840 |
1 |
|||||||||||
|
TAC |
0.696 |
0.810 |
1 |
||||||||||
|
TAP |
0.696 |
0.810 |
1.000 |
1 |
|||||||||
|
TPC |
0.758 |
0.762 |
0.875 |
0.875 |
1 |
||||||||
|
THTC |
0.672 |
0.717 |
0.896 |
0.896 |
0.970 |
1 |
|||||||
|
TFC |
0.638 |
0.683 |
0.926 |
0.926 |
0.948 |
0.986 |
1 |
||||||
|
FLC |
0.517 |
0.616 |
0.874 |
0.874 |
0.915 |
0.960 |
0.965 |
1 |
|||||
|
TPI |
0.514 |
0.593 |
0.853 |
0.853 |
0.895 |
0.879 |
0.893 |
0.896 |
1 |
||||
|
RP |
0.802 |
0.749 |
0.833 |
0.833 |
0.887 |
0.860 |
0.859 |
0.822 |
0.751 |
1 |
|||
|
DPPH |
0.810 |
0.729 |
0.835 |
0.835 |
0.940 |
0.911 |
0.894 |
0.841 |
0.812 |
0.939 |
1 |
||
|
TCTC |
0.761 |
0.684 |
0.684 |
0.684 |
0.903 |
0.899 |
0.839 |
0.792 |
0.691 |
0.801 |
0.878 |
1 |
|
|
IC50 |
-0.728 |
-0.636 |
-0.764 |
-0.764 |
-0.801 |
-0.808 |
-0.792 |
-0.749 |
-0.667 |
-0.861 |
-0.918 |
-0.756 |
1 |
Note: Values in bold are different from 0 at a significant level alpha =0.05
To evaluate the likely similarities and relationships among and within the grape extracts studied, HCA was performed based on the antioxidant contents. The HCA results are presented in the form of a dendrogram in Figure 8. This analysis provided a better understanding of the distribution of antioxidants in grape varieties, suggesting a diverse chemical composition. The dendrogram based on the Euclidean distance matrix grouped the varieties into three groups already identified by the PCA and four subgroups. The first group which includes Gros noir and Syrah varieties is the most distant in the dendrogram. The distinction of this population is predetermined by the highest level of antioxidant content. Cinsault and Merlot were classified in the second group. Based on the anthocyanins and tannins contents, this group was further divided into two subgroups. The first comprised Cinsault variety the high content of which was anthocyanins (145.38 mg/100g). Finally, Merlot variety with higher quantity of tannins (24.37 mg/100g) than Cinsault variety (13.74 mg/100g) was assigned to the second subgroup. The third group consisted of the four accessions of Italia, Muscat, Red glob and Cardinal varieties; all contained a moderate amount of antioxidant content. In this group, Cardinal and Red Glob varieties were separated from the Italia and Muscat varieties of their exceptionally high level of anthocyanins content with respective values of 15.4 and 13.74 mg/100g for the first sub-group and 2.72 and 1.81 mg/100g for the second one.

Figure 8. The hierarchical cluster analysis dendrogram of the grape extracts by the total bioactive contents.
DISCUSSION
Grapes are known as a source of vitamin C in the dietary intake (Derradji-Benmeziane et al., 2014). The results obtained for the vitamin C content of the analyzed juices were quite different from the reported literature of identical and different geographical origins. Results for cardinal, Muscat and Gros noir varieties with respective rates of 10.09 ± 0.14, 10.84 ± 0.14 and 13.03 ± 0.96 mg/100g were slightly lower than those found by Derradji-Benmeziane et al. (2014) with respectively 13.20, 14.08 and 30.80 mg/100g for the same varieties grown in El Taref "Algeria". In addition, results a study by Dani et al., (2007) indicated content ranging from 4.4 to 57.2 mg/100 mg for Canadian white and red grape juices from organic or conventional.
Carotenoids are one of the main groups of plant-based pigments present in nature. These compounds are widely distributed in fruits and vegetables with colors ranging from yellow to intense red (Aguirre-Joya et al., 2020). They have commercial value because of antioxidant property, brilliant colors and health promoting factors (Saini et al., 2018). Derradji-Benmeziane et al. (2014) reported higher levels for cardinal, muscat and Gros noir varieties with 0.87, 1.47 and 1.49 mg/100g, respectively, compared to the results of our study with 0.15 ± 0.02, 0.18 ± 0.01 and 0.37 ± 0.04 mg/100g for the same grape varieties. However, previous studies have reported various ranges of carotenoid content in different grape varieties. For instance, Erbaluce, Barbera and Nebbiolo were previously reported to have 0.11, 0.91 and 0.4 mg/100g, respectively (Giovanelli and Brenna, 2007).
Phenolic compounds are of particular interest since they define organoleptic characteristics such as flavor, color, and astringency of fruits and vegetables. Phenolic compounds are mainly divided into phenolic acids and polyphenols (Aguirre-Joya et al., 2020; Mollica et al., 2021). However, the overriding class of biologically active compounds in grapes is polyphenols involving stilbenes, proanthocyanidins and the most plentiful biologically-active phytonutrients, flavonoids) and they are known for their potential contribution to human health through great antioxidant activity (Pavić et al., 2019). One of the parameters that allow estimating phenolic maturity is the determination of the total polyphenol index (TPI). The results obtained for this parameter are in correlation with the previous study by Rajha et al. (2017) on the monitoring of phenolic maturation of the Syrah and Merlot grapes of KSARA-Bekaa-Lebanon. The high TPC of the black grape extracts is not surprising since this content has already been documented for the Lebanese black grape extracts «Syrah and Merlot» (Bozan et al., 2008; El darra et al., 2012). However, the TPC results for Cardinal, Muscat and Gros noir were different from those of Derradji-Benmeziane et al. (2014) and Tounsi et al. (2009) which reported moderate amounts of phenol. In addition, TPC values in the ethanolic extracts of the Cardinal and Red globe cultivars reported in the Komutiban et al. (2018) study were even higher than those reported in this study. Clearly, the TPC values in the mentioned study (Komutiban et al., 2018) are not fully comparable to ones presented in this paper due to different cultivars and solvent composition. Yang et al. (2009) in their work on 14 grape varieties in the Finger Lakes region of New York State found values ranging from 201.1 to 424.6 mg /100g.
The TFC of the analyzed extracts varied with cultivar. These findings were consistent with previous work (Tounsi et al., 2009; Derradji-Benmeziane et al., 2014) which noted that the TFC varied by variety. However, these authors showed that the TFC of muscat, Gros noir and cardinal extracts was moderate and lower than that found in this study. In addition, the literature data (El darra et al., 2012) are in accordance to the mentioned TFC for Syrah and Merlot extracts. Regarding FLC, the results obtained are consistent with other studies (El darra et al., 2012) which showed the richness of the Syrah and Merlot varieties in flavonols. Nevertheless, these results were higher than the report of Guerrero et al. (2009) on five red grape varieties grown in Andalusia «Spain» with levels varied between 22.1 and 53.8 mg/100g of berries. Moreover, the results of THTC and TCTC were consistent with those of Bordiga et al. (2011) and the study of Tounsi et al. (2009) except Muscat variety. Surprisingly, Muscat, known as poor in polyphenol, had high content of condensed tannin and even higher than Syrah. However, other research has shown that these compounds take on variable values depending on the grape varieties (Carando and Teissèdre, 1999; Aubert and Chalot, 2018; Iglesias-Carres et al., 2018).
Considering the results of anthocyanins, the same observation was shown with Italian grape varieties (Bordiga et al., 2011) where black grapes were reported to have higher amounts of total anthocyanin than white ones. Instead, the anthocyanin content of Syrah and Merlot varieties seemed to be coherent with those measured by other authors (Mattivi et al., 2006; El darra et al., 2012). Several factors can influence the polyphenol and flavonoid contents. One such factor may be the genetic potential of individual species for polyphenol biosynthesis (Tounsi et al., 2009). Apart from the genetic (varietal) background, the environmental factors (light, water deficit and higher diurnal temperature differences) (Li et al., 2014), the cultural practices adopted in the vineyard, the climatic conditions of the region and even the maturation stage of the grape at harvest moment (Da silva et al., 2019) may also be critical in this respect.
In term of DPPH-scavenging potential, the methanolic extracts of black varieties exhibited the highest activity in comparison with the other extracts and closer activity to that of rutin and tannic acid. This finding was observed by Beara et al. (2017) who recorded a higher antioxidant activity for black grape juices produced in Serbia (Cabernet Sauvignon, Frankovka and Merlot varieties) compared to red (Muscat Hamburg) and white grape juices (Italian Riesling, Chardonnay and Sila), respectively. Meanwhile, the scavenging activity of the studied grape extracts against DPPH radical was alike to those obtained for the Pinot Noir grape juices from South Island (Leong et al., 2016). Similar data were also reported by Komutiban et al. (2018) who found that Cardinal and Red globe extracts from Thailand have remarquable DPPH scavenging activity, but discarded with those founded by El darra et al. (2012) who reported slightly higher inhibition percentages of Syrah, Merlot, Cabernet franc and Cabernet Sauvignon extracts grown in Lebanon. In the same context, it was observed that Muscat, which had lower total polyphenol content, had a high DPPH scavenging activity, but the extract from Syrah, with much higher polyphenolic content, had considerably the lower activity (Tounsi et al., 2009). On the other hand, the results of reducing power are in good agreement with those found by Derradji-Benmeziane et al. (2014) in their study on antioxidant activity of Muscat and Gros noir from El-Tarf region and with those found by Samoticha et al. (2017) for the reducing power of Pinot noir grape juices collected from Poland. Unlike, the reported reducing power ability of methanol extracts for Muscat in this study were higher than previously reported in Thailand publication (Tounsi et al., 2009). In the mentioned publication, the IC50 value of reducing power of methanol extracts for Muscat was lower than that of Syrah (Tounsi et al., 2009). As far as we are concerned there are no studies reporting the antioxidant properties of all studied samples collected from Tipaza, Algeria.
Considering results of antioxidant activity, the presence of phenolic and flavonoid compounds in grape extracts showed good linear correlations with the antioxidant power. This is confirmed by the findings of Derradji Benmeziane et al. (2014). These authors found a positive correlation between reducing power and the same parameters in five table grapes varieties. Furthermore, the results obtained by PCA demonstrated that the differences between extracts are due to varietal variability and gave further information about their implication on the antioxidant activity. Anthocyanin and tannins, concentrated in black varieties more than in red and white ones, seem to be the principal contributors to the strong antioxidant activity revealed by the reducing power and DPPH scavenging activity. It is interesting to note that the relative contribution of proanthocyanidins to the overall antioxidant capacities of white grape extract were estimated in previous study to 97% when methanol was used as solvent (Da porto et al., 2014). In support to this, the synergic effect of the antioxidants in the extracts should also be considered (Yakoubi et al., 2021a). In fact, this property is related to the structure of this type of compounds (one or more aromatic rings with one or more hydroxyl groups). This makes them capable to act as antioxidants by electron or hydrogen atom transfer (Yakoubi et al., 2021b). The findings of our study support the view that certain fruits are potential sources of antioxidants. In this sense, the studied grape varieties can be a good natural antioxidant source for use in pharmaceutical, cosmetics and food industries.
CONCLUSION
In this study, a great number of data have been obtained both on bioactive metabolites associated with health and compounds related to the organoleptic quality of table and wine grapes varieties. It is obvious that due to their black color and, consequently, their anthocyanin content, the highest levels of polyphenolic compounds have been observed in Gros noir, Syrah, Cinsault and Merlot varieties. Furthermore, our results also indicate that the highest antioxidant capacity was recorded for Gros noir, Syrah, Cinsault and Merlot varieties. Taking everything into account, data on bioactivity of grape varieties grown in Algeria are highly limited, which makes the results in this work truly valuable. The results obtained showed that the grape varieties studied may be considered as valuable natural sources of antioxidants that are useful for both food and pharmaceutical purposes. Further studies need to be carried out with these and other varieties to verify the impact of the variety in the composition and nutritional value of grape extracts. Further studies on individual phenolic compounds are also needed to elucidate the different antioxidant mechanisms and possible synergism.
ACKNOWLEDGEMENTS
The authors gratefully acknowledge the Ministry of Higher Education and Scientific research of Algeria
AUTHOR CONTRIBUTIONS
Yacine Meziane assisted in performing the experiments, performed the statistical analysis and data visualization and wrote the manuscript. Rima Yakoubi assisted in writing- reviewing and editing the manuscript. Smain Megateli and Cherifa Chaouia conducted the Supervision, conceptualization and visualization. All authors have read and approved of the final manuscript.
CONFLICT OF INTEREST
The authors declare that they hold no competing interests.
REFERENCES
Aguirre-Joya, J.A., Chacón-Garza, L.E., Valdivia-Najár, G., Arredondo-Valdés, R., Castro-López, C., Ventura-Sobrevilla, J.M., Aguilar-Gonzáles, C.N., and Boone-Villa, D. 2020. Nanosystems of plant-based pigments and its relationship with oxidative stress. Food and Chemical Toxicology. 143: 111433.
Aubert, C., and Chalot, G. 2018. Chemical composition, bioactive compounds, and volatiles of six table grape varieties (Vitis vinifera L.). Food Chemistry. 240: 524–533.
Bari, L.R., Ghanbari, A., Darvishzadeh, R., Giglou, M.T., and Baneh, H.D. 2021. Discernment of grape rootstocks base on their response to salt stress using selected characteristics in combination with chemometric tools. Food Chemistry. 365: 130408.
Beara, I.N., Torović, L.D., Pintać, D.Đ., Majkića, T.M., Orčić, D.Z., Mimica-Dukić, N.M., and Lesjak, M.M. 2017. Polyphenolic profile, antioxidant and neuroprotective potency of grape juices and wines from Fruška Gora region (Serbia). International Journal of Food Properties. 20: s2552–s2568.
Bendjedid, S., Djelloul, R., Tadjine, A., Bensouici, C., and Boukhari, A. 2020. In vitro Assessment of Total Bioactive Contents, Antioxidant, Anti-alzheimer and antidiabetic activities of leaves extracts and fractions of Aloe vera. Chiang Mai University Journal of Natural Sciences. 19: 469–485.
Benouchenne, D., Bellil, I., Bensouici, C., AbdullahYilmaz, M., Akkal, S., Keskinkaya, H. B., and Khelifi, D. 2022. GC-MS chemical profile, antioxidant ability, antibacterial effect, α-glucosidase, α-amylase and acetylcholinesterase inhibitory activity of algerian fir essential oil. Jordan Journal of Biological Sciences. 15: 303 – 310.
Boeira, C.P., Piovesan, N., Flores, D.C.B., Soquetta, M.B., Lucas, B.N., Heck, R.T., dos Santos Alves, J., Campagnol, P.C.B., Dos Santos, D., and Flores, E.M.M. 2020. Phytochemical characterization and antimicrobial activity of Cymbopogon citratus extract for application as natural antioxidant in fresh sausage. Food Chemistry. 319: 126553.
Bordiga, M., Travaglia, F., Locatelli, M., Coïsson, J.D., and Arlorio, M. 2011. Characterization of polymeric skin and seed proanthocyanidins during ripening in six Vitis vinifera L. cv. Food Chemistry. 127(1): 180–187.
Bozan, B., Tosun, G., and Özcan, D. 2008. Study of polyphenol content in the seeds of red grape (Vitis vinifera L.) varieties cultivated in Turkey and their antiradical activity. Food Chemistry. 109(2): 426–30.
Carando, S., and Teissèdre, P.L. 1999. Catechin and Procyanidin levels in french wines: contribution to dietary intake. Plant polyphenols. 2: 725–737.
Cayla, L., Cottereau, P., and Renard, R. 2002. Estimation de la maturité phénolique des raisins rouges par la méthode I.T.V. standard. Revue Française d’œnologie. 193: 10–16.
Dani, C., Oliboni, L.S., Vanderlinde, R., Bonatto, D., Salvador, M., and Henriques, J.A.P. 2007. Phenolic content and antioxidant activities of white and purple juices manufactured with organically- or conventionally- produced grapes. Food and Chemical Toxicology. 45(12): 2574–2580.
Da Porto, C., Decorti, D., and Natolino, A. 2014. Water and ethanol as co-solvent in supercritical fluid extraction of proanthocyanidins from grape marc: A comparison and a proposal. The Journal of Supercritical Fluids. 87: 1–8.
Da Silva, M.J.R., Da Silva Padilha, C.V., dos Santos Lima, M., Pereira, G.E., Venturini Filho, W.G., Moura, M.F., and Tecchio, M.A. 2019. Grape juices produced from new hybrid varieties grown on Brazilian rootstocks – Bioactive compounds, organic acids and antioxidant capacity. Food Chemistry. 289: 714–722.
Delso, C., Berzosa, A., Sanz, J., Alvarez, I., and Raso, J. 2022. Two-step pef processing for enhancing the polyphenol concentration and decontaminating a red grape juice. Foods. 11(4): 621.
Derradji-benmeziane, F., Djamai, R., and Cadot, Y. 2014. Antioxidant capacity, total phenolic, carotenoid, and vitamin c contents of five table grape varieties from algeria and their correlations. International Journal of Vine and Wine Sciences. 48: 153–162.
Djeridane, A., Yousfi, M., Nadjemi, B., Boutassouna, D., Stocker, P., and Vidal, N. 2006. Antioxidant activity of some Algerian medicinal plants extracts containing phenolic compounds. Food Chemistry. 97(4): 654–660.
El darra, N., Tannous, J., Bou Mouncef, P., Palge, J., Yaghi, J., Vorobiev, E., Louka, N., and Maroun, R.G. 2012. A comparative study on antiradical and antimicrobial properties of red grapes extracts obtained from different Vitis vinifera varieties. Food and Nutrition Sciences. 3: 1420–1432.
Eshghi, S., Salehi, L., and Karami, M.J. 2014. Antioxidant activity, total phenolic compounds and anthocyanin contents in 35 different grapevine (Vitis vinifera L.) cultivars grown in Fars Province. International Journal of Horticultural Science and Technology. 1(2): 151–161.
Farhadi, K., Esmaeilzadeh, F., Hatami, M., Forough, M., and Molaie, R. 2016. Determination of phenolic compounds content and antioxidant activity in skin, pulp, seed, cane and leaf of five native grape cultivars in West Azerbaijan province, Iran. Food Chemistry. 199: 847–855.
Giovanelli, G., and Brenna, O.V. 2007. Evolution of some phenolic components, carotenoids and chlorophylls during ripening of three Italian grape varieties. European Food Research and Technology. 225: 145–150.
Guerrero, R.F., Liazid, A., Palma, M., Puertas, B., González-Barrio, R., Gil-Izquierdo. A., García-Barroso, C., and Cantos-Villar, E. 2009. Phenolic characterisation of red grapes autochthonous to Andalusia. Food Chemistry. 112(4): 949–955.
Iglesias-Carres, L., Mas-Capdevila, A., Sancho-Pardo, L., Bravo, F.I., Mulero, M., Muguerza, B., and Arola-Arnal, A. 2018. Optimized extraction by response surface methodology used for the characterization and quantification of phenolic compounds in whole red grapes (Vitis vinifera). Nutrients. 10(12): 1931.
Kanha, N., and Laokuldilok, T. 2014. Effects of spray-drying temperatures on powder properties and antioxidant activities of encapsulated anthocyanins from black glutinous rice bran. Chiang Mai University Journal of Natural Sciences. 13(1): 411–423.
Komutiban, O., Katkaew, A., and Jaisamut, J. 2018. Comparison of total phenolic content, antioxidant activity and trans-resveratrol content of fresh red grapes and raisin ethanolic extracts. Journal of Food Health and Bioenvironmental Science. 11(1): 79–95.
Kumar, R.S., Sivakumar, T., Sunderam, R.S., Gupta, M., Mazumdar, U.K., Gomathi, P., ajeshwar, Y., Saravanan, S., Kumar, M.S., Murugesh, K., and Kumar, K.A. 2005. Antioxidant and antimicrobial activities of Bauhinia racemosa L. stem bark. Brazilian Journal of Medical and Biological Research. 38: 1015–1024.
Leong, S.Y., Burritt, D.J., and Oey, I. 2016. Evaluation of the anthocyanin release and health-promoting properties of Pinot Noir grape juices after pulsed electric fields. Food Chemistry. 196: 833-841.
Li, Q., He, F., Zhu, B.Q., Liu, B., Sun, R.Z., Duan, C.Q., Reeves, M.J., and Wang, J. 2014. Comparison of distinct transcriptional expression patterns of flavonoid biosynthesis in Cabernet Sauvignon grapes from east and west China. Plant Physiology and Biochemistry. 84: 45–56.
Mattivi, F., Guzzon, R., Vrhovsek, U., Stefanini, M., and Velasco, R. 2006. Metabolite profiling of grape: Flavonols and anthocyanins. Journal of Agricultural and Food Chemistry. 54(20): 7692–7702.
Mirbagheri, V.S., Alizadeh, E., Yousef Elahi, M., and Esmaeilzadeh Bahabadi, S. 2018. Phenolic content and antioxidant properties of seeds from different grape cultivars grown in Iran. Natural Product Research. 32(4): 425–429.
Mollica, A., Scioli, G., Della Valle, A., Cichelli, A., Novellino, E., Bauer, M., Kamysz, W., Llorent-Martínez, E.J., Fernández-de Córdova, M.L., Castillo-López, R., AK, G., Zengin, G., Pieretti, S., and Stefanucci, A. 2021. Phenolic analysis and in vitro biological activity of red wine, pomace and grape seeds oil derived from Vitis vinifera L. cv. montepulciano d’Abruzzo. Antioxidants. 10(11): 1704.
Molyneux, P. 2004. The use of the stable free radical diphenylpicrylhydrazyl (DPPH) for estimating antioxidant activity. Songklanakarin Journal of Science and Technology. 26(2): 211–219.
Moreno-Montoro, M., Olalla-Herrera, M., Gimenez-Martinez, R., Navarro-Alarcon, M., and Rufián-Henares, J.A. 2015. Phenolic compounds and antioxidant activity of Spanish commercial grape juices. Journal of Food Composition and Analysis. 38: 19–26. h
Oyaizu, M., 1986. Studies on products of browning reaction: Antioxidative activity of products of browning reaction prepared from glucosamine. The Japanese Journal of Nutrition and Dietetics. 44 (6): 307–315.
Pardo-Mates, N., Vera, A., Barbosa, S., Hidalgo-Serrano, M., Núñez, O., Saurina, J., Hernández-Cassou, S., and Puignou, L. 2017. Characterization, classification and authentication of fruit-based extracts by means of HPLC-UV chromatographic fingerprints, polyphenolic profiles and chemometric methods. Food Chemistry. 221: 29–38.
Pavić, V., Kujundžić, T., Kopić, M., Jukić, V., Braun, U., Schwander, F., and Drenjančević, M. 2019. Effects of Defoliation on phenolic concentrations, antioxidant and antibacterial activity of grape skin extracts of the varieties Blaufränkisch and Merlot (Vitis vinifera L.). Molecules. 24(13): 2444.
Pourmaghi-Azar, M.H., and Ojani, R. 1997. A selective catalytic voltammetric determination of vitamin C in pharmaceutral preparations and complex matrices of fresh fruit juices. Talanta. 44(2): 297–303.
Rajha, H.N., El Darra, N., El Kantar, S., Hobaika, Z., Louka, N., and Maroun, R.G. 2017. A comparative study of the phenolic and technological maturities of red grapes grown in Lebanon. Antioxidants. 6(1): 8.
Saini, D.K., Pabbi, S., and Shukla, P. 2018. Cyanobacterial pigments: Perspectives and biotechnological approaches. Food and Chemical Toxicology. 120: 616–624.
Samoticha, J., Wojdyło, A., Chmielewska, J., and Oszmiański, J. 2017. The effects of flash release conditions on the phenolic compounds and antioxidant activity of Pinot noir red wine. European Food Research and Technology. 243: 999-1007.
Sass-Kiss, A., Kiss, J., Milotay, P., Kerek, M.M., and Toth-Markus, M. 2005. Differences in anthocyanin and carotenoid content of fruits and vegetables. Food Research International. 38(8-9): 1023–1029.
Singleton, V.L., Orthofer, R., and Lamuela-Raventos, R.M. 1999. Analysis of total phenol and other oxidation substrates and antioxidants by means of Folin–Ciocalteu reagent. Methods in Enzymology. 299: 152–178.
Skerget, M., Kotnik, P., Hadolin, M., Hraš, A.R., Simonič, M., and Knez, Ž. 2005. Phenols, proanthocyanidins, flavones and flavonols in some plant materials and their antioxidant activities. Food Chemistry. 89(2): 191–198.
Teow, C.C., Truong, V.D, Mcfeeters, R.F., Thompson, R.L., Pecota, K.V., and Yencho, G.C. 2007. Antioxidant activities, phenolic and β-carotene contents of sweet potato genotypes with varying flesh colours. Food Chemistry. 103(3): 829–838.
Tounsi, M.S., Ouerghemmi, I., Wannes, W.A., Ksouri, R., Zemni, H., Marzouk, B., and Kchouk, ME. 2009. Valorization of three varieties of grape. Industrial Crops and Products. 30(2): 292–296.
Van Leeuw, R., Kevers, C., Pincemail, J., Defraigne, J.O., and Dommes, J. 2014. Antioxidant capacity and phenolic composition of red wines from various grape varieties: Specificity of Pinot Noir. Journal of Food Composition and Analysis. 36(1-2): 40–50.
Yakoubi, R., Megateli, S., Sadok, T.H., Bensouici, C., and Bağci, E. 2021a. A synergistic interactions of Algerian essential oils of Laurus nobilis L., Lavandula stoechas L. and Mentha pulegium L. on anticholinesterase and antioxidant activities. Biocatalysis and Agricultural Biotechnology. 31: 101891.
Yakoubi, R., Megateli, S., Sadok, T.H., and Gali, L. 2021b. Photoprotective, antioxidant, anticholinesterase activities and phenolic contents of different Algerian Mentha pulegium extracts. Biocatalysis and Agricultural Biotechnology. 34: 102038.
Yang, J., Martinson, T.E., and Liu, R.H. 2009. Phytochemical profiles and antioxidant activities of wine grapes. Food Chemistry. 116(1): 332–339.
Yuzuak, S., Xie., and D.Y. 2022. Anthocyanins from muscadine (Vitis rotundifolia) grape fruit. Current Plant Biology. 30: 100243.
Zeghad, N., Ahmed, E., Belkhiri, A., Vander Heyden, Y., and Demeyer, K. 2019. Antioxidant activity of Vitis vinifera, Punica granatum, Citrus aurantium and Opuntia ficus indica fruits cultivated in Algeria. Heliyon. 5(4): e01575.
Zhu, M., Huang, Y., Wang, Y., Shi, T., Zhang, L., Chen, Y., and Xie, M. 2019. Comparison of (poly) phenolic compounds and antioxidant properties of pomace extracts from kiwi and grape juice. Food Chemistry. 271: 425–432.
OPEN access freely available online
Natural and Life Sciences Communications
Chiang Mai University, Thailand. https://cmuj.cmu.ac.th
Yacine Meziane1, Rima Yakoubi1, *, Smain Megateli2, and Cherifa Chaouia3
1 Laboratory of Biotechnology, Environment and Health, Faculty of Nature and Life Sciences, Blida 1 University , BP 270, Road of Soumaa, Blida 09000, Algeria.
2 Laboratory of Sciences, Food Technology and Sustainable development, Faculty of Nature and Life Sciences, Blida 1 University , BP 270, Road of Soumaa, Blida 09000, Algeria.
3 Laboratory of plant production biotechnology, Faculty of Nature and Life Sciences, Blida 1 University, BP 270, Road of Soumaa, Blida 09000, Algeria.
Corresponding author: Rima Yakoubi E-mail: yakoubirima2016@gmail.com
Total Article Views
Editor: Tonapha Pusadee,
Chiang Mai University, Thailand
Article history:
Received: February 20, 2023;
Revised: June 2, 2023;
Accepted: June 7, 2023;
Published online: June 20, 2023